FEAR OF SELLING at SUPPORT ZONE? OANDA:XAUUSD
I'm anticipating 1 more drop for Gold on 4H chart. At least to 1460.
Confluence:
BRN
Multiple Support Retest
Confirmation Needed:
Price breakout the Support zone.
Entry:
Sell limit @ 1486, SL @ 1496 (100 pips), TP @ 1460 (240 pips)
TAYOR and let me know your thoughts :)
Fear


Another Total Market Cap Update #2Update:
A few more lines added in to show direction
Down to 190 Billion then...
Up to 212 Billion...
Most likely a dump to follow,
if we break up from 212 then we may be seeing a reversal on the market.
Hard to speculate where we will go from here.
I still seeing the details laid out in my last update panning out,
refer to my last post for relevant data.

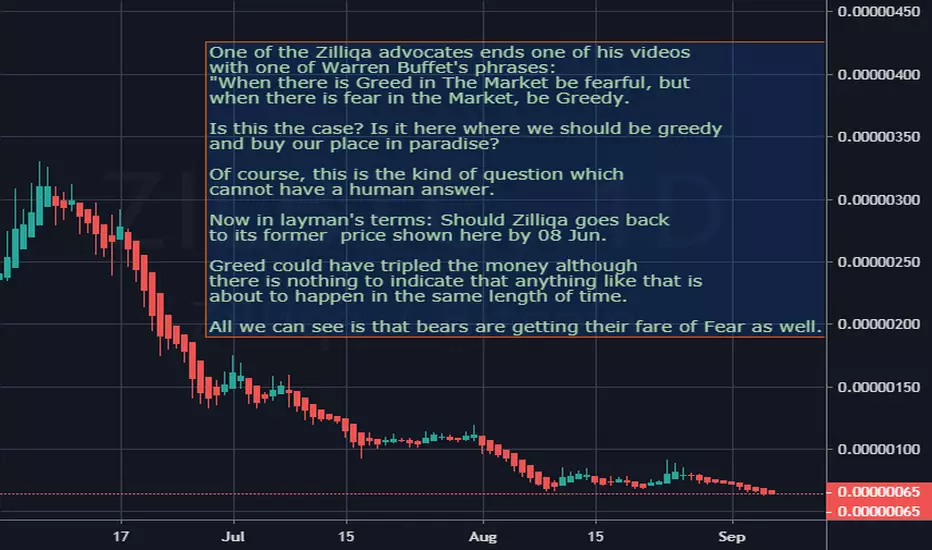
When there is Greed in The Market be fearful ...One of many Zilliqa advocates ends up one of his videos
with one of Warren Buffett's phrases:
"When there is Greed in The Market be fearful, but
when there is fear in the Market, be Greedy.
Is this the case?
Is it here where we should be greedy
and buy our place in paradise?
Of course, this is the kind of question which
cannot have a human answer.
Now in layman's terms:
Should Zilliqa goes back
to its former price shown here by 08 Jun. Only a couple of Months ago;
greed could have eventually tripled the money invested, although
there is nothing to indicate that anything like that is
about to happen in the same length of time.
All we can see is that bears are getting their share of Fear as well.
Always make sure that you understand the risks involved whenever and wherever you invest your hard earned money.
Please, do not take this comment as financial advice or suggestion to perform any action by anybody. Don't worry..... be happy.
Crypto Fear & Greed Index can tell you when to buy BTCWhy Measure Fear and Greed?
Crypto market behavior is very emotional. People tend to get greedy when the market is rising which results in FOMO (Fear of missing out). Also, people often sell their coins in the irrational reaction of seeing red numbers. With our Fear and Greed Index, we try to save you from your own emotional overreactions. There are two simple assumptions:
Extreme fear can be a sign that investors are too worried. That could be a buying opportunity.
When Investors are getting too greedy, that means the market is due for a correction.
Therefore, alternative.me analyze the current sentiment of the Bitcoin market and crunch the numbers into a simple meter from 0 to 100. Zero means "Extreme Fear", while 100 means "Extreme Greed".
You can find the indicator in TradingView and it is quite amazing what it shows.
In a bull market, it actually shows you great buy opportunities for buying the dips or playing the swings!
Hope you will enjoy it!
If you like this post give us a like also. Thank you!

BTC BITCOIN Towards $13,300Binance Is going to Ban US customers, therefore many people will panic and buy Bitcoin. Don’t panic, play on the fears of others.


Prepare for US GDP, ECB results and Fear IndexAt yesterdays' meeting, the Governing Council of the European Central Bank (ECB) decided that the interest rate on the main refinancing operations and the interest rates on the marginal lending facility and the deposit facility will remain unchanged at 0.00%, 0.25% and -0.40% respectively. Nevertheless, the comments from the Central Bank turned out to be very dovish, opening the way to further monetary easing in September. For the euro, of course, this is not a positive sign.
However, we do not throw the euro under a bus yet, because next week’s meeting of the Federal Reserve will likely mark the beginning of a prolonged period of lower interest rates, in our opinion, this event is more important than words about future easing (in the battle of facts with expectations, we will give preference to facts). Also, the euro is supported by the head of the European Central Bank, Mario Draghi, who said that officials had not discussed the rate cut. Our position is unchanged - we buy EURUSD with current price with stops lower than 1.11.
The data on the US GDP for the second quarter will be published today. GDP probably expanded 1.8% in the second quarter, down from 3.1%. If the growth is 2.2-2.5%, then the dollar, perhaps, is not in danger until Wednesday. But if 1.8%, it cannot avoid sales.
So, dollar current price seems to us extremely attractive for its sales.
Meanwhile, the VIX Index ( it is also known by other names like "Fear Gauge" or "Fear Index) dropped to Multi-Year Lows. That is, traders and investors have calmed down. That calls into the question the safe-haven assets growth demand and explains yesterday's weakness of the yen and gold. Given then the level of volatility in gold has increased, we prefer to trade with the Japanese yen. Its purchase against the dollar is still relevant for us.
Our trading recommendations for today: We will continue to look for opportunities for selling the dollar across the foreign exchange market entire spectrum, buying the pound against the dollar as well as against the euro, selling oil and the Russian ruble, and also buying the Japanese yen against the dollar. As for gold, in the oversold we buy and in the overbought area we sell gold.

Copper --> Trade war indicatorConcern grows over global economic slowdown. The US continues to be a leader (for now).
China is the largest copper consumer, and has been beaten down. Technicals don't look good at all. At least there is no divergence.
If Trump and Xi don't reach a deal, you must know - copper will absolutely go down.
P.S:
COPX (Global Copper miners)
CPER (United States Copper)

Trading Truths - how long to be profitable?Trading is hard work - But no one wants to hear that it is hard work. Everyone wants a short cut. A short cut does not exist. If it did - everyone would use it and the market would cease to exist. Everyone who starts out trading is lured in by the profit potential. You might get lucky and make a quick buck. But over time you soon realize that trading is a job, and a hard one at that. The markets offer the highest paid profession in the world - and it is the hardest profession. There are no set paths, clear schooling or achievements which put you into a position of earning a living.
This is an entirely different world. It is you and the market. You are responsible for the actions you make, and the repercussions or rewards which come with those actions. It takes a lot of time and effort on your part if you truly want to succeed long term in the markets. This does not just mean learning about the markets and how they operate. It also requires skills that no other job does - understanding and working on yourself internally.
Remain Humble - We all know of someone who brags about their position, their entry price or whatever. But there is something they likely do not have.. Profits. Ever wonder why the top traders dont brag or choose to talk about how much they make? Because they are humble. If you do not remain humble when it comes to markets, they will humble you. If you are attached to your Ego, you will fail in the market, without question. The only question is how long will you survive?
How long does it take to be a Profitable Trader? Every beginner wants to know how long it will take before they can make a profit. This is a loaded question - with no answer. I am often asked how long until you knew you had it? Or how long does it take to become a profitable trader? People are confused by my answer when I say "you never have it, or anything." Even wildly profitable traders lose money, sometimes all of their money several times.
Trading is not about getting something, or somewhere. It is a journey, a dance. Do you dance or play the guitar to get to the end of the dance or end of the song? No, otherwise you would play or dance really fast! (Alan Watts). You play to play. You trade because you enjoy the act of trading. In other words the act of doing is the goal, not the end result. The market is a teacher who teaches you about your self. If you chose to ignore it and instead focus on what you want out of it; you probably wont get it. If instead you open yourself up, give in to it and what it is showing you; you just might get what you want.
If you found this helpful please like! Feel free to comment or ask questions.

USD/JPY DOWN CHANNEL PRICE STUCK ON A DOWN CHANNEL FORMING LL & LH
SUPPORT BROKEN AND RETESTED, NOW A RESISTANCE
NICE REJECTION WITH A DOJI
NICE REJECTION OF FIB 61.8

We are not on the brink of war. (6/19/2019)Sensationalism. Elections. Iran.
Media is feeding fear.
The journalist that wrote that recent story on OilPrice dot com is part of the problem.

FEAR and GREED Cycle in trading & investingTrading definitely complicated and hard phycological activity, everyday every trader on a planet is on the edge of financial collapse. When it comes to the new traders/investors usually falls in FEAR and GREED trap. Try to avoid this cycle, learn Technical analysis and emotion control.
Good luck!

"VIX, a powerfull tool to use on SP500" by ThinkingAntsOk
-Today we are going to show Vix Index on daily chat compared to SP500 (orange line).
The first thing we noticed is the Wedge formations on the chart.
-As Vix starts going down, SP500 keeps rising, the concept is that people trust on the strength of the bullish trend, on this process we can see the Wedge patterns on VIX, and bullish trends on SP500.
-To see the Wedge Pattern we only need to draw a line between the higher lows on VIX.
-OK great! But how can I do something with this?
-Let’s see it on this way, imagine you have been following a bullish movement on SP500 and you see that is about to face a major resistance zone and you observe that the bullish trend is losing strength.
When you detect this, you are going to Focus you attention on the VIX chart, and you are going to ask yourself the next question.
-Is price inside the Wedge Pattern or is about to break out?
-If the price has broken out the structure and SP500 is on a Major reversal zone, then, that’s a strong bearish confirmation to start thinking on bearish setups.
-Why should I look for bearish setups?
Because that means that people is starting to have fear of a possible bearish movement that’s the reason VIX is making new highs and has broken the Wedge pattern, we should complement this by seeing bearish candlesticks on SP500 with high volume on them.
-Conclusion: see on the pictures how Vix preceded the beginning of the two previous bearish trends with a breakout signal.
-Complementing charts is always a good way of making your setups more solid.
*Please note that the above perspective is our view on the market, We do not give signals and take no responsibility for your trades.

Where we are? Fear And Greed & NVT IndicatorBitcoin is in bullrun, or in bull trap? Everything would look great (except for short-term unsustainable parabolic growth), but ... these two great indicators show great trouble .
The first indicator is the Fear And Greed index . Do you know the Fear And Greed index? If not, google ...
This indicator shows greatly what emotions are in the market.
The second indicator is my favorite NVT (Network to Value).
NVT has an amazing ability to predict crashes even in places where conventional indicators can't predict it.
Both of these indicators show extreme values . They are even the !!highest values in history!! The high values of these indicators have always meant a huge fall ... look at the chart.
Some ideas?

Why BTC could be going MUCH lower. Part II: Vox populi"Be fearful when others are greedy and greedy when others are fearful.”
Possibly one of the most influential quotes of all time when it comes to investing. While this is necessarily not always the case, Warren Buffet understands that the whole merry-go-round that we call the stock, gold etc. markets are based on one, though far from simple, thing: psychology of the participating individuals.
It is the reason why 90% of all individuals fail in trading as they are lead by emotions and irrational deicisions. The other 10%? They understand the game and simply go against the mass sentiment of the sheep, profiting of off them in the process.
So what is the current sentiment in the crypto sphere?
alternative.me
Well, if we take a look at the crypto fear and greed index we can see that currently greed is in the market with a valuation of 57 (you can look up on what the whole algorithm is based on). If we take the TA approach, we can see that the 60 mark provides a heavy resistance. 56 is the point at which Bitcoin tumbled, broke 6k and capitulated (though if that was the true capitulation remains to be seen).
What does this mean?
Well, firstly, do note that there are times when a greedy overall sentiment can be justified. For example, if Bitcoin made a higher high and established a firm support at a new level that would definitely mean that greed is, at least for the short tem, a justified sentiment. Another example would be Bitcoin decisively breaking the 6k support-now-resistance level as that would essentially signal the start of a new bull market.
But, with that being said, can the greed really be justified in this point in time?
If you look at the TA fundamentals, we are now facing heavy resistance on a weekly time frame with a multitude of indicators:
1. 200 EMA (in red) is holding the price firmly below 4100
2. 20 MA (in black) is falling down like a bomb and though an argument can be made that we broke it, I would like to see a breakout with A LOT of volume. Breaking such significant MA is no small feat and any breakout without volume cant really be taken particularly seriously.
3. RSI on the weekly is 1. overextended and 2. at a super heavy resistance around 43,44
In short, the sentiment is telling us moon while the TA is telling us a completely different story. That would make the current greed sentiment UNJUSTIFIABLE.
I plan to take additional short positions and cant wait for these thing to fall like a rock to at least 200MA. Once there we will evaluate the position and react appropriately.
Stay tuned for Part III of the series, where we will take a look at an indicator with a literally 100% accuracy. Thank you!
P.S. If you like my analysis, please hit a like as otherwise, if no one is reading them there is no point in writing them either.

RGR: All American BreakoutI love holding Sturm Ruger stock, and it returned me a cool 30% last time I held it from buying at $50 and taking profit at $65 after the Parkland shooting. RGR has an inverse relationship with news media sentiment for the firearm industry because they're customers are driven by fear as much as enjoyment of owning and operating firearms. Every time the news media reports on a high fatality count shooting, RGR and the other firearm and ammunition industries go up because their customers fear a ban and go drive short term sales in a way that resembles a bank run. It's so predictable, you could set a clock by it.
First level resistance will be $52.50 likely crossing the 20 or 50 day SMA within a week or two with it easily sailing through if this is a real trend and not a false breakout. Expect a more firm resistance at $56.50 coming up at the 200 day SMA with the sky the limit depending on how long this gun control media cycle starts up again. I even went out and stocked up on equipment myself to get ahead of rising prices anticipating a surging demand.
MACD is showing a strong reversal after stalling downward action in the prior weeks. We're hitting of a yearly low, so news like this is a harbinger of a strong regime change in the opposite direction. The price is rising off an RSI low at 28 and rising up through signalling a buy on that tried and true value investor indicator. Expect money flow and price momentum to rising and go positive very soon as a trend confirmation indicator if you're nervous about going long right away. Volume spikes huge on Friday, but didn't drive the price up too much yet, so there's still time to get in on this one at the ground floor.
I've already gone long and plan to hold for a few weeks to a few months to enjoy the full run of this cycle back upward. It's not my first time to this rodeo.

The fear in their eyesThe VIX is known as the 'fear index'. It has taken a pulse north which is not unexpected, as volatility on the P SPX500 took a leap recently.
The VIX is not an index I trade, nor do I know anyone who trades it. Its value is in keeping a finger on the 'pulse' of the stock market.
When the VIX begins to pulse, expect trouble. Some see trouble only after it has happened.

S&P 500: Panic breaks outThis is a short one. It appears that the SPX spooked itself last night! Well, to be fair it was probably news of the death cross which caught some investors, that was related to some price action.
Markets - at their tips - are ruled by hope, fear and greed. Watch this space. No predictions - as usual. :)

Sentiment thoughts on XAUStocks crashing, media pushing fear on the hourly - like always - so in short, bought gold. I anticipate a bit of a correction from recent resistance breaks but overall ...I am long.

BTC - Fear & Greed Index vs price, can repeat history?Hi I show you some different view on Bitcoin now, I am looking for sentiment and Fear & Greed Index.
Fear & Greed Index is now on 12, that low was in April 2. Everytime in this year if index was under 15 than price go up.
Stochastic in history look similar like now.
Februar 2. Index 8 (100% up in 13 days)
April 2. Index 11 (42% up in 21 day)
June 29. Index 16 (45% up in 20 days)
October 18. Index 13 (10% up in 4 days)
November 23. ?????
This is just my idea about this Fear & Greed Index, looks possitive for me, so I want to share with you.
I will be update it
Thank you

EOS Crash not over yet!! Another 45% to go!!SELF DEVELOPMENT/METHODOLOGY/PSYCHOLOGY
EOS in free-fall !!
BITFINEX:EOSUSD is down by more then 83% this year!!. We are looking for another significant drop to the @2 level, thats another 45% wow!
From my experience stay on the sidelines.
Follow your Trading plan, remained disciplined and keep learning !!
Please Follow, Like,Comment & Follow
Thank you for your support :)
This information is not a recommendation to buy or sell. It is to be used for educational purposes only!
Update idea

Houston, we have a pb?Based on my Analysis: How impressive the bears are for embarking a lot of people in their coup. My last resistance barrier is at 3838 USD. But I see already a resistance above that.
The bears are so strong, The price has already breached it a bit but it didn't fully rushed through yet .
The price is about to slow down. We have a good pattern seen in the S4W/MirrorStop indicator. Normally lines should always cross each other. But as we can see, the red rebounded and it didn't cross yet. That's a good scenario telling the price is about to go up. And if a second rebound happens, before crossing, we will enter into a reverse scenario that made the price falls from 6400 USD to here (price will significantly go up). At least there is a climb to occur, but bears are still in charge , for now.
The up move will occur only after the the S4W/MirrorStop line will cross again. So we are still far from it to occur. That still give a change for a new rebound before crossing. That would be really nice.
I think the price will slow down anyway very soon. I'm not afraid of the current fall. I would say there is 70% chance, that horizontal line I've draw near the price will be a resistance level. We have a mark about this in the S4W/Normalizer. If horizontal line is cross, the price will really slow down its fall.if the value goes up it's interesting though. At least, it will flatten, at best, it will make the price rising up
Remember all the horizontal lines I've drawn on my last ideas. They are still here and play important role of support/resistance...
PS: Don't take my words for granted. Analyze, re-analyze, then trade at your own risks.
PS2: If you like this analyze, please click the LIKE button. FOLLOW me also to get my latest ideas. Thank you very much.
