$BTC Liquidity Spigot = RRP > TGA > FED BSThe RRP is tapped out.
The Fed Balance Sheet is irrelevant.
Now is time for the TGA to shine.
Fedbalancesheet

RRP Exhaustion and TGA Rebuild Signal a Tightening Cycle1. Overview
Liquidity conditions across the U.S. financial system have entered a tightening phase once again.
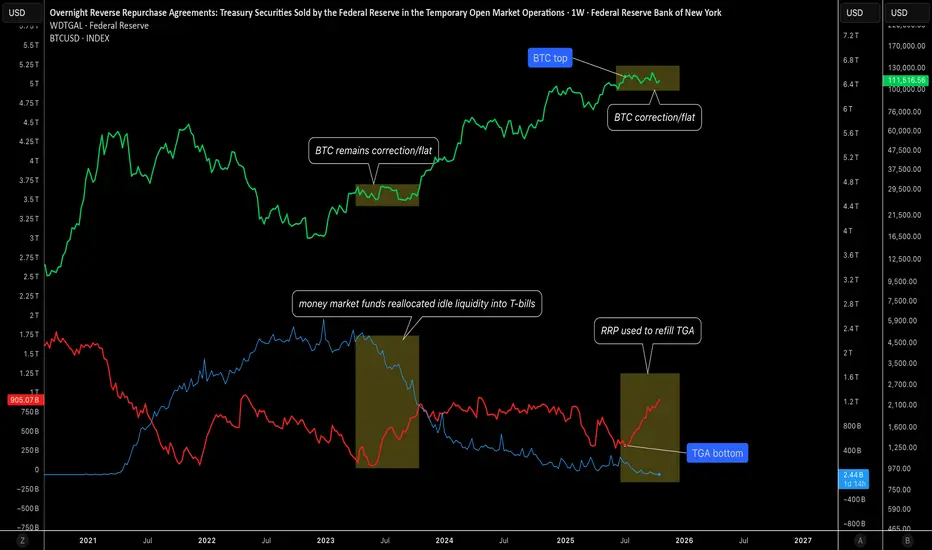
The U.S. Treasury General Account (TGA) has surged from its June low of around $200 billion to roughly $905 billion today, while the Federal Reserve’s Reverse Repo Facility (RRP) has collapsed to just $2 billion, effectively empty.
This shift marks the end of the liquidity buffer that had supported markets over the past year, and the consequences are now visible across risk assets, particularly Bitcoin, which has been trending lower since the TGA bottomed in June.
2. Liquidity Mechanics
The interaction between the TGA and RRP is central to understanding current market dynamics.
- When the Treasury rebuilds its TGA, it issues short-term bills and absorbs cash from the financial system.
- During 2023 and early 2024, this liquidity drain was largely offset by reductions in the RRP balance, as money market funds reallocated idle liquidity into T-bills.
- That mechanism kept overall market liquidity relatively stable — the RRP served as a shock absorber.
Today, that buffer is gone. With RRP nearly depleted, any additional TGA build now draws directly from the banking system’s reserves, tightening liquidity conditions beneath the surface.
3. Liquidity Inflection and Market Correlation
The TGA bottomed in June at around $200 billion, a point that coincided almost perfectly with the Bitcoin top near its recent cycle highs.
This correlation is not coincidental, it reflects the direct relationship between system liquidity and speculative risk demand.
As Treasury began rebuilding its cash balance, liquidity was redirected away from markets and into government accounts.
That liquidity drain aligns with the ongoing weakness in high-beta assets such as crypto and small caps, despite relatively stable macro data and policy expectations.
4. Current Liquidity Regime: Neutral in Level, Tight in Flow
At the aggregate level, liquidity may appear neutral — the increase in TGA has been offset by the decline in RRP, keeping the total size of Fed liabilities roughly unchanged.
However, the composition of that liquidity has deteriorated.
- The RRP is now empty, meaning the system no longer has an easy liquidity source to fund further Treasury accumulation.
- TGA is high and rising, effectively absorbing capital that could have supported credit or speculative flows.
- The bank reserve base is beginning to feel the pressure, tightening funding conditions quietly but steadily.
The result is a liquidity regime that is not collapsing but no longer expanding, which explains why risk assets are stagnant. There is no incremental liquidity flowing down the risk curve.
5. Fiscal and Structural Headwinds
The current U.S. government shutdown further complicates the outlook.
It restricts Treasury operations, delays issuance flexibility, and slows the recycling of liquidity back into the private sector. This prevents the RRP from being refilled and reinforces the liquidity stasis across markets.
In other words, the system is locked:
- The TGA is high and still rising.
- The RRP is empty.
- Reserves are now the adjustment variable, meaning further tightening could emerge if the Treasury continues to absorb cash.
6. Market Implications
- Liquidity exhaustion is becoming visible in market behavior.
- The TGA rebuild represents a clear liquidity drain as it is no longer offset by RRP balances.
- BTC’s reversal from its June peak reinforces the correlation between Treasury liquidity cycles and speculative risk performance.
The neutral aggregate liquidity masks an underlying structural tightening, there is no new money reaching markets.
Until the TGA begins to decline again, releasing liquidity back into the system, the bias for risk assets remains constrained. Markets are likely to remain choppy, with limited upside momentum due to the absence of fresh liquidity inflows.
7. Conclusion
Liquidity conditions are neutral in total but tight in structure. The RRP’s depletion removes the last line of defense against Treasury-driven liquidity absorption.
With the TGA near $905 billion and still rising, risk assets are operating in an environment where no new liquidity is entering the system, only being recycled internally.
The correlation between June’s TGA low and Bitcoin’s top highlights just how sensitive speculative assets are to liquidity cycles.
Until Treasury spending or Federal Reserve policy shifts inject new reserves into the system, market liquidity will remain capped and so will risk appetite.
$RESPPANWW Fed Balance Sheet at 2020 Level Before QEVery interesting chart to watch here FRED:RESPPANWW
Clearly shows we're still in QT, but obviously markets have been pumping.
The Fed balance sheet is sitting at $6.9T which is the level in 2020 when the Fed continued its 2nd round of QE.
I doubt they would announce they are buying assets again at the next FOMC on 12/17, but quite possibly at the January or March 2025 meeting after Trump takes office.

Macro Monday 61 - Fed Balance Sheet Signals Liquidity BounceMacro Monday 61
Fed Balance Sheet Hits Long Term Supporting Trend Line
The Federal Reserve Balance Sheet
The balance sheet is published weekly, typically on Thursday afternoons, and it provides valuable information on the direction of global liquidity and the fed’s monetary policy.
When the Federal Reserve’s balance sheet increases, it means that the central bank is acquiring more assets. This expansion can occur through purchases of Treasury securities, mortgage-backed securities, or other financial instruments. The increase in assets typically leads to greater liquidity in the financial system and can influence interest rates. Conversely, a decrease in the balance sheet indicates asset sales and reduced liquidity
The Chart - FRED:WALCL
▫️ Since April 2022 the Federal Reserve Balance Sheet has reduced from $8.973 trillion to $7.140 trillion (reduction of $1.833 Trillion).
▫️ Right now, the chart has signaled that we have hit a critical diagonal trend line support (red line on chart).
▫️ We have hit this red trend line twice in the past (Sept 2019 & Aug 2008) and on both occasions it bounced from the red trend line and the balance sheet thereafter increased significantly for 2 to 5 years.
If you follow me on Trading view, you can revisit this chart at any time and press play to get the up to date data and see if we have held the line or fallen below it.
What does the following mean to you?
✅High likelihood of interest rate reductions in Sept.
✅Apparent stabilization of the rate of inflation (U.S)
✅A current stable labor market in the U.S
⏳The possibility of the balance sheet bouncing from trend support and increasing from the support line as it did in the past for 2 years+ (Increasing Global Liquidity).
Versus
🚨 The yield curve un-inverting (moving above 0)
🚨 Sahm Rule Triggered
🚨 The marginal increase in the U.S. Unemployment Rate which is consistent with prior recessions.
🚨 U.S. Initial Jobless Claims and Continuous Jobless claims have had increases consistent with pre recession historic activity.
🚨Job openings reducing since March 2022 from approx. 12m to 9m (this would be the largest pre recession drop ever if followed by a recession.
🚨 Warren Buffet sitting on the biggest pile of cash ever.
Does this all say “soft landing” imminent or should we be worried?
In my opinion, we will know by Jan 2026. Its a big window of time, but the timing is the biggest challenge, and if we can take one thing from the above, volatility is guaranteed.
Happy Trading
PUKA

Quantitative Tightening Effects on the Markets This video tutorial discussion:
• What is QE and QT?
• Each impact to the stock market
• The latest QT, how will the stock market into 2024?
Dow Jones Futures & Its Minimum Fluctuation
E-mini Dow Jones Futures
1.0 index point = $5.00
Code: YM
Micro E-mini Dow Jones Futures
1.0 index point = $0.50
Code: MYM
Disclaimer:
• What presented here is not a recommendation, please consult your licensed broker.
• Our mission is to create lateral thinking skills for every investor and trader, knowing when to take a calculated risk with market uncertainty and a bolder risk when opportunity arises.
CME Real-time Market Data help identify trading set-ups in real-time and express my market views. If you have futures in your trading portfolio, you can check out on CME Group data plans available that suit your trading needs www.tradingview.com

Federal Reserve Balance Sheet SnapshotFederal Reserve Balance Sheet Snapshot
- Between the 11 - 18th Sept 2023 we had the Largest
one week decline of approx. $74.7 billion since the
balance sheet reduction started in April 2022
- We are currently approx. $50 billion away from a
1 trillion reduction 👀
We are in for an interesting Quarter end to the 2023 year, that is to say the least.
Stay Nimble
Puka

FED Balance Sheet - Ex-Shadow Operations / Ex- FASB 56Run-Off...
The only thing running is Bids for MBS and USTs.
After an aggressive May 25th, $51 Sell ahead of
the June 15th Taper was stopped dead in its tracks.
____________________________________________
Imagine swimming in the middle of the vast Pacific Ocean.
Bumping into Flotsom and Jetsom every so often.
It's lonely out there...
Nowhere to run.
Paddle?
You'd need a Lifeboat.
It Sunk.
