Butterfly Effect FET/BTC #FET $FET #FetchAIA Bullish Butterfly pattern appears to be forming here on our FET daily chart . Wow! We just dumped out of that triangle/pennant structure we had been in before! It happens in crypto - what can I say ! Every chart dumped when Bitcoin dumped . We were in a triangle type structure before but we broke bearish and went below it . You can see what looks like a letter 'M' on the chart now? That could be what is called a Bullish Butterfly harmonic pattern . Now I should say at this point that this chart DOES NOT fit the butterfly pattern perfectly. But it fits pretty close and if that's what it is then our bottom should be in more or less (though it can always wick a small amount ) . That's Point D of our harmonic . We went there last night . If we break upwards from there our target is the 1.618 fibonacci extension shown on the chart which is at 1398 sats ( where the little X is on the chart ). That would be the target .Now keep in mind if this chart continues to break downwards then it might invalidate this Butterfly pattern and there might be something totally different going on ! We have to let it play out . Things can change quickly in crypto . It is what it is . Now I've had a couple critics of my charts say that "Hey! You were wrong about that triangle ! Maybe you're wrong about this too ." I can only say when Bitcoin dumps many chart patterns will change into something else . It happens . We must be prepared for wild swings in a bullrun year . I'm still learning too , but at least I'm trying.
Also you will notice the name of this chart is Butterfly Effect - this is a concept from Chaos Theory which seems to fit the last couple of weeks pretty well ! It's the idea that one small change in a system can cause much larger changes to happen in that system later . Or put another way that one small incident can have a big impact on the future ! Wow! That fits the times we're living through right now ! Where one small sentence from Elon can cause massive changes in the markets ! But anyway - it would be nice if the dumping is done and we start a rise toward 1400 area. Let's let it play out and see.
Fib

Gold - shorting opportunityAs the current uptrend is getting exhausted at the resistance levels, we can get correction to 0.236 levels next week

Crunch Time For FET/BTC #FET $FET #FetchAIIt will soon be Crunch Time for our FET chart ! As you can see - after our big rise - we've been in this triangle for a couple months - consolidating but being supported by our higher timeframe Ichimoku clouds also (3 day and weekly . ) It seems by June 5th we will reach the apex of this triangle and at that point we must pick a direction. Now with Bitcoin's recent dump down to 30k that has caused a dump from our recent attempt to break upward out of this structure and continue up to 1550 area . So our chart is left looking a little funky ! But since there are other indicators such as Ichimoku and also the general trend upward during a Bullrun year I would still expect this triangle to break upward within a couple weeks . I'm prepared for Crypto to throw me some curveballs though ! As we've seen recently even a tweet from my guy Elon Musk can send a coin pumping - or not ! But you have got to remember - it's a Bullrun year ! This is not a normal year . Any coin coming from the bottom should start to hit it's fib retracement targets at some point . And we've yet to reach our first fib target near 3420 , which is our .236 fib . I firmly expect us to get there . And above ! Question is what structure we take to get there after this triangle plays out . I'll link my fib targets for FET in the linked chart below . Also as a side note - you may notice I was calling this a Bull pennant before and I'm now calling it a triangle ...well, you've got to be flexible in crypto because sometimes chart patterns change ! And if something is taking a longer time to form it's actually possible it's a symmetrical triangle type structure as opposed to a pennant ( since a pennant generally doesn't take as long to play out . ) So be prepared to change your view if things play out differently ! But I'm still bullish and I still expect upside here . Let's see what the next 2 weeks bring .
Sidenote - some people are calling for Bitcoin to dump to 20k but that is not guaranteed to happen so take it with a grain of salt.

$nok - consolidating for next leg up+ declining volume. bullish above POC (dashed orange line).
above 5.18 we easily see 5.44.
this is all short-term, of course. will post more updates along the way.

Where do we go from here? The fight to keep 42k or down to 30k.These are the short term possibilities that can occur within the next weeks or days(imo).
In the short term, every time we hit support it turns into resistance. (Bearish Bias)
If this selling pressure keep it up we may end up around 30k.
Real value of BTC around 30k?
Too much FOMO happened in that area it seems, so we may correct to 30k, if selling pressure keeps up.
This is just a thought an don't take this as advise, use a tight stop loss in this market because it's so easy to get liquidated on both sides at this moment.

BTC - DailyA bunch of confluences of the last few Weeks / Months.
Elon's tweet about centralization and miners is another confluence.
Combined this with the High Time Frame charts all looks good, similar to the XRP sells posted a few days ago

EURUSDAs we can see the market is trending up. The price touched the trendline and also rejected a strong 4h level. if we check the fib retracement we can see that it rejected at the golden zone 50-61.8

HTBX Fib Time ExtensionsNear July is what the Fib Time is projecting for a change in price movement/direction. Until then, one can see the 5 price range is becoming retested. If the price can stay above 5 support, and reach the Fib time extension, one could see a nice upward change in trend.

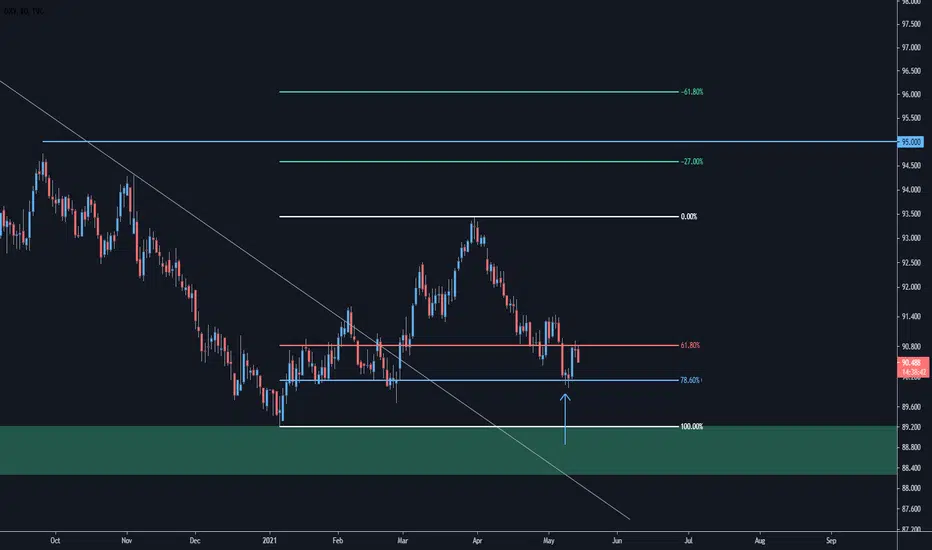
DXY - DailyZooming in further with the help of a fibonacci, we should see this continue up towards the 95.00 region should these retracements hold.
Originally meant to post when we were at the 78.6%, oops
Bullish Candle Close ! Here We Go ! FET/BTC #FET $FET #FetchAIGreat news for FET ! After that pullback we've finally closed a candle that breaks above our downward trendline . This looks Bullish -and good to continue up. We will be revisiting that 1550 area again it seems . But will we finally break through it ? It will be our 3rd time now to hit that resistance there . Will we break through it this time ? 3rd time's a charm ! Let's see ! After we break through that 1550 area I would expect us to hit 2000 or so and then go towards our Cup & Handle target near 2890 . Weekly resistance is near 3200 sats and our .236 fib is 3420 . Above that is fib targets which I will link in my chart below from March . Notice we hit a TD Sequential 9 in red going donward but that last Number 9 candle is actually turning green as well as breaking above that trendline ! You can see it where the green arrow is pointing on my chart . That's our turnaround candle ! This looks absolutely good to continue up as well as having great fundamentals and a great team at Fetch AI .

GC eyeing 1900Gold at very important point here. Gold seems to be accumulating here at resistance. If it breaks resisitance look for first take profit about 1874 and then if this resistance breaks the 1900-1910. If current resistance not break then look for pull back and another attempt with this set up. Targets are all fib extension 1.272 and 1.618.

XLMUSDBased on the FIB Extension on Jan 28 / Feb 13 / Feb 21, I expect a similar pattern for the Apr 2 / Jun 5 timeframe.
Not investment advice.

Ethereum crushing - New ATH multiple times daily????Ideas are in the video - sorry, LazyBear 😂, "Volume Accumulation Percentage Indicator" was the name I couldn't recall in the video. All three that were used in this chart are solid though. By far in my top 8 or so indicators to use in, basically any time-frame above 15 minutes. Please feel free to share your thoughts, feelings, possibly concerns - keep the secrets to yourself though.

ETH is coming for the crownSo, as you can see, since ~20th of Feb, we've entered and, for the most part, stayed within the Pitchfork channels the entire time. Only exceptions being a few of our four hr candle wicks busting thru the support beams at the bottom, but they always closed above.
Now, we are at the top resistance line of the last channel. Separately, there is a new channel that we have broken into (pink and green trendlines) more recently, when we started hitting ATHs daily, and sometimes multiple times per day, with ETH. Following up the chart, you'll see the cyan and pink horizontal support and resistance levels we are currently using, and finally, circled in yellow: where I believe ETH is going to be forced to make a big move. Indicators show, to my knowledge - which is dubious at best 🤤 ***this is not financial advice*** - that we are going up. However, both ETH and BTC it seems are due for a correction, so, possibly this is it coming up soon.
Regardless of which way the candles go, always have stops and takes set. Or else you'll get rekt. And then, what was the fucking point?? Good luck! (Check chart on daily as well for more confirmation with these indicators)

TSLA - Daily with Fib Retracement TSLA - Daily with Fib Retracement
This is one of the top 3 chart resources I always tell a new trader to learn. Again, you have to remember, the fib retracement can be used to predict potential support and resistance. It is not some magical indicator.
"Each level is associated with a percentage. The percentage is how much of a prior move the price has retraced. The Fibonacci retracement levels are 23.6%, 38.2%, 61.8%, and 78.6%. While not officially a Fibonacci ratio, 50% is also used."
"Fibonacci retracements can be used to place entry orders, determine stop-loss levels, or set price targets. For example, a trader may see a stock moving higher. After a move up, it retraces to the 61.8% level. Then, it starts to go up again. Since the bounce occurred at a Fibonacci level during an uptrend, the trader decides to buy. The trader might set a stop loss at the 61.8% level, as a return below that level could indicate that the rally has failed. "
Last two quotes from Investopedia article on Fibonacci Retracement Levels.

XRP Daily - SellsAlternatively to my previous post, this could play out for another buying opportunity under $1.
If this is to come through we would be extremely lucky to be able to buy again at $0.50 - $0.50.
I won't be selling any at these prices but I always have capital ready should this come through.

XRP Monthly $5 SoonLooking at the bigger picture with the help of a fibonacci.
See you at $5 soon this year 😎

RZI Analysis + Possible Entry PointI believe that now would be a good time to buy into RZI because it is reaching a critical support level. Raiz is a great company with a growing customer base and is on track to having $1 Billion FUM by the end of 2021.
Raiz has bounced back to support at around $1.42 and may bounce back up to around $1.75 for a 20% upside. Personally, my SL will be at $1.27 which would net a 12% loss. Furthermore, the RSI suggests that RZI is extremely underbought which may make it a great time to buy-in.
However, this is not financial advice do your own research :)

$EOS/BTC entering uptrendLike the majority of cryptos EOS is another one entering a uptrend.
Looking at it from a High Time Frame perspective shows an opportunity for high targets.
While there could be an explosion of price like we saw on DOGE, one should be prepared for a slow grind in the uptrend which might take a much longer time then most anticipate (1+ years).

DOGE Aligning with Fibonacci RetracementDOGE on the one hour timeframe is aligning well with the Fib retracement lines.

Moon Targets FET/BTC #FET $FET #FetchAIHere we see our weekly FET chart from Binance . And you can see that colorful Gann Fan indicator on it . You see where that purple X is on the chart ? That's up near the top of the Gann Fan and lines up almost perfectly with the .782 fib line near 11000 sats . That seems like a possible target for early 2022 because it is also brings us to the top of the Gann Fan line. This isn't guaranteed but we are in a bullrun year and FET has already closed above that Cup Handle and looks good for more upside .Soon enough we will be back up to our 1550 area and eventually continue on up. I believe the fibs are our targets here going up. The first fib above us is the .236 fib near 3420 and it will be great to see that area by the end of June ! But let's see . You see our fib above that is the .382 and it lines up almost exactly with the top of that light blue line ! So these Gann fan lines are looking good . Next is the .5 fib near 7077 . Jump above that to the .618 fib and it sits just above another Gann line , so these targets seem pretty strong . Above that is our .786 fib near 11000 . Is that our end target ? For early 2022 ? Maybe but this FET chart looks great ! We also had a Green monthly candle last night and that's good - I think FET will post Green monthly candles for the rest of the year .

Short idea on GU after break of hourly structureYesterdays candle closed as a very promoting SS (shooting star), this was seen after a convincing move higher towards a slight daily level. This SS gives me confidence that price will reverse and go down to the untested level on the daily (5th April). We can see that if price comes back to the level now without a move lower we will have 61.8Fib confluence (very strong confluence). We will also have out 50EMA hovering around that area. We have out stop just above the high of the impulsive move down. Nobig news to come out today on either currency so we don't have to worry about watching out for that.
If we get in I will close out at 4PM as it is Friday and I don't hold over the weekend.

USDCHF long usd chf is currently testing an inflection point that has fib confluence this could be a potential buying opportunity after price action plays out
