Gold More Chances to Buy Now at this its price on exactly on VALUE AREA LOW POINT .its more Chances to goes Bullish side at 4370.289 to 4382.893 (POC and Value Area High ) these area are Struggling for if price break that level then will be another BULLISH Move 4548.009.
let’s see how price reacts around this level
DISCLAIMER
This is made for educational and informational purposes only.
It is not financial, investment, or trading advice.
Trading involves risk, and past performance doesn't guarantee future results.
Always do your own research or consult a licensed financial advisor
before making any trading or investment decisions.
The creator is not responsible for any profit or loss from your actions.
We don't offer paid signals or account management services.
Beware of scammers using our name - we are not connected to them.
Fibbonachi

ZM: buyers are back and momentum is buildingZoom Communications spent a long period outside investors’ focus after the post-pandemic correction, but the fundamental picture is gradually improving. The company remains profitable, holds a strong cash position, and carries no critical debt. Zoom continues to evolve from a single-product company into a broader enterprise communication platform, expanding Zoom Phone, Contact Center, and AI-driven business tools. As interest returns to stable SaaS models and the tech sector regains strength, ZM is starting to look undervalued again.
From a technical perspective, price is trading inside a rising channel. After an extended accumulation phase, buyers have confirmed their presence. Price holds above the 50 and 100 EMA, while the 200 EMA acts as long-term dynamic support. The recent impulse was supported by increasing volume, signaling institutional participation. Market structure remains bullish with higher lows intact.
The current area represents a confirmation and accumulation zone. As long as price holds above local support, adding to positions remains justified. The first target is the upper boundary of the channel and prior highs. If momentum accelerates, price may extend toward the next resistance zone, where partial profit-taking becomes reasonable. A breakdown below the confirmation zone would invalidate the bullish scenario.
Markets often move when they feel quiet. The key is being positioned before the move becomes obvious.

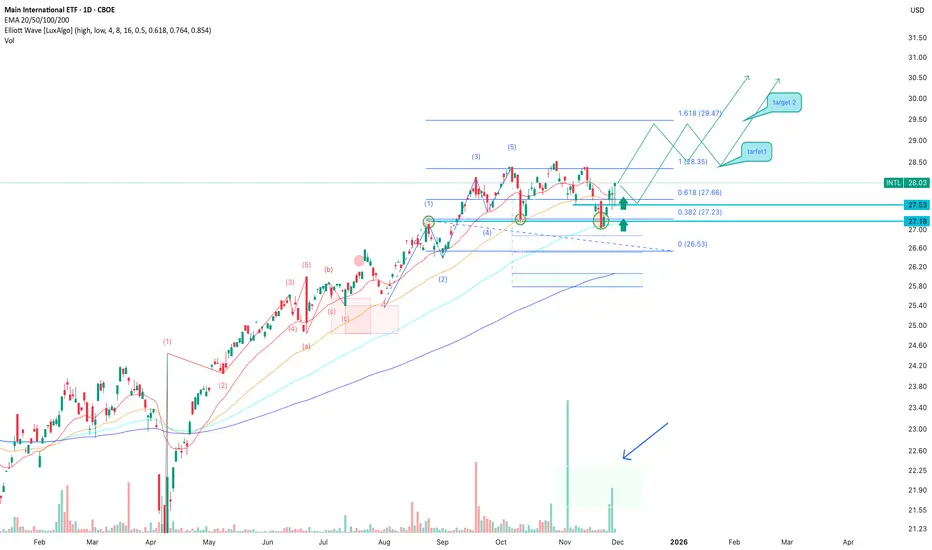
INTL: Bulls Defend Support — Buy Zone ActiveINTL remains one of the more stable international ETFs, and recent weeks show growing interest from larger players — rising volume at local lows signals accumulation. Fundamentally, the ETF is supported by diversified exposure to global companies, relatively low volatility, and renewed capital inflows into international markets as the USD cools off. This macro backdrop creates a solid foundation for a medium-term continuation of the uptrend, especially if expectations of potential Fed easing stay in place.
Technically, the price continues to defend the key support area at 27.50–27.20, where buying activity has appeared multiple times. The decline looks like a correction inside a broader bullish structure, while EMA 20/50/100 indicate a possible recovery. The Elliott wave structure also keeps the potential for a new impulsive move. A confirmed breakout above 28.35 would open the path toward 29.47 as the first target. The optimal entry is either after a confirmed hold above 28.00 or on a retest of 27.50–27.20 if a reversal signal forms.
USDCAD: trend reversal confirmed, swing position in playPrice broke the descending trendline and retested it, confirming a structural reversal. After the breakout, USDCAD formed a correction and tested the trendline again, creating a demand zone. Price holds above EMA 50 / EMA 100 and is heading toward EMA 200, which may act as resistance before further continuation. The current move forms a swing structure: correction completed inside Fibonacci 0.382–0.618 (1.3793–1.3972), and buyers continue to defend the trendline. A breakout above 1.4148 opens the path to the resistance zone at 1.4265 (target 1) and 1.4380 (target 2). Tactical plan: look for long entries after confirmation on lower timeframes. Invalidation: breakdown of the trendline and move below 1.3850.
USD remains supported by strong macro data and higher rate expectations from the Fed. CAD is under pressure due to weak oil momentum and a dovish stance from the Bank of Canada. Divergence in monetary policy supports bullish continuation in USDCAD.
The swing remains valid as long as the trendline holds. No need to predict tops. Follow structure, not emotions.

EURNZD: sellers remain in control - upside still rejectedEURNZD confirmed weakness above resistance once again. Breakout attempt failed, price returned below supply and trend line. Every bullish push is absorbed, indicating sellers still dominate. H4 structure stays bearish: failed breakout followed by BOS down, weak buyer on retest.
FVG above and supply zone remain untouched, acting as liquidity cap. Lack of momentum up and return into range support continuation toward 2.0050 and then 1.9750, where previous accumulation and liquidity cluster sit.
Plan: look for shorts on pullback into FVG with weak orderflow, targets 2.0050 and 1.9750. Bullish scenario only above 2.0230 with strong momentum and follow-through — then buy pullback toward 2.0400.
When market teases breakout but every rally dies instantly — trend continuation is still in play. Confirmation first, assumptions later.

EURUSD — Decline from Supply ZoneEURUSD pair, after testing the 1.1780–1.1820 supply zone, shows a clear sellers’ reaction and forms a descending channel. Volume profile confirms bearish pressure, indicating a potential continuation of the downward move. Key downside targets are located at 1.1610, 1.1557, and 1.1200. As long as the price remains below 1.1720, the short bias remains valid.
From the fundamental side, euro weakness is driven by dovish ECB comments and strong U.S. data, while the dollar index holds near local highs. This supports the continuation of the bearish scenario in the coming weeks.
Conclusion: bearish setup remains valid below 1.1720–1.1780, with targets 1.1550–1.1200.

ETHUSDT 1H - Key Liquidity Zones & Bullish Reversal Potential ETHUSDT 1H Analysis: Price is reacting from a critical support zone between the Fib 0.5 - 0.618 retracement and previous day low, both marked as high-liquidity areas. If current support holds, expect a potential bounce targeting the previous day’s high ($4,530.80), with further upside toward the buy side liquidity at $4,748.04. Watch for confirmation in the highlighted demand zone for low-risk long setups. A break below $4,143.60 would invalidate this scenario and shift focus to lower sell side liquidity.”
This chart setup is useful for traders seeking possible long opportunities, with clearly defined risk and upside targets.

XAUUSD - Bullish Reversal Zone Forming Near 3945 | SMCGold (XAUUSD) is showing potential bullish signs after reacting from the previous day’s low at 3945.
Price tapped into the Fibonacci 0.5–0.618 retracement zone, aligning perfectly with demand imbalance on the 15-min timeframe.
Key Insights:
📉 Previous Day Low: 3945 acts as liquidity grab zone
🟨 Fib Confluence: 0.5–0.618 golden pocket
🔄 Expectation: Possible pullback → higher low → push toward 3990–4020
📈 Bullish confirmation above 3980
🚫 Invalid below 3940 (clean break of structure)
This setup aligns with Smart Money Concepts (SMC) — expecting a liquidity sweep + market structure shift before continuation.

Bitcoin key demand zone and movement scenariosOn the 4H BTCUSD chart price is consolidating around 111,000–112,000 under selling pressure. The key demand zone lies between 107,000–105,000 with the next strong support at 100,800. Losing these levels could accelerate bearish momentum. On the upside, a breakout above 115,800 and confirmation above 117,500 would open the path toward 120,000 and potentially higher. Investor interest in Bitcoin remains strong, with institutions continuing to hold positions despite local corrections. The market is closely watching the Federal Reserve’s policy and USD dynamics, both of which directly impact risk assets. In times of uncertainty cryptocurrencies continue to serve as an attractive diversification tool. BTC remains highly volatile, with 105,000 as key support and 117,500–120,000 as resistance. If risk appetite returns, growth scenarios could develop, yet a decline toward 100,000 cannot be ruled out. Risk management and partial entries remain essential.

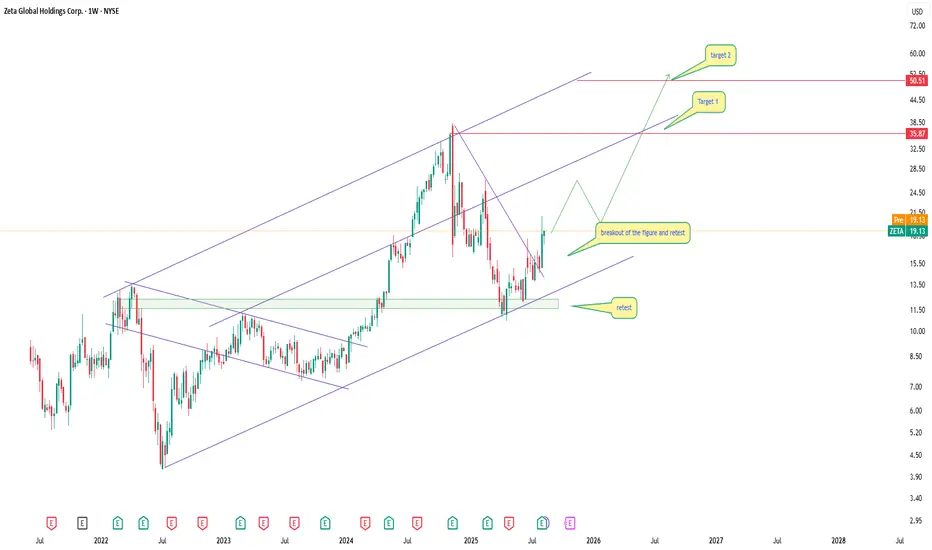
ZETA: when data-driven ads strap on a rocketTechnical analysis:
On the weekly chart, ZETA trades inside an ascending channel. After a deep pullback to the lower channel boundary (14–15$), the price bounced and consolidated above 19$, breaking the descending trendline. The nearest resistance is at 35.87$, and if broken, the next target lies at 50.51$.
EMA and MA on lower timeframes have turned upward, MACD shows a bullish crossover, and volumes are increasing. The upside potential remains strong as long as support at 15–16$ holds.
Tactical plan: buy from current levels and add on a retest of 18–19$, targeting 35.87$ and 50.51$.
Fundamental overview:
Zeta Global is a marketing and data-driven advertising company leveraging AI for targeted campaigns. The business benefits from the global digitalization trend and rising corporate spending on data analytics. Recent earnings showed revenue growth, improved margins, and reduced debt. Rising demand for adtech and institutional interest could further boost the stock.
Conclusion:
If ZETA breaks above 36$, it could jump into a higher price range, turning clients’ ad budgets into rocket fuel.
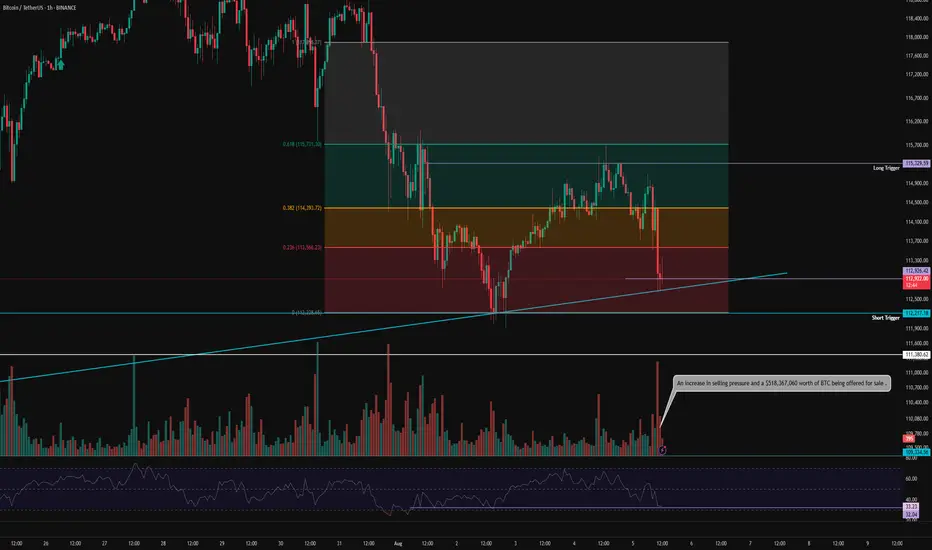
BTC 1H Analysis – Key Triggers Ahead | Day 2💀 Hey , how's it going ? Come over here — Satoshi got something for you !
⏰ We’re analyzing BTC on the 1-hour timeframe .
👀 After the strengthening of the US dollar , Bitcoin experienced a drop and formed a short-term support bottom around the $113,000 level . It is currently completing a pullback to the levels of this recent decline .
🎮 Our Fibonacci retracement is drawn from the breakout zone to the $112,200 bottom . Bitcoin broke below the 0.236 level and then found support . The best potential entry trigger, based on Fibonacci, is at the 0.382 level, or around $115,000 . If Bitcoin breaks above this level , it could form a higher high and a higher low in this timeframe .
⚙️ The RSI is showing a support level around 32 , which is currently preventing Bitcoin from entering the oversold zone . However , if this support is lost , Bitcoin could move into oversold territory .
📈 Our long position trigger is at the 0.382 Fibonacci level . A confirmed breakout of this level , combined with RSI overbuying and increased volume , would be our entry signal .
📉 Our short position trigger is around $113,000 . If this support breaks , we may open a short position . However, the main short trigger is at the 0 Fibonacci level ( support at $112,200 ) . If selling pressure increases and RSI enters the oversold zone , we will consider entering a short position with confirmation .
❤️ Disclaimer : This analysis is purely based on my personal opinion and I only trade if the stated triggers are activated .
$BNT/USDTBNT is showing a strong upward trend and is currently sitting on the 23% Fibonacci level. The targets have been identified based on the Fibonacci retracement. You can either wait for a correction or enter a partial buy at the current level

Taking profit on GE Aerospace stock to buy in lower after summerIt's clear NYSE:GE has hit overbought, it's the perfect time to take profits now. Less stress managing stocks over the summer too lol...
$196 is the 0.618 level I'm aiming to re-enter, there's also decent support near that level $190 to $200

NZDJPY price action trading n a weekly timeframe, the market revisited a previously tested zone. On the 1-hour chart, it broke out of this zone, and on the 15-minute chart, a backtest of the breakout level is currently occurring. Based on this setup, I’m planning to enter a trade.
Trade Plan:
Take Profit (TP): Targeting the last swing high.
Stop Loss (SL): Placing it below the last resistance level.
Risk-Reward Ratio (RR): Aiming for a minimum of 1:3.
This setup offers a high-probability trade with a favorable risk-reward ratio, capitalizing on the breakout and backtest confirmation.


Sklz bull pendant!?5.60 by weds could be Monday if proper momentum
Let's go paradise and skillz holdinglong been here since 2020 and I. Not FKN leaving sklz to moon weekly chart Goals 156usd per share
Where my longs at! Not financial advice

Stellar Textbook touching the golden pocket? If you draw the fibbs we can see that stellar touched the golden pocket recently. Its textbook TA. Where are we going from here?
A deeper correction first? I think so

ADA last chance to get in? Are you allocated into ADA? Why not? It just pumped almost 100% yesterday because of Trumos Twitter Tweet. Imagine what happens when the general public finds out this. Or will it never happen?
Was this your last chance to get in cheap?? We just touched the 78.6 fib... Are we going up?

Bitcoin's Next Big Move? Critical $103K Resistance Ahead!Bitcoin has broken out of its recent consolidation range after a classic liquidity sweep at the lows. As marked on the chart (red line), we saw a significant stop-loss hunt below the previous support level, triggering a cascade of liquidations before BTC swiftly rebounded. This move confirmed bullish intent, allowing Bitcoin to reclaim momentum and push back toward the critical psychological level of $100K.
Now, all eyes are on the $103K resistance zone, which is a major confluence area for multiple reasons:
📌 Fair Value Gap (FVG) – This imbalance in price action suggests that liquidity is resting in this region, making it a key level for market reactions.
📌 Fibonacci Golden Pocket (0.618 - 0.65 retracement) – One of the strongest retracement levels in trading, often acting as a magnet for price action before a decisive move.
📌 Historical Resistance – This area has already been tested twice (marked as "First Hit" and "Second Hit" on the chart) and resulted in strong rejections both times.
What’s Next for Bitcoin?
🔹 Bullish Scenario: If BTC can break through $103K with strong volume, we could see a continuation towards $105K - $107K, with a potential extension toward $110K in the mid-term.
🔹 Bearish Scenario: A rejection from this resistance could lead to another pullback, possibly back to the $96K support level or even lower before another attempt to push higher.
Why This Level Matters:
The liquidity structure here is key. Many traders will have short positions stacked at this resistance, and a breakout could trigger a short squeeze, fueling a rapid move higher. However, if sellers overpower buyers in this zone, BTC could struggle to sustain its gains and might need another accumulation phase before making a decisive breakout.
Final Thoughts
This is a critical moment for Bitcoin. Will the bulls break through $103K and continue the rally, or will this level act as a major roadblock once again? Watch this level closely, and let me know your thoughts in the comments!

$BTC Bounce Back Again $100K Price, New Long Setup see on chartBINANCE:BTCUSDT Bounce Back Again $100K Price, New Long Setup see on chart...
News: Bitcoin Leads US Equity Markets Amid Macro Developments, Yet Stays Resilient: Report
Bitcoin (BTC) is becoming increasingly sensitive to macroeconomic factors. In fact, the digital asset is leading equity markets in the United States in response to President Donald Trump’s latest economic and policy changes.
Over the last four days, President Trump’s announcements havetriggeredincreased uncertainty in global markets, leading to a decline in bitcoin’s price. Bitcoin fell below $100,000 and even touched an intraday low of $91,657 on Monday.
Since bitcoin rallied during President Trump’s inauguration, the cryptocurrency has continued to show a downward trend. BTC formed the double top structure at the $108,000 level and has been trading in a 15% range since mid-November.
Bitfinex analysts said such 15-20% ranges often resolve in either an upward or downward direction within 80-90 days. This means BTC will experience a decisive price move in the coming weeks, still under the influence of macroeconomic developments.
As the financial markets process the implications of the tariff hikes, Bitfinex believes BTCfacesfurther downside unless legacy assets recover. Even if legacy markets do not see significant recovery, analysts are confident in bitcoin’s long-term trajectory, which they have described as compelling.
“In conclusion, while Bitcoinʼs short-term volatility may continue in response to macroeconomic influences, its long-term outlook remains positive,” Bitfinex analysts added.
BINANCE:BTCUSDT LONG SETUP HERE
Entry Price: $96,651.98
Stoploss Zone: $91,206.57
Leverage: 11x use 11% of your margin balance.
This Long Setup 4 Target Price Level here
1 Take Profit: $100,443.31
2 Take Profit: $103,772.29
3 Take Profit: $107,087.34
4 Take Profit: $111,059.81
Disclaimer: This article is for informational purposes only and does not constitute financial advice. Always conduct your own research before making any investment decisions. Digital asset prices are subject to high market risk and price volatility. The value of your investment may go down or up, and you may not get back the amount invested. You are solely responsible for your investment decisions and Binance is not available for any losses you may incur. Past performance is not a reliable predictor of future performance. You should only invest in products you are familiar with and where you understand the risks. You should carefully consider your investment experience, financial situation, investment objectives and risk tolerance and consult an independent financial adviser prior to making any investment.

XRP BULLISH ENTRIES FOR NOOBSHey there gang Degen JAke here if youre an absolute noob at crypto but want to be part of it too because you see all your crypto bros making fantastic gains while youve been to shy to enter, or dont know where? Im predicting these GREAT entry opportunities as you can see marked up by the Green olive horizontal rays.
Price levels:
3.0111
2.9511
2.9011
2.8511
Dont be an absolute nooblet. go ahead and set these buy parameters wait for a good two weeks or so,and enjoy the profits from this analysis.
So easy even a caveman can do it.

AAVE - DeFi leader
As I have stated in my previous analysis AAVE is one of the leaders in DeFi sector, and stays quite underpriced still. Just as I predicted, it reached my target and now I think it will go for .618 Fib. After that in theory there also will be a correction.
But if you look at Solana chart, it has gained a lot of attraction in this cycle and has made a new ATH. I think AAVE will be one of the few Altcoins which have the required potential to make new ATH also. Let's hope and monitor

Potential ETH Breakout 6hr6hr break out arrow with squeeze of volatility shading (thanks Trading Alpha) - but the best part of this set up is combining the @tradingalpha HTF trend with @caretakers jewel which is showing a potentially decent signal here on the 6 hr in the works with all purple, pink and yellow bouncing off of the .382 with positive slope in bullish formation.
On top of this for further confirmation the 1hr has gone bullish with reference to Fibbo Swannys Threshold Theory system with a target just over 3500, closing the 4 hr above here would automatically lead the time frames up into concluding this Jewel signature on the 6hr could play out beautifully.
