IREN eyes on $77.63: Golden Genesis at ATH may give DIP buyIREN got a big surge on deal news with Microsoft
The surge has hit a Golden Genesis fib at $77.63
Look for a Break-n-Retest or Dip-to-Fib like $70.73
Fibonacci

NTAP watch $117.45 above 110.38 below: Dual Goldens for Next LegNTAP in a minor retrace of its recovery wave.
Now between Dual Goldens at $117.45 and 110.38
Looking for a Break-n-Retest of the upper bound.

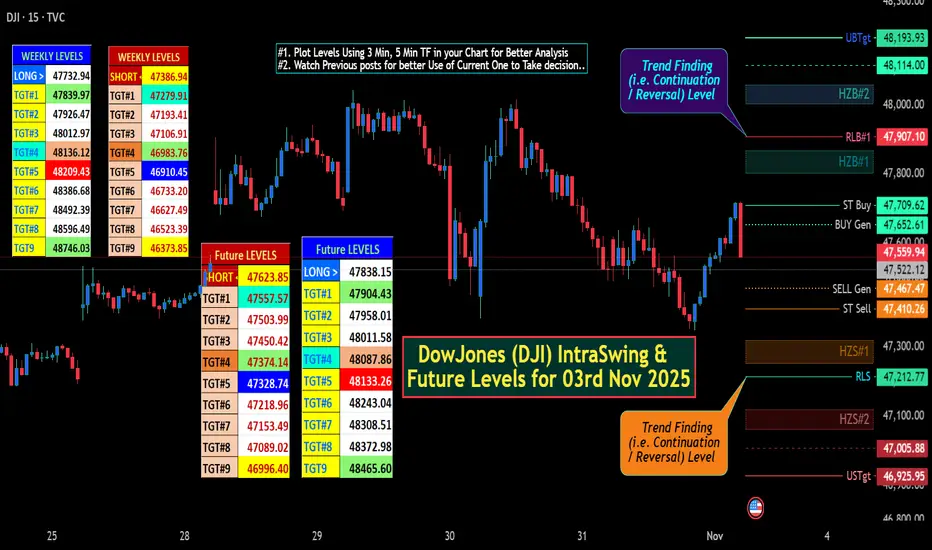
DowJones (DJI) IntraSwing & Future Levels for 03rd Nov 2025✍🏼️ "Future IntraSwing Levels" mentioned in BOX format.
✍🏼️ "WEEKLY Levels" mentioned in BOX format.
L#1: If the candle crossed & stays above the “Buy Gen”, it is treated / considered as Bullish bias.
L#2: Possibility / Probability of REVERSAL near RLB#1 & UBTgt
L#3: If the candle stays above “Sell Gen” but below “Buy Gen”, it is treated / considered as Sidewise. Aggressive Traders can take Long position near “Sell Gen” either retesting or crossed from Below & vice-versa i.e. can take Short position near “Buy Gen” either retesting or crossed downward from Above.
L#4: If the candle crossed & stays below the “Sell Gen”, it is treated / considered a Bearish bias.
L#5: Possibility / Probability of REVERSAL near RLS#1 & USTgt
HZB (Buy side) & HZS (Sell side) => Hurdle Zone,
*** Specialty of “HZB#1, HZB#2 HZS#1 & HZS#2” is Sidewise (behaviour in Nature)
Rest Plotted and Mentioned on Chart
Color code Used:
Green =. Positive bias.
Red =. Negative bias.
RED in Between Green means Trend Finder / Momentum Change
/ CYCLE Change and Vice Versa.
Notice One thing: HOW LEVELS are Working.
Use any Momentum Indicator / Oscillator or as you "USED to" to Take entry.
⚠️ DISCLAIMER:
The information, views, and ideas shared here are purely for educational and informational purposes only. They are not intended as investment advice or a recommendation to buy, sell, or hold any financial instruments. I am not a SEBI-registered financial adviser.
Trading and investing in the stock market involves risk, and you should do your own research and analysis. You are solely responsible for any decisions made based on this research.
"As HARD EARNED MONEY IS YOUR's, So DECISION SHOULD HAVE TO BE YOUR's".
Do comment if Helpful .
In depth Analysis will be added later (If time Permits)
XAUUSD (ONDA) IntraSwing Levels For 03rd -04th Nov(2.30 pm)2025Level Interpretation:
L#1: If the candle crossed & stays above the “Buy Gen”, it is treated / considered as Bullish bias.
L#2: Possibility / Probability of REVERSAL near RLB#1 & UBTgt
L#3: If the candle stays above “Sell Gen” but below “Buy Gen”, it is treated / considered as Sidewise. Aggressive Traders can take Long position near “Sell Gen” either retesting or crossed from Below & vice-versa i.e. can take Short position near “Buy Gen” either retesting or crossed downward from Above.
L#4: If the candle crossed & stays below the “Sell Gen”, it is treated / considered a Bearish bias.
L#5: Possibility / Probability of REVERSAL near RLS#1 & USTgt
HZB (Buy side) & HZS (Sell side) => Hurdle Zone,
*** Specialty of “HZB#1, HZB#2 HZS#1 & HZS#2” is Sidewise (behaviour in Nature)
Rest Plotted and Mentioned on Chart
Color code Used:
Green =. Positive bias.
Red =. Negative bias.
RED in Between Green means Trend Finder / Momentum Change
/ CYCLE Change and Vice Versa.
Notice One thing: HOW LEVELS are Working.
Use any Momentum Indicator / Oscillator or as you "USED to" to Take entry.
⚠️ DISCLAIMER:
The information, views, and ideas shared here are purely for educational and informational purposes only. They are not intended as investment advice or a recommendation to buy, sell, or hold any financial instruments. I am not a SEBI-registered financial adviser.
Trading and investing in the stock market involves risk, and you should do your own research and analysis. You are solely responsible for any decisions made based on this research.
"As HARD EARNED MONEY IS YOUR's, So DECISION SHOULD HAVE TO BE YOUR's".
Do comment if Helpful .
In depth Analysis will be added later (If time Permits)

BANKNIFTY IntraSwing (Spot) & Future Levels for 04th Nov 2025✍🏼️ "Future IntraSwing Levels" mentioned in BOX format.
✍🏼️ "WEEKLY Levels" follow Sunday / Saturday's Post.
L#1: If the candle crossed & stays above the “Buy Gen”, it is treated / considered as Bullish bias.
L#2: Possibility / Probability of REVERSAL near RLB#1 & UBTgt
L#3: If the candle stays above “Sell Gen” but below “Buy Gen”, it is treated / considered as Sidewise. Aggressive Traders can take Long position near “Sell Gen” either retesting or crossed from Below & vice-versa i.e. can take Short position near “Buy Gen” either retesting or crossed downward from Above.
L#4: If the candle crossed & stays below the “Sell Gen”, it is treated / considered a Bearish bias.
L#5: Possibility / Probability of REVERSAL near RLS#1/ RLS#2 & USTgt
HZB (Buy side) & HZS (Sell side) => Hurdle Zone,
*** Specialty of “HZB#1, HZB#2 HZS#1 & HZS#2” is Sidewise (behaviour in Nature)
Rest Plotted and Mentioned on Chart
Color code Used:
Green =. Positive bias.
Red =. Negative bias.
RED in Between Green means Trend Finder / Momentum Change
/ CYCLE Change and Vice Versa.
Notice One thing: HOW LEVELS are Working.
Use any Momentum Indicator / Oscillator or as you "USED to" to Take entry.
⚠️ DISCLAIMER:
The information, views, and ideas shared here are purely for educational and informational purposes only. They are not intended as investment advice or a recommendation to buy, sell, or hold any financial instruments. I am not a SEBI-registered financial adviser.
Trading and investing in the stock market involves risk, and you should do your own research and analysis. You are solely responsible for any decisions made based on this research.
"As HARD EARNED MONEY IS YOUR's, So DECISION SHOULD HAVE TO BE YOUR's".
Do comment if Helpful .
In depth Analysis will be added later (If time Permits)

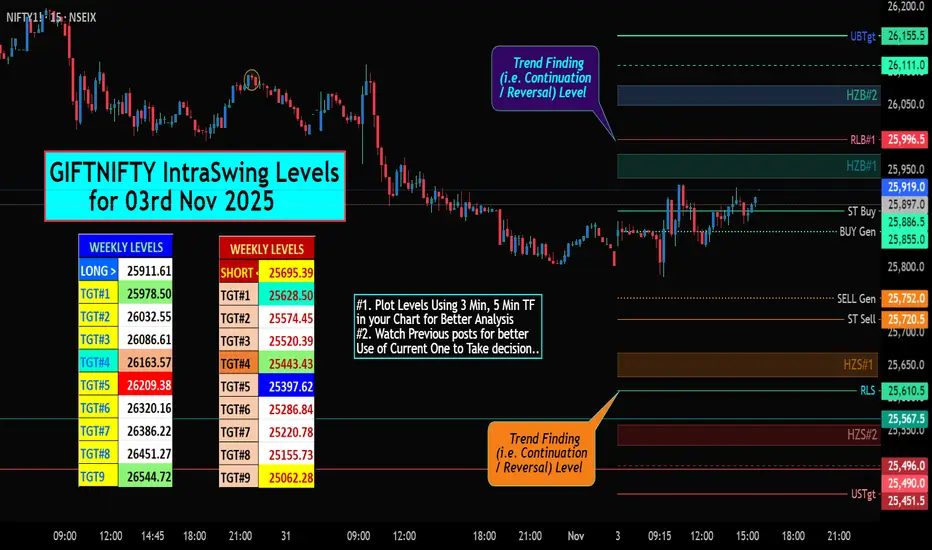
GIFTNIFTY IntraSwing Levels for 03rd Nov 2025✍🏼️ "WEEKLY Levels" mentioned in BOX format.
L#1: If the candle crossed & stays above the “Buy Gen”, it is treated / considered as Bullish bias.
L#2: Possibility / Probability of REVERSAL near RLB#1 & UBTgt
L#3: If the candle stays above “Sell Gen” but below “Buy Gen”, it is treated / considered as Sidewise. Aggressive Traders can take Long position near “Sell Gen” either retesting or crossed from Below & vice-versa i.e. can take Short position near “Buy Gen” either retesting or crossed downward from Above.
L#4: If the candle crossed & stays below the “Sell Gen”, it is treated / considered a Bearish bias.
L#5: Possibility / Probability of REVERSAL near RLS#1 & USTgt
HZB (Buy side) & HZS (Sell side) => Hurdle Zone,
*** Specialty of “HZB#1, HZB#2 HZS#1 & HZS#2” is Sidewise (behaviour in Nature)
Rest Plotted and Mentioned on Chart
Color code Used:
Green =. Positive bias.
Red =. Negative bias.
RED in Between Green means Trend Finder / Momentum Change
/ CYCLE Change and Vice Versa.
Notice One thing: HOW LEVELS are Working.
Use any Momentum Indicator / Oscillator or as you "USED to" to Take entry.
⚠️ DISCLAIMER:
The information, views, and ideas shared here are purely for educational and informational purposes only. They are not intended as investment advice or a recommendation to buy, sell, or hold any financial instruments. I am not a SEBI-registered financial adviser.
Trading and investing in the stock market involves risk, and you should do your own research and analysis. You are solely responsible for any decisions made based on this research.
"As HARD EARNED MONEY IS YOUR's, So DECISION SHOULD HAVE TO BE YOUR's".
Do comment if Helpful .
In depth Analysis will be added later (If time Permits)
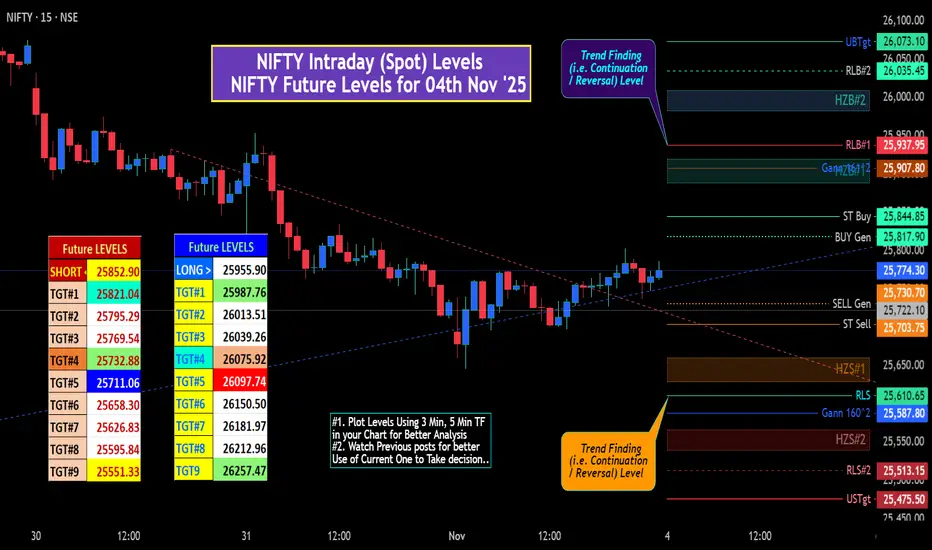
NIFTY IntraSwing (Spot) Future Levels for 04th Nov '25✍🏼️ "Future IntraSwing Levels" mentioned in BOX format.
✍🏼️For "WEEKLY Levels" follow Sunday / Saturday's Post.
L#1: If the candle crossed & stays above the “Buy Gen”, it is treated / considered as Bullish bias.
L#2: Possibility / Probability of REVERSAL near RLB#1 & UBTgt
L#3: If the candle stays above “Sell Gen” but below “Buy Gen”, it is treated / considered as Sidewise. Aggressive Traders can take Long position near “Sell Gen” either retesting or crossed from Below & vice-versa i.e. can take Short position near “Buy Gen” either retesting or crossed downward from Above.
L#4: If the candle crossed & stays below the “Sell Gen”, it is treated / considered a Bearish bias.
L#5: Possibility / Probability of REVERSAL near RLS#1 & USTgt
HZB (Buy side) & HZS (Sell side) => Hurdle Zone,
*** Specialty of “HZB#1, HZB#2 HZS#1 & HZS#2” is Sidewise (behaviour in Nature)
Rest Plotted and Mentioned on Chart
Color code Used:
Green =. Positive bias.
Red =. Negative bias.
RED in Between Green means Trend Finder / Momentum Change
/ CYCLE Change and Vice Versa.
Notice One thing: HOW LEVELS are Working.
Use any Momentum Indicator / Oscillator or as you "USED to" to Take entry.
⚠️ DISCLAIMER:
The information, views, and ideas shared here are purely for educational and informational purposes only. They are not intended as investment advice or a recommendation to buy, sell, or hold any financial instruments. I am not a SEBI-registered financial adviser.
Trading and investing in the stock market involves risk, and you should do your own research and analysis. You are solely responsible for any decisions made based on this research.
"As HARD EARNED MONEY IS YOUR's, So DECISION SHOULD HAVE TO BE YOUR's".
Do comment if Helpful .
In depth Analysis will be added later (If time Permits)
Title: Ethereum (ETH/USD) — Approaching Decision Zone Near $4,00🧭 Idea Summary:
Ethereum is consolidating between $3,600 and $4,200, forming a symmetrical triangle on the daily chart.
The market has shown resilience above the $3,700–$3,800 zone, while repeated rejections from $4,000 indicate a tightening structure before a possible breakout.
📊 Technical Overview:
Trend: Neutral-to-bullish in mid-term
Key Support: $3,600 – $3,725
Key Resistance: $4,200 – $4,275
Indicators:
RSI near 60 — momentum slightly bullish
MACD above signal line — positive bias
Price hovering around 20/50-day MAs
A daily close above $4,000 could confirm a bullish continuation toward $4,250–$4,600, while a breakdown below $3,600 might extend correction to $3,400.
🪙 Fundamentals:
Ethereum ETF outflows and Fed’s cautious stance have capped upside momentum.
Exchange reserves continue to drop (~2% monthly), supporting long-term demand.
Staking yields remain near 4.8%, providing steady network support.
💡 Conclusion:
Ethereum is entering a decision zone.
If bullish volume returns above $4,000, the next rally could target $4,500 in the coming month. Otherwise, watch for a retest of $3,600 support before a stronger move resumes.

1:10RR GOLD BUY SETUP FOR THE WEEKWe are looking for a bullish setup for the week. Price has broke shifted structure to the upside so will be only looking for buys this week. On our chart we have a breaker block which also confluences with our 61.8% Fibonacci. That's where we will be looking to take our trade.
ENTRY:3982
TP:4053
SL:3974

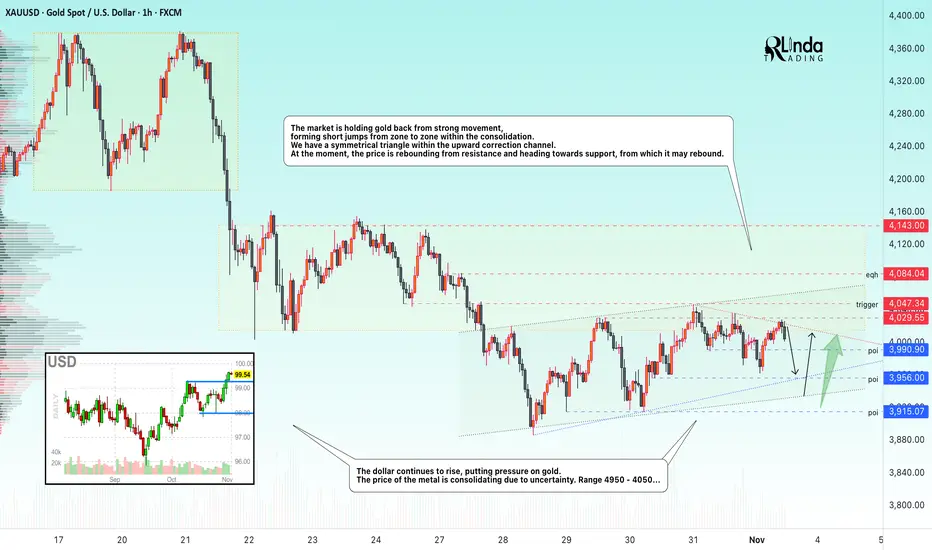
GOLD → Consolidation within a symmetrical triangle The market is holding gold back from strong movement, forming short jumps from zone to zone within consolidation. We have a symmetrical triangle within an upward correction channel.
Key supporting factors:
The US shutdown is becoming the longest in history, increasing economic risks.
China is canceling tax breaks for retailers. Trump may announce new tariffs related to China.
ISM Manufacturing PMI data (US) is ahead - a rare indicator during the shutdown.
The probability of a Fed rate cut in December has fallen to 69% (from 91.7% a week ago).
Technically, consolidation may continue until the price breaks one of the boundaries of the symmetrical triangle.
Support levels: 3990, 3956, 3915
Resistance levels: 4030, 4047, 4085
Traders are uncertain about the future direction, and as a result, the market is consolidating. There are limit levels both below and above that are holding back movement. Accordingly, until there is a clear fundamental background, it is possible to focus on trading within the channel. I expect a rebound from 3960 for a retest of resistance. However, a close above 4030 could trigger growth, while a close below 3956 would confirm the weakness of the market and trigger a fall to 3900.
Best regards, R. Linda!
S&P to inflect at the Fib extension about now? Will the SP500 inflect at the fib extension of 1.618 of the prior dip down?
This is an important price level to watch to see if the index is bullish or bearish
My view is that its going to be a bearish outcome, however the market is being a bit naughty at the moment and it may push you over this price level to take out liquidity first before heading lower.
There are very few bears left out there - will they come out of hibernation right about now?

3 Cases for EURUSD EURUSD continues to fall. I see three possible scenarios for what it might do next.
The first case is that a wedge forms near the current level.
The second case is another leg down to test 1.15.
The third case is the formation of a trend channel, using the parallel of the downward yellow trendline, which would imply a decline toward 1.14.
I do not have a strong opinion on which scenario will play out, so I will play the statistics game and enter a long position here with a favorable risk–reward ratio but a modest take-profit target. I will keep my stop loss above 1.15, enter the trade with half position size, and then see waht the market will do.

XAGUSD - Silver BUY CAPITALCOM:SILVER
Previously, Silver had a huge selloff, but on October 28, price on Daily timeframe tapped into 50 EMA, created a doji candle and failed to make LL to support continuing sell bias
Price on 1H, 4H, and Daily timeframe are all trading above EMA50
4H making HH-HL and recently broke above major resistance at 48.6, where bearish momentum appeared to sit at.
After breaking above said resistance, price came up and created a HH, then came down to retest the same resistance thats now reacting as support.
While doing so, price came down and tapped into the 50% Fib area, which was also where the previous HH was at, and price then created a strong bullish candle on 4H rejecting that same level.
Scaling down to 1H we can see the 1H candle that closed above a minor pullback LH structure and is also where the 4H closed at. I consider that 1H candle my entry and targeting either -62% Fib or another major resistance at 52.338 .

EURGBP → Breaking through resistance provokes distribution FX:EURGBP is updating its high as part of a rally triggered by a breakout of consolidation resistance amid a bullish trend
The currency pair is in a phase of a confident uptrend (D1), with consolidation forming in the form of a bullish pattern, which generally indicates the strength of the buyer.
After breaking through the resistance of the “ascending triangle” consolidation, the currency pair is updating its high to 0.8818 and forming a double top, which is provoking a correction. Before rising, the price may test support.
Resistance levels: 0.8786, 0.8818
Support levels: 0.8752, 0.8721
The correction may bring the price to the break-even zone (breakout area). Liquidity capture will shift the imbalance towards buyers, which may trigger a continuation of the upward movement.
Best regards, R. Linda!

Short Potential: EURUSD, 1H.Short/Sell potential on 1H timeframe. Do your own analysis before took someone's else.

LINKUSDT → A trap? Grabbing liquidity before the fall...BINANCE:LINKUSDT is forming a correction after a bearish run. A false breakdown of support is triggering a correction before a possible continuation of the decline.
The coin is testing the support of the trading range within the downtrend. The reaction to the false breakdown of support is a pullback to the zone of interest. After a strong downward distribution, a correction to the break-even zone is forming. A false breakout of resistance at 17.45 could trigger a continuation of the decline due to a weak market and a liquidity pool formed above 17.450, which is likely to stop the pullback on the bearish trend.
Resistance levels: 17.450
Support levels: 16.53, 15.77
The downtrend may continue. A retest of resistance may end in a fall and an update of the local minimum, as well as reaching the zone of interest at 15.77.
Best regards, R. Linda!

EURNZD: sellers remain in control - upside still rejectedEURNZD confirmed weakness above resistance once again. Breakout attempt failed, price returned below supply and trend line. Every bullish push is absorbed, indicating sellers still dominate. H4 structure stays bearish: failed breakout followed by BOS down, weak buyer on retest.
FVG above and supply zone remain untouched, acting as liquidity cap. Lack of momentum up and return into range support continuation toward 2.0050 and then 1.9750, where previous accumulation and liquidity cluster sit.
Plan: look for shorts on pullback into FVG with weak orderflow, targets 2.0050 and 1.9750. Bullish scenario only above 2.0230 with strong momentum and follow-through — then buy pullback toward 2.0400.
When market teases breakout but every rally dies instantly — trend continuation is still in play. Confirmation first, assumptions later.

Gold compression before expansionGold remains in a controlled accumulation phase after a strong move, holding rising lows and respecting the fair value zone near 3990. As long as buyers defend the 3985–4000 range, the setup favors a false dip and re-entry scenario with continuation higher. A clean break and hold above 4040 unlocks the first target at 4110, and extension toward 4200 remains valid on structural expansion and Fibo alignment. The market is balanced on a hinge: levels are defined, buyers present, but confirmation lies only in price reclaiming the breakout zone.
Fundamentally gold still tracks macro uncertainty. Rates, inflation expectations, dollar hesitation and US debt dynamics keep capital rotating defensively. This is one of those periods where expectations and reality diverge, and the longer the compression holds, the stronger the eventual move. Still, discipline first — price must confirm above 4040.
Bias remains bullish while above 3985. Break below opens a corrective path toward 3920–3890 before another attempt higher.

Gold -Alternative TradeMy preferred entry level didn’t materialize yet may not, so it’s time to create an alternative tactic.
Main idea is to trade pennant pattern breakout. The take-profit target remains the same, but both the entry and stop levels are lower, reducing the risk-reward ratio from 3.98 to 2.85. This setup carries higher risk.
I will trade whichever pending order will be hit first and cancel the other one.
Original idea:

GBPJPY | Accumulation in Demand Zone – Targeting Buy Side LiquidGBPJPY is holding strong above the demand zone (201.90–202.20), showing potential signs of smart money accumulation before a liquidity grab to the upside. Price is now approaching an intraday supply area where liquidity is stacked above equal highs.
Trade Outlook:
Demand Zone: 201.90–202.20
Short-term Target: 202.91 (Buy-side liquidity)
Extended Target: 203.16
Bias: Bullish while above 202.00
Setup: Wait for a BOS + retracement entry from discount zone
⚙️ Concepts: Smart Money | Liquidity Grab | Demand Zone Reaction | Market Structure Shift

AUDUSD | Smart Money Building Long Positions From Demand ZoneAUDUSD is showing early signs of strength after reacting perfectly from the higher-timeframe demand zone (0.6530–0.6550). Price is consolidating near intraday support, suggesting possible accumulation before a liquidity sweep to the upside.
Trade Outlook:
Demand Zone: 0.6530–0.6550 (retest area)
Liquidity Target 1: 0.6596
Liquidity Target 2: 0.6615
Bias: Bullish unless price breaks below 0.6530
Possible Play: Look for BOS + retrace entry confirmation inside demand

GOLD (XAUUSD) | Key Reaction Zone Ahead – 0.5–0.618 FIB Gold is trading near a critical retracement zone (0.5–0.618 FIB) with price consolidating below the previous day’s high ($4046).
Smart money may look to induce liquidity above $4031, then reverse to target the previous day low ($3972) if rejection confirms.
Trade Idea:
Watch Zone: $4006–$4031 (reaction / rejection area)
Bearish Scenario: Liquidity grab above $4031 → Break of structure → Sell continuation
Bullish Scenario: Strong close above $4046 → Next liquidity target $4065+
Bias: Neutral-to-bearish unless $4046 is broken with volume
Key Levels:
Resistance: $4046 (PDH zone)
Support: $3972 (PDL)
