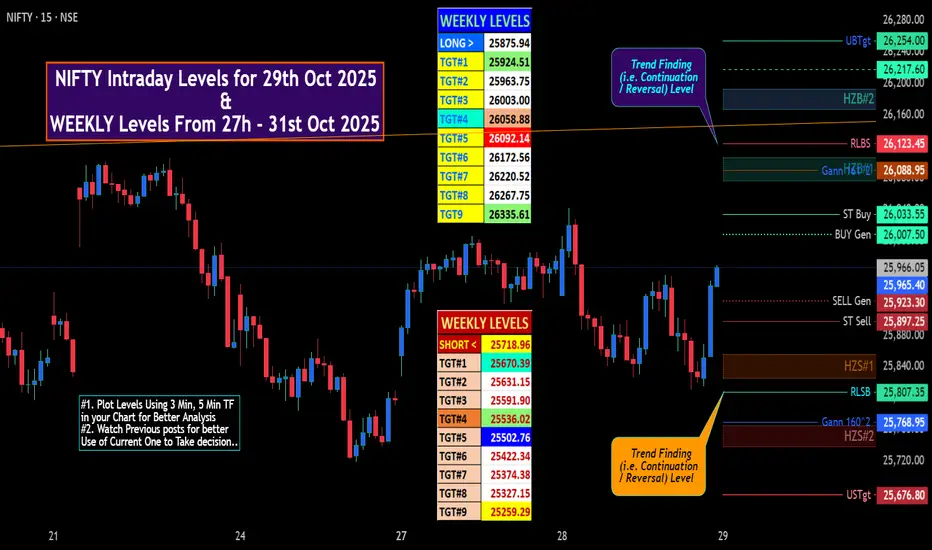
NIFTY IntraSwing Levels for 29th Oct 2025🚀 "WEEKLY Levels" mentioned in BOX format.
🌡️Plot Levels Using 3 Min, 5 Min Time frame in your Chart for Better Analysis
L#1: If the candle crossed & stays above the “Buy Gen”, it is treated / considered as Bullish bias.
L#2: Possibility / Probability of REVERSAL near RLBS & UBTgt
L#3: If the candle stays above “Sell Gen” but below “Buy Gen”, it is treated / considered as Sidewise. Aggressive Traders can take Long position near “Sell Gen” either retesting or crossed from Below & vice-versa i.e. can take Short position near “Buy Gen” either retesting or crossed downward from Above.
L#4: If the candle crossed & stays below the “Sell Gen”, it is treated / considered a Bearish bias.
L#5: Possibility / Probability of REVERSAL near RLSB & USTgt
HZB (Buy side) & HZS (Sell side) => Hurdle Zone,
*** Specialty of “HZB#1, HZB#2 HZS#1 & HZS#2” is Sidewise (behaviour in Nature)
Rest Plotted and Mentioned on Chart
Color code Used:
Green =. Positive bias.
Red =. Negative bias.
RED in Between Green means Trend Finder / Momentum Change
/ CYCLE Change and Vice Versa.
Notice One thing: HOW LEVELS are Working.
Use any Momentum Indicator / Oscillator or as you "USED to" to Take entry.
⚠️ DISCLAIMER:
The information, views, and ideas shared here are purely for educational and informational purposes only. They are not intended as investment advice or a recommendation to buy, sell, or hold any financial instruments. I am not a SEBI-registered financial adviser.
Trading and investing in the stock market involves risk, and you should do your own research and analysis. You are solely responsible for any decisions made based on this research.
"As HARD EARNED MONEY IS YOUR's, So DECISION SHOULD HAVE TO BE YOUR's".
Do comment if Helpful .
In depth Analysis will be added later (If time Permits)
Fibonacci
EURJPY - Looking To Sell Pullbacks In The Short TermH1 - Strong bearish move.
Bearish convergence.
No opposite signs.
Expecting bearish continuation after pullback until the strong resistance zone holds.
If you enjoy this idea, don’t forget to LIKE 👍, FOLLOW ✅, SHARE 🙌, and COMMENT ✍! Drop your thoughts and charts below to keep the discussion going. Your support helps keep this content free and reach more people! 🚀

Xau/usdXau/usd long term idea if the political situation is like this
dont forget capital management
dont forget the SL

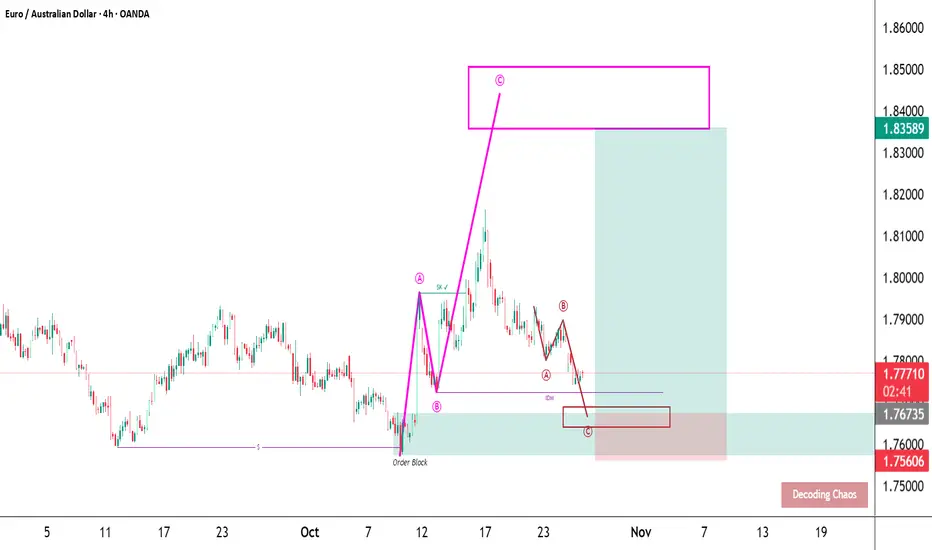
EURAUD – structure breathes in waves.Price retraces toward a clean order block within a discount zone after a strong impulsive leg. Correction is forming a precise ABC pattern, likely to complete near 1.767 before the next wave resumes toward 1.835.
Strengths:
Wave symmetry, confluence with order block, and IDM liquidity structure all align. Setup maintains bullish context from higher timeframe while defining risk clearly below C.
Weaknesses:
Momentum confirmation pending; daily RSI could signal exhaustion if recovery stalls. EUR fundamentals remain sensitive to data shocks that can distort technical structure.
SmellyTaz — decoding chaos.
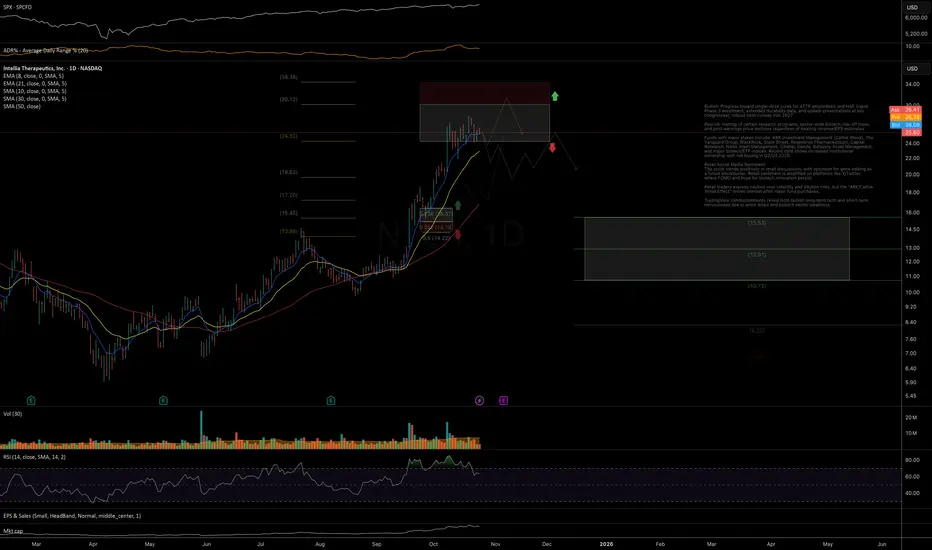
NTLA: reached key resistance zonePrice has followed through strongly from the mid-term support outlined in the September update, moving directly into the target mid-term resistance zone.
As long as the price remains below 30, I expect a near-term pullback below the 21dEMA to complete the first leg of decline.
If, however, the price breaks out above the October highs, it would open the door for further extensions toward the 31–34 resistance zone in the short term.
Chart:
Previously:
On bullish trend structure and support zone (Sep 26):
Chart:
www.tradingview.com
On resistance zone and pullback potential (Oct 8 and Oct 13):
Chart:
See weekly review:
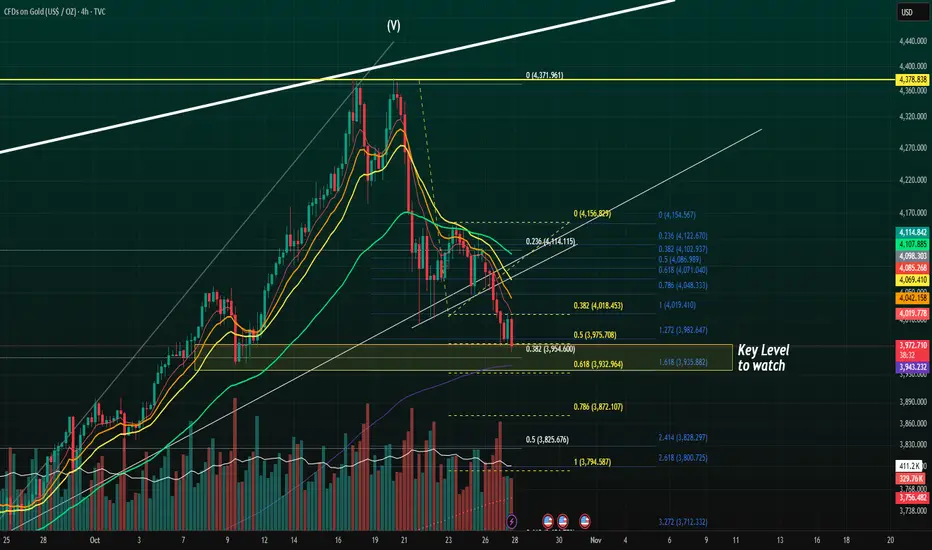
Three Tech Factors alignedGold Futures:
The Alignment for the three Fibonacci Key Zone , 100 days SMMA approaching, and previous major support.
Is this our key level for the first corrective up wave?
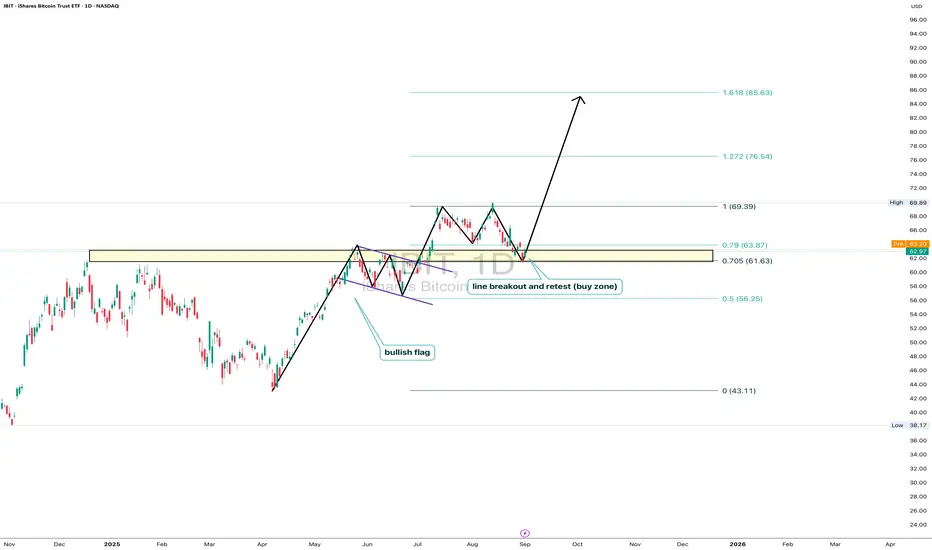
IBIT: ready for liftoffOn the daily chart, iShares Bitcoin Trust (IBIT) trades at $62.97, testing the key 0.705–0.79 Fibo zone ($61.63–63.87). This area marks a breakout and retest line, forming a clear buy zone. The technical structure remains bullish: after breaking out and pulling back, price holds potential to move toward $69.39, with Fibo extensions targeting $76.54 and $85.63. Volumes confirm buyer activity on dips, and the bullish flag pattern supports the continuation of the upward trend.
Fundamentally , the main driver is bitcoin itself, with institutional demand for BTC ETFs staying strong. Large funds continue accumulating positions, while expectations of a softer Fed tone add pressure on the dollar, fueling capital inflows into crypto. This strengthens the bullish case for IBIT.
Tactical plan: watch $61.6–63.8 as the key entry zone. Holding above opens the path toward $69.3, followed by $76.5 and $85.6. The scenario breaks only if price falls below $61.
And let’s be honest: IBIT isn’t just a ticker - it’s the “accelerate bitcoin” button for your portfolio.
WULF | More Room To Run Higher | LONGTeraWulf, Inc. owns and operates fully integrated environmentally clean bitcoin mining facilities in the United States. TeraWulf will generate domestically produced bitcoin powered by nuclear, hydro and solar energy. The company was founded by Paul Prager and Nazar Khan on February 8, 2021 and is headquartered in Easton, MD.

WULF | This Crypto Miner will POP | LONGTeraWulf, Inc. owns and operates fully integrated environmentally clean bitcoin mining facilities in the United States. TeraWulf will generate domestically produced bitcoin powered by nuclear, hydro and solar energy. The company was founded by Paul Prager and Nazar Khan on February 8, 2021 and is headquartered in Easton, MD.

GOLD ANALYSIS (1 W)To understand the psychology in Gold,
I use only two tools:
Fibonacci retracement,
Trend-based Fibonacci extension.
We will use these two tools to measure the weekly cycles.
Since November 2022, Gold has been forming a pattern that can only be explained by Fibonacci principles.
Using Fibonacci retracement for each swing high and low, you'll realize that each retracement equals around 50%.
In only one example, we see that a higher low reaches the 61.8% level, which is also acceptable.
After these retracements, the next leg of the impulsive move always reaches around the 1.618 Fibonacci extension.
According to these two basic technical factors, Gold should first reach around $3,800, and then aim for the $6,600 level during the next impulsive leg in the coming years.
I’m not even going to list all the reasons why Gold tends to go up over time.
Most people reading this analysis are already aware of the fundamentals behind Gold’s long-term bullish nature.
Thanks for reading.

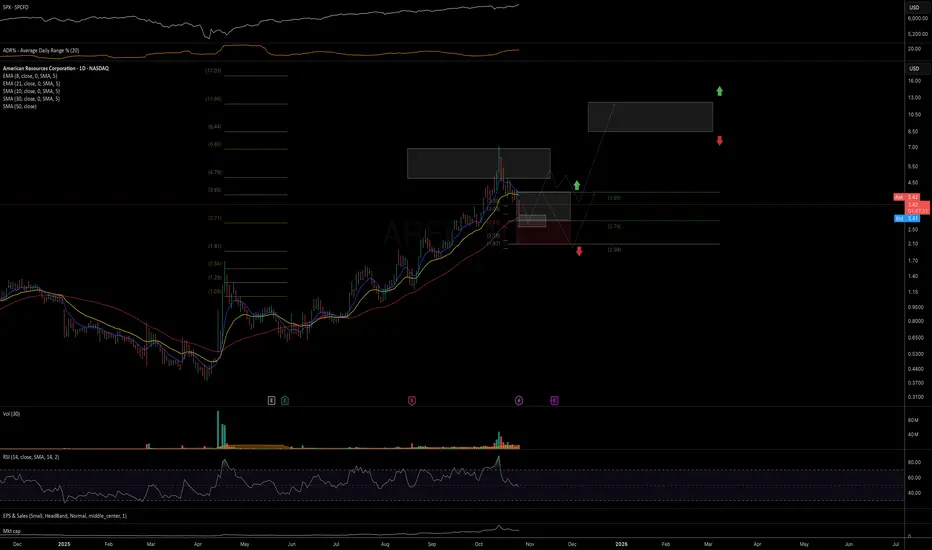
AREC potential trend structurePrice is showing a constructive mid-term trend structure, with price now testing a key support zone around 3.0–2.7–2.6. This area could serve as a potential higher low base for the next leg up toward the 8.5–12.0 resistance range.
As long as price continues to close above 2.57, I’ll be holding this trend structure with higher resistance targets in focus over the coming months.
Chart:
USD/CAD Holding Support as Bulls Face Fed / BoC Rate Decisions USD/CAD is trading just above support early in the week with the Bank of Canada on tap Wednesday.
Initial support rests with the 2022 high at 1.3978 with the 200-day moving average converging on pitchfork support just lower at 1.3957- losses would need to be limited to this slope IF price is heading higher on this stretch.
Initial resistance is eyed with the 38.2% retracement of the yearly range at 1.4019 with a close above the monthly high-day close (HDC) at 1.4045 needed to mark resumption of the July uptrend. Subsequent resistance objective eyed at 1.41 and the 50% retracement / November high at 1.4166/78.
A break below this formation would threaten a decline back towards the October open at 1.3920 with critical support seen at the 2022 high close / 2023 high at 1.3881/99.
Keep in mind the Bank of Canada & Fed interest rate decisions are on tap Wednesday- stay nimble into the release and watch the weekly / monthly close on Friday for guidance here.
-MB

$NDX Reaches 161.8% Fib ExtensionNASDAQ:NDX has again reached the 161.8% Fib Extension in its latest move of this Bull Market. The last time this occurred was July 10th, 2024. A key difference this time is that SP:SPX is not concurrently reaching the same extension, and is instead lagging in pace.

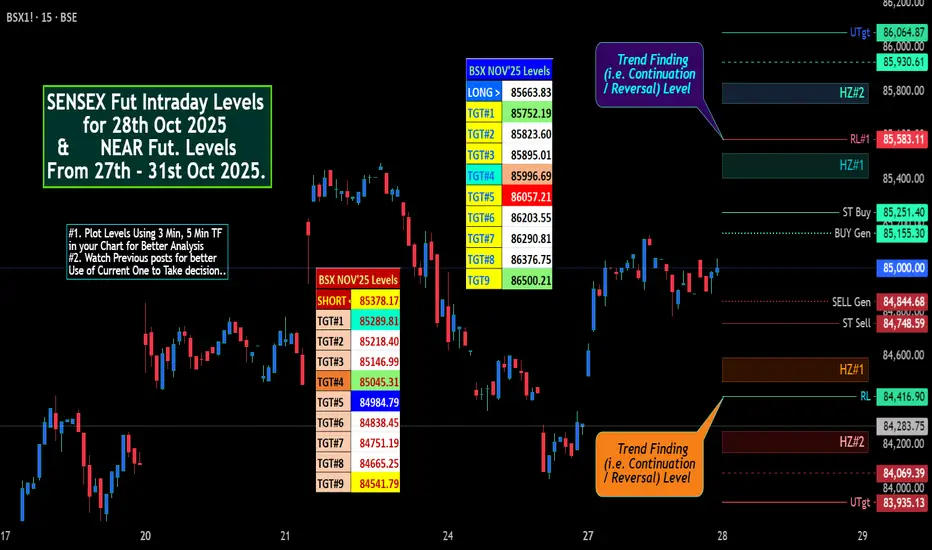
SENSEX Future IntraSwing Levels for 28th Oct 2025Due to Data DELAY Change Publishing of "SENSEX Level" to "BSX (SENSEX Future) Levels"
🚀 "NEAR Future Levels" mentioned in BOX format.
🌡️Plot Levels Using 3 Min, 5 Min Time frame in your Chart for Better Analysis
L#1: If the candle crossed & stays above the “Buy Gen”, it is treated / considered as Bullish bias.
L#2: Possibility / Probability of REVERSAL near RLB#1 & UBTgt
L#3: If the candle stays above “Sell Gen” but below “Buy Gen”, it is treated / considered as Sidewise. Aggressive Traders can take Long position near “Sell Gen” either retesting or crossed from Below & vice-versa i.e. can take Short position near “Buy Gen” either retesting or crossed downward from Above.
L#4: If the candle crossed & stays below the “Sell Gen”, it is treated / considered a Bearish bias.
L#5: Possibility / Probability of REVERSAL near RLS#1 & USTgt
HZB (Buy side) & HZS (Sell side) => Hurdle Zone,
*** Specialty of “HZB#1, HZB#2 HZS#1 & HZS#2” is Sidewise (behaviour in Nature)
Rest Plotted and Mentioned on Chart
Color code Used:
Green =. Positive bias.
Red =. Negative bias.
RED in Between Green means Trend Finder / Momentum Change
/ CYCLE Change and Vice Versa.
Notice One thing: HOW LEVELS are Working.
Use any Momentum Indicator / Oscillator or as you "USED to" to Take entry.
⚠️ DISCLAIMER:
The information, views, and ideas shared here are purely for educational and informational purposes only. They are not intended as investment advice or a recommendation to buy, sell, or hold any financial instruments. I am not a SEBI-registered financial adviser.
Trading and investing in the stock market involves risk, and you should do your own research and analysis. You are solely responsible for any decisions made based on this research.
"As HARD EARNED MONEY IS YOUR's, So DECISION SHOULD HAVE TO BE YOUR's".
Do comment if Helpful .
In depth Analysis will be added later (If time Permits)
MRVL - RSI Back Above 50, Eyes Fibonacci Targets at 99 and 112MRVL - CURRENT PRICE : 86.00 - 88.00
MRVL is showing early signs of bullish continuation after finding support near the 50-day EMA and rebounding with positive momentum. The price structure remains healthy as it trades above the EMA 50, suggesting the medium-term trend is still intact.
Key Technical Highlights :
1) Price Above EMA 50
The stock price is holding above the EMA 50, showing that the uptrend remains valid and buyers are still in control.
2) RSI Above 50 and Not Overbought
RSI has crossed back above the 50 level, confirming improving momentum while staying below overbought territory, leaving more room for upside.
3) MACD Structure
Although the MACD line is still below the signal line, both are positioned above the zero level, indicating the overall market tone remains positive with potential for a new bullish crossover.
Based on Fibonacci extension, potential upside targets are at :
1st Target: USD 99.00 (0.618 level)
2nd Target: USD 112.00 (1.000 level)
ENTRY PRICE : 86.00 - 89.00
FIRST TARGET : 99.00
SECOND TARGET : 112.00
SUPPORT : 80.50

Is Nasdaq Set for a Pullback? | Fibonacci Resistance Zone ahead!In this video I map out the idea of the Nasdaq being over extended and on route to approaching a key Fibonacci resistance level 27000 ,
This may set up a potential correction in the week ahead."
This is a counter-trend setup within a larger uptrend, so risk management is key. I'm not calling a top to the entire rally, but rather a healthy pullback to bring in new buyers."
I demonstrate how i see the price action moving forward over the course of the month ahead with valuable insights.
Tools used in this video Standard Fib , Fib Expansion, Fib extension + Anchored vwap and Volume profile and TPO chart

Can Bitcoin Give Us Some Money?It will be interesting to see what king BINANCE:BTCUSDT will do from here after the bounce off the support level.
Zoom in on the chart, let me know what you see, and share your trade idea with me in the comment box.
If you agree with my idea, feel free to open a position on the spot market. If you prefer a futures position, ensure that you manage your risk. Set SL and TP, and don't forget to manage your trade.
Follow me for more crypto market analysis and trade updates.

Gold Pullback or Reversal? Key Zone Ahead!As I expected , Gold ( OANDA:XAUUSD ) started to drop thanks to the Double Top Pattern and reached its target at the Support zone($4,011 – $3,981) .
Now, do you think Gold will start dropping again, or will it resume its recent weeks’ uptrend?
Today, I’m going to do a short-term 15-minute analysis of Gold , so stay tuned.
At the moment, Gold is approaching a Resistance zone($4,192 – $4,137) —also a Potential Reversal Zone (PRZ) —and moving within an ascending channel . Overall, the recent moves in Gold over the past couple of days look like a pullback to the previous Support zone($4,192 – $4,137) .
From an Elliott Wave perspective , it seems that Gold , given the momentum of its recent drop, is completing corrective waves, and we should expect another decline .
I expect Gold to start dropping again from the Resistance zone($4,192 – $4,137) and PRZ , and AFTER breaking the lower line of the ascending channel , it could fall at least down to around $4,039(First Target) .
Second Target: Support zone($4,011 – $3,981)
Stop Loss(SL): $4,222
Please respect each other's ideas and express them politely if you agree or disagree.
Gold Analyze (XAUUSD), 15-minute time frame.
Be sure to follow the updated ideas.
Do not forget to put a Stop loss for your positions (For every position you want to open).
Please follow your strategy; this is just my idea, and I will gladly see your ideas in this post.
Please do not forget the ✅ ' like ' ✅ button 🙏😊 & Share it with your friends; thanks, and Trade safe.

Long Term Gold Indicators Turning BearishSome of the long term indicators I check give me warning about 15%-20% correction possibility. With US - China deal done, I'm start to turn more bearish. If 4045 broken, the chances of 4000 support fail may not be low as I first thought. So I plan for a short entry from 4113 with 3.98 RR. For safer entry, 4045 break could be used, of course with shorter stop level, If 4113 won't be reached, I plan to post another short position version here.

CIEN heads up at $138-140: Major Resistance should give a DIP CIEN has been flying high especially after earnings.
It has just hit a major resistance zone $138.17-140.08
Looking for a Dip-to-Fib from here to look for longs again.
.
Previous Analysis that caught the $72 BOTTOM:
Hit BOOST and FOLLOW for more such PRECISE and TIMELY charts.
=========================================================
.

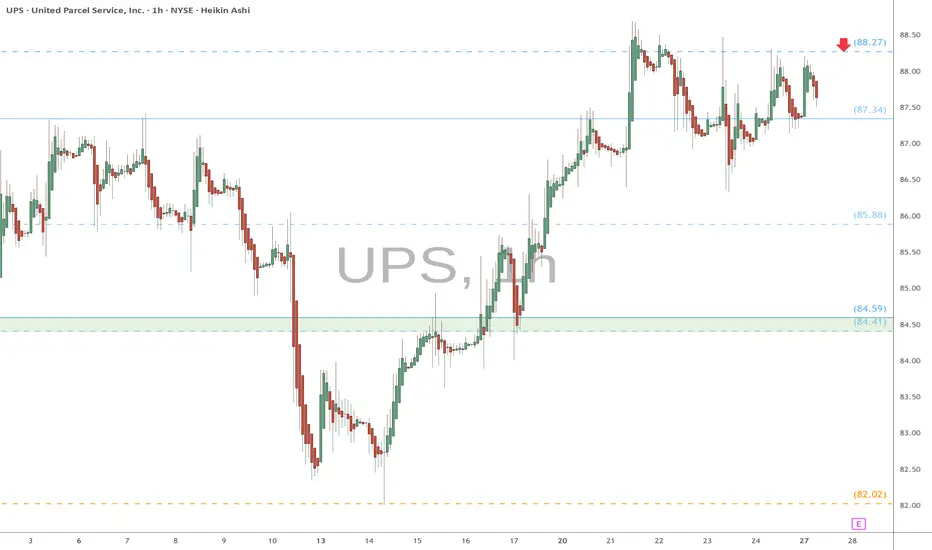
UPS eyes on $88.27: Major fib break may call BOTTOM for this dogUPS trying to paint a bottom after huge losses.
Repeatedly banding against a Covid fib at %88.27
Clearly a battle line that will determine the trend.
.
See "Related Publications" for previous plots of this loser attempting redemption.
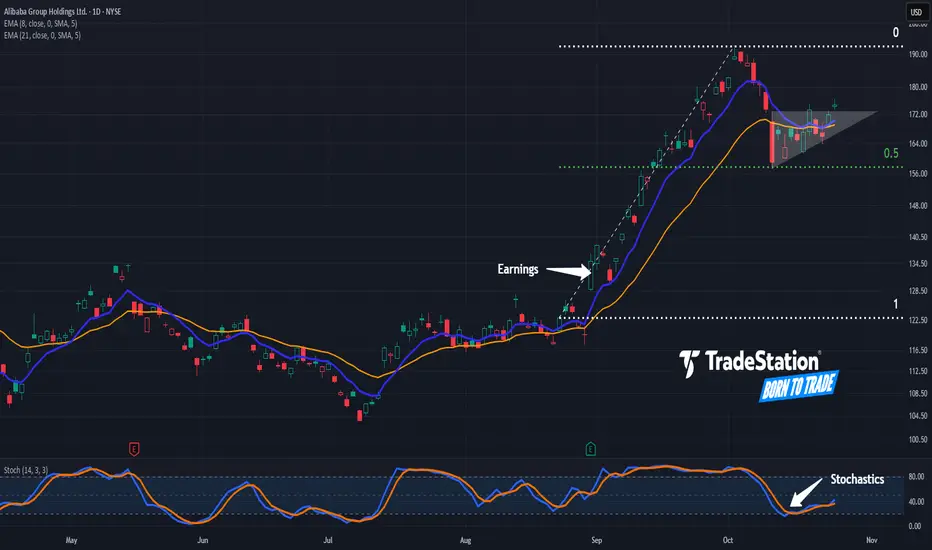
Potential Continuation Patterns in AlibabaAlibaba rallied in September. Now, after a pullback, some traders may see potential for continuation.
The first pattern on today’s chart is the advance between August 22 and October 2. The Chinese e-commerce giant stabilized after retracing half the move, which may suggest its direction remains upward.
Second, you have the series of higher lows since October 10 with prices mostly trapped below $173. That ascending triangle may be viewed as a bullish continuation pattern.
Third, the 8-day exponential moving average (EMA) has remained above the 21-day EMA.
Next, stochastics are rebounding from an oversold condition.
Finally, BABA is an active underlier in the options market. That could help traders take positions with calls and puts.
TradeStation has, for decades, advanced the trading industry, providing access to stocks, options and futures. If you're born to trade, we could be for you. See our Overview for more.
Past performance, whether actual or indicated by historical tests of strategies, is no guarantee of future performance or success. There is a possibility that you may sustain a loss equal to or greater than your entire investment regardless of which asset class you trade (equities, options or futures); therefore, you should not invest or risk money that you cannot afford to lose. Online trading is not suitable for all investors. View the document titled Characteristics and Risks of Standardized Options at www.TradeStation.com . Before trading any asset class, customers must read the relevant risk disclosure statements on www.TradeStation.com . System access and trade placement and execution may be delayed or fail due to market volatility and volume, quote delays, system and software errors, Internet traffic, outages and other factors.
Securities and futures trading is offered to self-directed customers by TradeStation Securities, Inc., a broker-dealer registered with the Securities and Exchange Commission and a futures commission merchant licensed with the Commodity Futures Trading Commission). TradeStation Securities is a member of the Financial Industry Regulatory Authority, the National Futures Association, and a number of exchanges.
Options trading is not suitable for all investors. Your TradeStation Securities’ account application to trade options will be considered and approved or disapproved based on all relevant factors, including your trading experience. See www.TradeStation.com . Visit www.TradeStation.com for full details on the costs and fees associated with options.
Margin trading involves risks, and it is important that you fully understand those risks before trading on margin. The Margin Disclosure Statement outlines many of those risks, including that you can lose more funds than you deposit in your margin account; your brokerage firm can force the sale of securities in your account; your brokerage firm can sell your securities without contacting you; and you are not entitled to an extension of time on a margin call. Review the Margin Disclosure Statement at www.TradeStation.com .
TradeStation Securities, Inc. and TradeStation Technologies, Inc. are each wholly owned subsidiaries of TradeStation Group, Inc., both operating, and providing products and services, under the TradeStation brand and trademark. When applying for, or purchasing, accounts, subscriptions, products and services, it is important that you know which company you will be dealing with. Visit www.TradeStation.com for further important information explaining what this means.
SLB watch $36.63/67: Tight Double Fib holding top of the RangeSLB has been stuck in a range defined by fib zones.
Top bound is a tight Double Fib at $36.63 and 36.67
Looking for a Break-n-Retest to catch breakout entry.
