XAUUSD Possible Short XAUUSD Possible short setup .Enter short only when the low of the current 1 h candle is broken and on candle close
Good LUck
Fibonacci

MU heads up at $410: Major Resistance zone may cause DIP finallyMU and all memory stocks have been flying high.
We just hit a major resistance at $407.48-410.78
Look for a Dip-to-Fib or Break-n-Retest for longs.
.
See "Related Publications" for previous alerts such as this PERFECT BOTTOM CALL:
Hit BOOST and FOLLOW for more such PRECISE and TIMELY charts.
========================================================
.

CI eyes on $265.25: Golden Genesis fib to mark the BOTTOM?CI and all insurance stocks have been struggling for a while.
This one just broke through a proven Golden Genesis at $265.25
Look for a clean Retest to mark the bottom to buy for long term.
.
See "Related Publications" for other examples of Golden fibs in action ------>>>>>>

BBW watch $48.93: Golden Genesis asks "can Bulls luv Bears?"BBW blow off top back to earth.
Launchpad Golden Genesis at $48.93
Fib to answer: Can bulls luv bears again?
.
See "Related Publications" for other examples of Golden fibs at work ------->>>>>>>>>>>

CADJPY 4HRCADJPY has been in an uptrend. From what I can see, there is a retracement rejecting from the 0.705 fib level.
A bullish candle closure above the previous bearish candle can give up potential buy side move targeting the highs around 114.700 level.

Gold Sell IdeaGold retesting the resistance area and i think we have an opportunity here to take a sell.
Manage your own risk!
Target is clear
Sl above previous high
Good Luck

GLD to 320Seems obvious man. It's way up there. Let it come down a bit.
320 is also ~4500 on XAUUSD.

Technical Analysis: BTC Fibonacci Support Confluence & Trade Set1. Fibonacci Analysis:
the significance of the 0.5 (50%) and 0.618 (61.8%) Fibonacci retracement levels derived from the prior major swing. These are two of the most critical confluence zones in technical analysis, where institutional and algorithmic buy-side liquidity is often clustered .
2. Price Action Interpretation:
The fact that the price has respected these levels and initiated a bounce indicates strong underlying demand . The current test of this Fibonacci support cluster is a classic bullish consolidation pattern within a larger uptrend. A firm rejection from this zone would confirm the strength of the trend and signal that the correction is likely complete.
3. Market Expectation:
We anticipate that this Fibonacci support confluence will hold strong, serving as a launchpad for the next impulsive wave. A successful hold here increases the probability of a resumption of the uptrend , targeting a break above the recent high and extension toward new cycle highs.
4. Trade Signal & Risk Management:
Direction: Long
Trigger: A bullish rejection candle (e.g., hammer, bullish engulfing) on the 4H or daily chart at the 0.5–0.618 Fib zone, accompanied by rising volume.
Stop-Loss (SL): Placed just below the 0.78 Fib level (e.g., below $88600) to invalidate the thesis on a breakdown.
Take-Profit (TP): Set at a 1:2 Risk-Reward (R:R) ratio. The first TP target would be the prior swing high, with the final TP projected for a measured move toward new highs.
Risk : Position size must be calculated so that the potential loss from the SL is within your strict maximum risk-per-trade parameters (e.g., 1-2% of portfolio ).
Summary:
The confluence of two major Fibonacci retracements provides a high-probability, low-risk area for a long entry. The setup offers a favorable asymmetric risk-reward profile (1:2 R:R). Execution depends on a confirmed bullish reaction at the defined support zone.
😊DISCLAIMER: ((trade based on your own decision))👽

WAVES Technical Outlook
📊 Technical View – WAVES
Price is at an important horizontal support, showing a rebound attempt. The same zone is also supported by a rising trendline and aligns with the Fibonacci Golden Zone, creating a strong confluence area 🔁✨
🔹 Trade Idea
Entry: CMP 13.37
Stop Loss: 12.60 🛑
🎯 Upside Targets
14.30
14.85
15.38
16.00 (Breakout Zone) 🚀
The trend will maintain a bullish bias as long as the price holds above the support zone 📈.
A volume expansion breakout can accelerate upside momentum.
⚠️ Strict SL discipline is essential.

Big Dropping coming in the Gold. The long-term Fibonacci extension leg looks exhausted. I smell a big drop in gold from here.

GOLD - Pullback before growth after Asian momentum FX:XAUUSD is correcting after hitting a historic high ($4,900), due to the de-escalation of tensions between the US and the EU. Profit-taking is observed, but the trend remains bullish...
Fundamental background:
- Trump has cooled down: tariffs are temporarily suspended, as is the forceful seizure of Greenland. Negotiations are likely to continue. The market reacted quite aggressively to yesterday's “swings” led by Trump.
Today, data on PCE inflation and US GDP for the third quarter will be released, which may provide new momentum.
Further dynamics will depend on inflation data: weak indicators may renew interest in defensive assets, while strong ones may increase pressure.
Resistance levels: 4838, 4850, 4880
Support levels: 4813, 4800, 4777
Technically, after the Asian momentum, gold may form a correction of 50% of the total movement. I consider the 4813-4800 area (liquidity area) to be a zone of interest. And as zones of interest at the top, I consider the 4850 area — the liquidity pool.
Best regards, R. Linda!

GOLD – AB=CD Bullish Setup | High-Probability Long Opportunity#GOLD is currently trading inside a strong buying zone, and the 1D timeframe is forming a clear AB = CD harmonic pattern.
The AB leg has fully completed, and the CD leg is now in progress, indicating a potential continuation toward the completion zone.
Why This Setup Matters
AB=CD harmonic pattern shows a strong bullish continuation structure
Price is holding within a perfect buying range
No bearish signals on the higher timeframe
Higher-timeframe trend supports long positions
Trading Plan
I will look for long entries at CMP, targeting the completion of the CD leg, with strict risk management to maintain discipline and protect capital.
Strategy Focus
This analysis is based on harmonic pattern confluence and market structure alignment.
If #GOLD continues to respect the current buying range, we may see a bullish move toward the pattern completion level.
Share your thoughts below. Are you expecting continuation or a reversal on #GOLD?
Like, comment, and follow for more advanced setups and daily analysis.
#GoldAnalysis #HarmonicPatterns #ABCDPattern #XAUUSD #GoldTrading #PriceAction #TechnicalAnalysis #TradingView #ForexTrader #SmartMoneyConcepts #TrendTrading #BuyTheDip

NQ Power Range Report with FIB Ext - 1/23/2026 SessionCME_MINI:NQH2026
- PR High: 25629.25
- PR Low: 25575.50
- NZ Spread: 120.25
Key scheduled economic events:
09:45 | S&P Global Services PMI
- S&P Global Manufacturing PMI
Session Open Stats (As of 12:45 AM)
- Session Open ATR: 358.84
- Volume: 24K
- Open Int: 256K
- Trend Grade: Long
- From BA ATH: -2.6% (Rounded)
Key Levels (Rounded - Think of these as ranges)
- Long: 26521
- Mid: 25264
- Short: 24008
Keep in mind this is not speculation or a prediction. Only a report of the Power Range with Fib extensions for target hunting. Do your DD! You determine your risk tolerance. You are fully capable of making your own decisions.
BA: Back Adjusted
BuZ/BeZ: Bull Zone / Bear Zone
NZ: Neutral Zone

MRNA: The Moment We Have Been Waiting ForNASDAQ:MRNA has been on a strong run lately. The stock has pushed up into the low 40s after spending a lot of time stuck in the 20s and 30s, and it is now trading near a new one‑year high with price riding above the main moving averages. This move comes after the company raised its 2025 revenue forecast and gave more clarity on 2026, saying it expects growth as new products like its flu and combo flu‑COVID shots move toward approvals. On top of that, Moderna continues to highlight a growing pipeline in vaccines and cancer, which gives investors more than just COVID to focus on. All of this has pulled in fresh buyers and led to a sharp 10–15% rally in just a few weeks.
Because of this news, the outlook for Moderna is more bullish than it has been in a while. The company now has better revenue visibility for the next few years, with management guiding to higher 2025 sales and talking about the path to profitability as the pipeline matures. Instead of one big COVID story, they now have multiple different products: seasonal flu, combo vaccines, RSV revaccination and several oncology readouts in 2026. The balance sheet also looks solid, with billions in cash that can support ongoing R&D. When you put this together with the recent price breakout and strong buying volume, it supports the idea that the market is starting to re‑rate the stock higher.
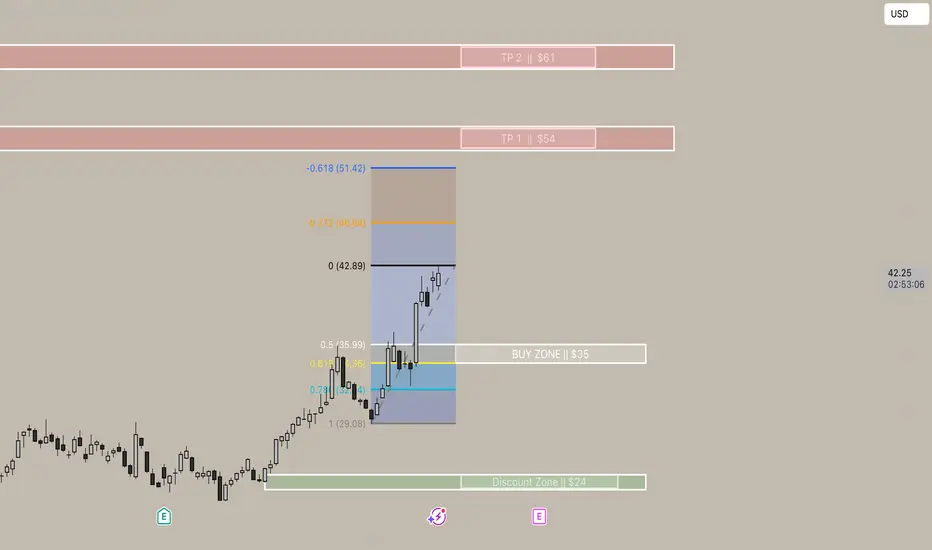
On the chart, my approach is pretty simple: I trade the trend and use Fibonacci retracements to find my levels. After Moderna bottomed out in late 2025, it started printing higher lows and higher highs on the daily chart; the most recent push gave me a clear impulse leg from the last swing low up to the current high around 42–43, which I marked as a new higher high. From there, I pulled a Fib from that swing low to the swing high. I focus on the 0.5–0.618 “golden zone,” because in a healthy uptrend that is where price often pulls back before continuing higher. On this move, that zone lines up around 35, so I’ve marked that area as my main buy zone. It also matches the recent breakout area where old resistance could turn into support, which adds confidence to that level.
Above current price, my first target (TP1) is around 54. That level comes from a Fib extension of the current leg and also lines up with an old supply area where price stalled before. It’s a logical place for short‑term traders to take profit if the trend continues. My second target (TP2) is up near 61, which is a higher extension as well as a major shelf from the last big downtrend. If price can reach that zone, it would still be far below the pandemic highs but would mark a strong medium‑term recovery. Finally, I have a deeper “discount zone” around 24. This area matches a larger retracement of the entire move and sits close to the recent 52‑week low where buyers stepped in before the current rally. If price ever came back there while the fundamental story stayed intact, I’d see it as a high‑value area rather than a reason to give up on the bullish idea.
So in short, I'm bullish. Fundamentals and guidance are improving, the pipeline is getting closer to real commercial products, and the chart has flipped into an uptrend. My plan is to avoid chasing at the highs, wait for a pullback into the 35 buy zone that lines up with my Fib retracement, and then look to ride the move toward 54 and possibly 61 as long as the uptrend structure holds.
Note: This is my personal opinion and analysis, not financial advice. Always do your own research and due diligence before entering any trade. Happy trading everyone!
Alternative Wave Count From Post Earlier This WeekI had a post earlier this week and this is a different wave count I'm open to. I'm kinda 50/50 on which count it is. Either way I expect a move up from here. For this scenario I'm looking at 1.618 (0.786) as the target. Then a finally wave down to 69000 area. Let me know what you guys think and which scenario you favour.

EUR/USD: The Fiscal Dominance Breakout (Einstein Vector)Title: The "Einstein Vector" Protocol: Why the Dollar is Dying at 4.3% Yields
Author: Brian Armbruster, Principal Trader, Armbruster Capital
Date: January 22, 2026
Abstract:
While the mainstream financial media (Reuters, Bloomberg) focused on the "TACO" (Trump Always Chickens Out) narrative regarding Greenland tariffs, the structural reality of the market told a darker story. Using proprietary Fun-Tech Einstein Vector Analysis, Armbruster Capital correctly forecasted the EUR/USD gap open with 98.3% precision (1.7 pip variance) and identified the "Fiscal Dominance" divergence before institutional desks.
The Core Thesis: The global financial system has entered a new phase of "Interpretive Asymmetry."
The Old Rule: Strong GDP (4.4%) + High Yields (4.25%) = Strong Dollar.
The Einstein Reality: Strong GDP + High Yields + Record Gold ($4,900) = Sovereign Debt Rejection.
Key Vectors Identified (Sunday - Thursday):
The "Tokyo Walkout" (Liquidity Void): We identified that Asian central banks had ceased purchasing US Treasuries, creating a "Liquidity Void" that forced the Fed to act as the buyer of last resort. This explains why the Dollar fell despite US 10-Year Yields spiking to 4.3%.
The "Greenland" Distraction (The Magician's Hand): We correctly identified the "Greenland Tariff" threat as a geopolitical negotiation tactic (noise), not a trade policy (signal). The subsequent "walk-back" was predicted as a liquidity injection event, not a trend change.
The "Gold Signal" (The Truth): While equities celebrated the "TACO" relief rally, Gold hitting $4,900/oz confirmed that "Smart Money" is fleeing the Dollar system entirely. The correlation between Yields and the Dollar has inverted.
Conclusion:
The market is no longer trading on price; it is trading on Time and Solvency. The "Relief Rally" is a trap. The structural move is a devaluation of the US Dollar to manage the $38 Trillion debt load. EUR/USD targeting 1.1850+ is not speculation; it is mathematical necessity.

Xauusd topped?This count is based on my assumptions so anything can happen not a trading or financial advice just for educational purposes only kindly do your own ta thanks trade with care good luck.

Nikkei 225 Wave Analysis – 22 January 2026 - Nikkei 225 reversed from pivotal support level 52000.00
- Likely to rise to resistance level 54750.00
Nikkei 225 index recently reversed from the support zone between the pivotal support level 52000.00 (former resistance from October), 20-day moving average and the support trendline from April of 2024.
This support zone was further strengthened by the 38.2% Fibonacci correction of the upward impulse 3 from December.
Given the sharp daily uptrend, Nikkei 225 can be expected to rise to the next resistance level 54750.00 (which stopped earlier impulse wave 3).

Starbucks Wave Analysis – 22 January 2026- Starbucks reversed from resistance zone
- Likely to fall to support level 92.50
Starbucks recently reversed down from the resistance zone between the strong resistance level 96.60 (former strong resistance from July and also support from March of 2025).
The resistance level 96.60 was strengthened by the upper daily Bollinger Band and by the 50% Fibonacci correction of the downward impulse from February.
Given the strength of the resistance level 96.60, Starbucks can be expected to fall to the next support level 92.50 (former resistance from August).

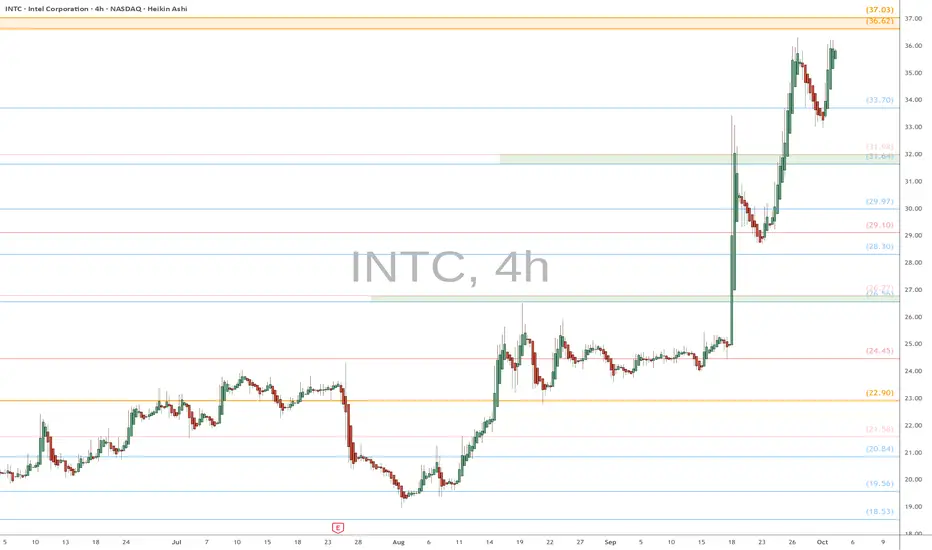
INTC heads up into $37: Double Golden zone likely to GRAB itINTC keeps getting "good" news after good news.
Now approaching a Double Golden Zone at $36.62-37.03
This should be a "Sticky" level stalling the wave for a bit.
.
Previous Analysis about another Goldden Genesis that caught the BOTTOM:
Hit BOOST and FOLLOW for more such PRECISE and TIMELY charts.
=========================================================
.
ROOT: double-top short / shortable bounce set-up Stock's fundamentals, price relative strength, and group action look strong.
But the uptrend structure may have formed a mid-term top.
Weekly:
Downside potential remains as long as the price stays below the May 8th highs.
Ideal macro support zone: 90–70.
Daily:
Thank you for your attention and I wish you successful trading decisions!

$PGEN: decent upside potential NASDAQ:PGEN continues to act well from the mid-term support zone highlighted in the September and October updates.
I’ll be viewing any potential pullbacks toward the rising EMA as possible buying opportunities, with the next target resistance zone near 8.
Chart:
Previously:
On support (Oct 8): weekly review —
Chart:
On bullish structure (Sep 15): www.tradingview.com
Chart:

KBE watch $54.xx: Dual Fib zone needs to hold OR "Top is In"KBE correcting from a possible Double Top.
Now testing a major support at $54.12-54.88
Loss of this zone will point towards "Top is In"
.
Previous Analysiis that caught a PERFECT BOTTOM:
Hit BOOST and FOLLOW for more such PRECISE and TIMELY charts.
========================================================
.
