HIMX | Launch This Semiconductor | LONGHimax Technologies, Inc. is a semiconductor solution provider dedicated to display imaging processing technologies. It operates through the Driver Integrated Circuit and Non-Driver Products segments. The company's products include display drivers, timing controllers, wafer level optics, video and display technology solutions, liquid crystal over silicon silicon, complementary metal-oxide semiconductor image sensor, and power integrated circuit. Its products used in TVs, laptops, monitors, mobile phones, tablets, digital cameras, car navigation, virtual reality (VR) devices and many other consumer electronics devices. Himax Technologies was founded by Biing Seng Wu and Jordan Wu on June 12, 2001 and is headquartered in Tainan, Taiwan.
Fibonacci

ORCA - possible 11xOrca has historically reacted to the 1.34 - 1.36 zone (which is also the 618)
ATH = 19.00
A breakout of the downtrend (white line could be bullish for p.a.)
Barriers / resistance points @ 5 and 8. Orca would need to break above these levels in order to reach the ATH.
Assuming ATH as TP this is 1,120% uplift fron currently position.

Fib's extensionIf so, then this thing won't stop until it reaches the purple level. That's where the correction could really begin. I'm not ready to say when yet, because the angle of attack could be either gradual or exponential, depending on the economy and the political situation.

Wulf exhausted?NASDAQ:WULF appears exhausted at the upper channel boundary and I have exited completely for now. The Elliot wave pattern completes a leading diagonal which hints at higher to go after a wave 2 pullback which could end at the 0.382 Fibonacci retracement but more a likely target is the 0.5 Fib at $5.84 also the weekly 200EMA.
Breaking out above the channel would change the count and structure and be very bullish. RSI has been overbought for a while. For now we watch and wait.
Safe trading

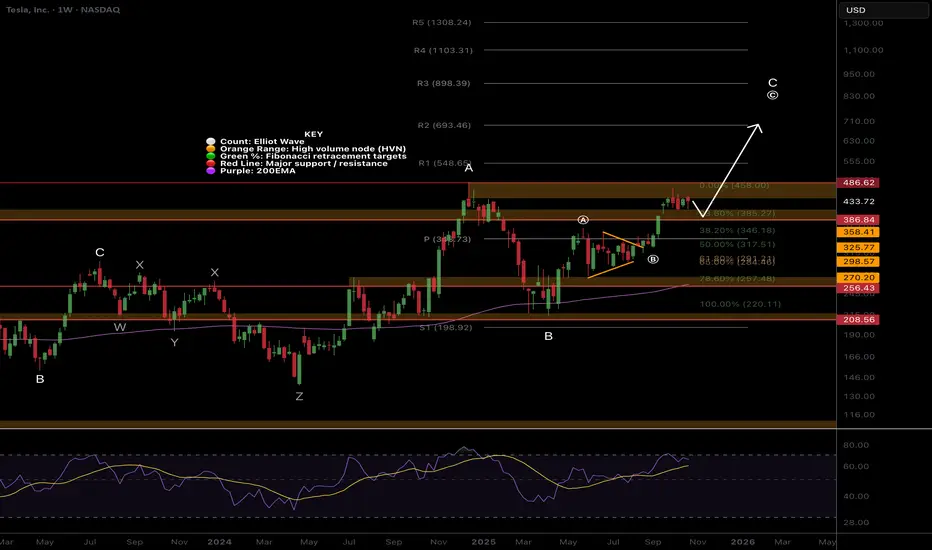
$TSLA higher to go!Price continues towards price discovery finding resistance at the previous all time High Volume Node. Price is above the weekly pivot and 200EMA which is bullish and has momentum.
Wave © of C appears to be underway into price discovery with a target of $693 the R2 weekly pivot. This is because it has been printing a series of 3 wave structures. Wave B printed a triangle which is a pattern found before a terminal move reinforcing the Elliot wave count.
RSI is not yet overbought.
Safe trading
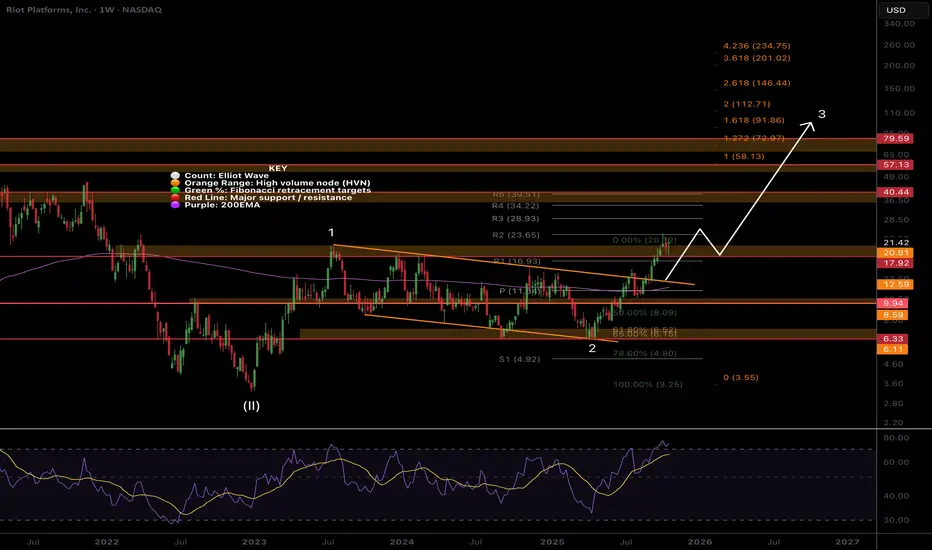
RIOT upwards momentum well in tactNASDAQ:RIOT Price remains in momentum breaking out of the channel in a wave 3 with a minimum target of the 1.618 Fibonacci extension at $91, a 4x from here.
Wav 2 completed at triple support- Fibonacci golden pocket, High Volume Node and channel boundary before quickly overcoming the weekly pivot and 200EMA. Breaking out above wave 1 is a show of strength,
Price should stall at the High Volume Nodes as supply comes in, $21, $40 and $57 but ultimately they should be overcome.
Weekly RSI is overbought where it can stay for months as price extends.
Higher Bitcoin = Higher targets
Safe trading
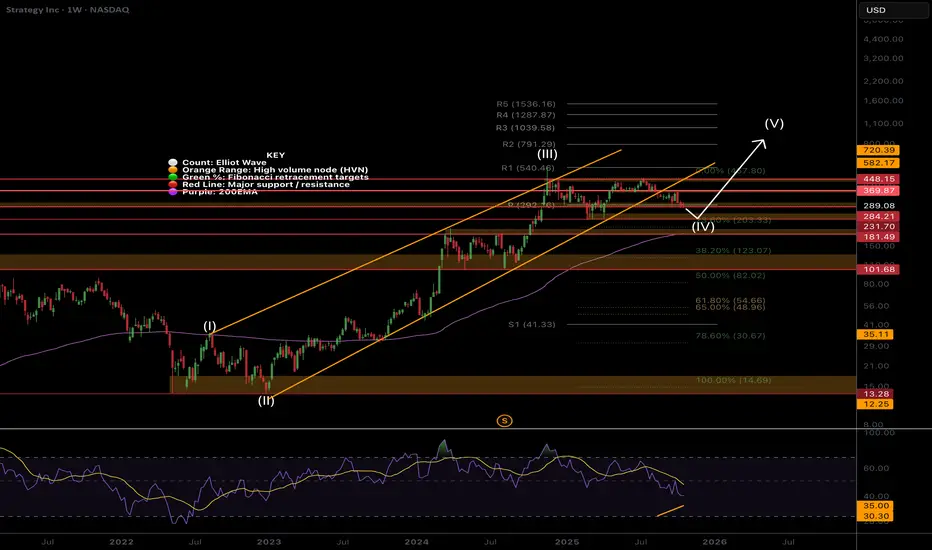
MSTR still in wave 4 rangeNASDAQ:MSTR Price is still in a wave (IV) which are expected to be long and drawn out, yet shallow which is what we have here. I don’t expect wave (V) to kick in until Bitcoin moves. Wave (V) has an expected of the R3 daily pivot at $1039 but will overextend if Bitcoin does.
Price has fallen out of the lower channel boundary and sitting at the weekly pivot, still above the weekly 200EMA so the outlook us bullish. wave (4) may complete at the 0.236 Fibonacci retracement at $203. For now I am waiting to see what happens before entering but believe good opportunities are setting up.
Safe trading
IREN Exhausted? PUllback time?IREN wave (3) ran incredibly and I am looking for a deeper pullback as people begin to take profit. I have closed my positions at a 10x and am waiting for re-entry. The weekly pivots have been ran, RSI is at max overbought but can remain here for months (as it has done).
Initial downside targets for wave (4) is the 0.236 Fib retracement at $39 followed by the 0.382, $26.43. Expect shorts to pile in adding to any downside momentum.
In the long term I believe we have much higher to go towards $100 in wave (5).
Safe trading

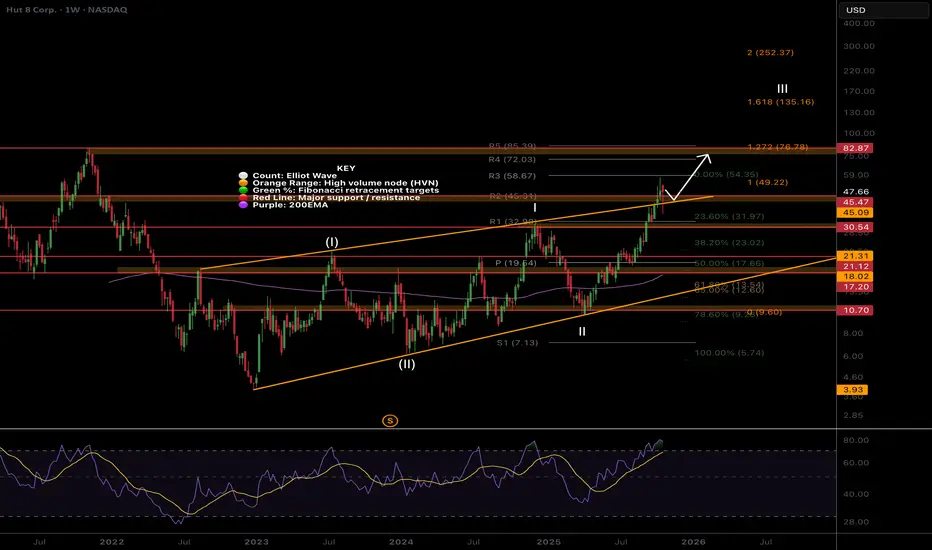
$HUT Breaking out, test of channel done and dusted!Hut has broken out of the channel upper boundary and a test of the boundary took place as expected, quickly catching a bid and recovering 17% Friday, producing a long signal for me.
The next target is the High Volume Node resistance at $82 just under the R5 weekly pivot. Fibonacci extension has a minimum target of the 1.618, $135.
The Elliot wave count suggests a very bullish move come in wave III of (III) which would overextend the 1.618 target above, $200+.
RSI is overbought but can remain here for months.
Safe trading
GOLD → Retest 4060 within the range. What are the expectations?FX:XAUUSD is forming a correction from the Asian session, with the price testing the important 4060 zone ahead of two key events: US inflation data (CPI) and the results of US-China trade negotiations.
Key factors: US inflation (CPI): Low data will support gold (expectations of two cuts in 2024), but high figures will strengthen the USD and weaken gold (rates for a rate cut in December will decline).
Progress in negotiations between China and the US could weaken gold, while failure would bring back demand for safe havens. US sanctions against Russian oil are supporting oil prices and inflation expectations.
Gold is in wait-and-see mode. Growth is likely with weak CPI or a failure of negotiations. Strong CPI and progress in trade will reinforce the correction. The mood remains cautious ahead of events.
Resistance levels: 4090, 4150, 4163
Support levels: 4060, 4002
The important zone of 4060 - gold is forming a false breakdown. If the bulls hold their defense above this zone, it could trigger growth towards the resistance of the range. Otherwise, we can expect a retest of 4000K, and the reaction should be aggressive...
Best regards, R. Linda!

BITCOIN → Trend support broken. Consolidation...BINANCE:BTCUSDT.P is consolidating below the previously broken uptrend line. There are no clear signs of the correction ending or the presence of a strong bullish player. A retest of resistance is forming...
Bitcoin is forming a trading range of 111650 - 107377 (106270). There is no clear bullish pattern at the moment, and we are seeing a correction to resistance before a possible decline to the liquidity pool of 106270, which is formed by consolidation and a retest phase. There are two key zones ahead: 111650 and 113600. Resistance at 111650 has been confirmed, but if this zone does not hold the price, it will be necessary to monitor the upper boundary. A false breakout could trigger a pullback. The cryptocurrency market currently looks somewhat weak due to the phase of uncertainty and doubts about policy.
Resistance levels: 111650, 113600
Support levels: 108650, 107375, 106270
Market behavior indicates that a consolidation phase is currently developing within the local downtrend. A breakout of 113K and consolidation above 113500 could confirm a trend reversal, but there are no such signals at the moment. I consider a pullback to the zone of interest from resistance to be a priority.
Best regards, R. Linda!

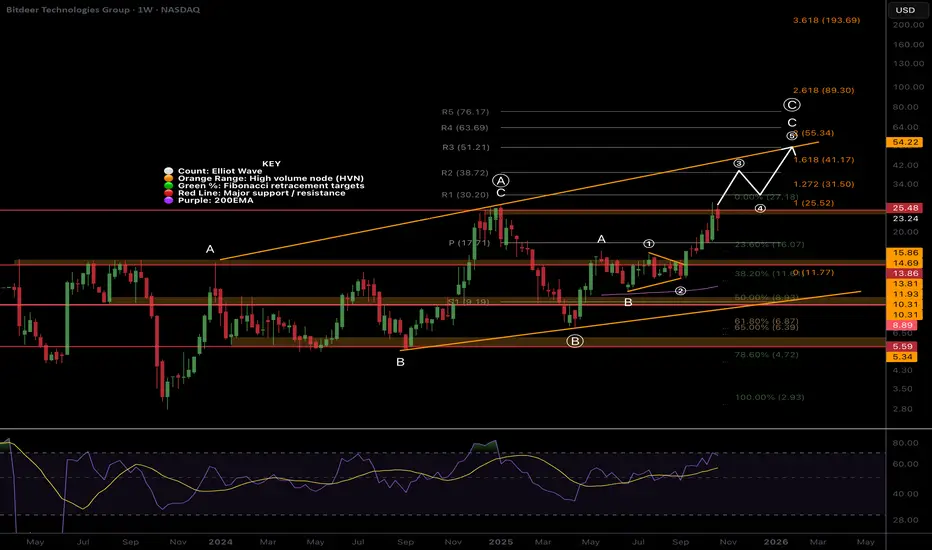
Bitdeer BTDR Macro Outlook. Nothing changed, Min 2x to come $54NASDAQ:BTDR is a low-cap volatile asset so traders and investors should expect wild pullbacks like we are seeing and is feature of these type of assets and is why we can make so much money from them when using the right strategy.
The macro structure is bullish in an Elliot wave ABC as there are many series of 3 wave structures.
Wave (3) of C of (C) is underway with a minimum target of the 1.618 Fibonacci extension $41.17 but price can significantly overextend in these assets.
Terminal target is the channel upper boundary and R3 weekly pivot at $55. A break out above this would be very bullish and could see prices as high as $80+
RSI has months left of upside. Analysis is only invalidated below the 200EMA.
Safe trading
Weekly crypto review: BTC trend structure Price continues to move in line with the main scenario discussed in previous weekly updates.
As long as the structure remains constructive and key supports hold, I'll be holding the base hypothesis of correction completion and gradual trend recovery as a prime one.
In this scenario, over the coming weeks and into Q4, I’d like to see:
• price holding above local support;
• breakout and consolidation above the 21-day EMA and 50-day MA;
• gradual movement toward next resistance zones — 115–120K, followed by 123K+.
Key levels:
• Local support: 109–107K
• Local resistance: 114–116K, then 120–123.5K
• Macro support zone: 102K
A breakdown below local support may trigger another retest of the lower boundary of the macro-support zone.
If weekly closes occur below 102K, it would notably increase the probability that the current long-term uptrend cycle is ending and a macro-correction phase is beginning.
Daily time frame:
Weekly:
Thank you for your attention — wishing everyone a calm weekend and a productive start to the new week!

GBPUSD (Oct 25, 2025) — Two Possible Scenarios AheadGBPUSD is completing a contracting structure on the 4H chart.
Price is approaching point D, where two outcomes are possible:
1️⃣ Direct Bullish Breakout — price holds above 1.33 and targets 1.3650–1.38 zone.
2️⃣ Short-term Sell then Bullish Rally — a fakeout below D before wave E reversal.
Both cases point toward a medium-term bullish structure developing.
Market confirmation will decide the next leg — stay patient and disciplined.
Bias: Bullish after D
Timeframe: 4H
Pair: GBP/USD
#GBPUSD #WaveAnalysis #PriceAction #ElliottWave #ForexTrading #SmartMoneyConcept #TechnicalAnalysis #TraderMindset #ForexCommunity

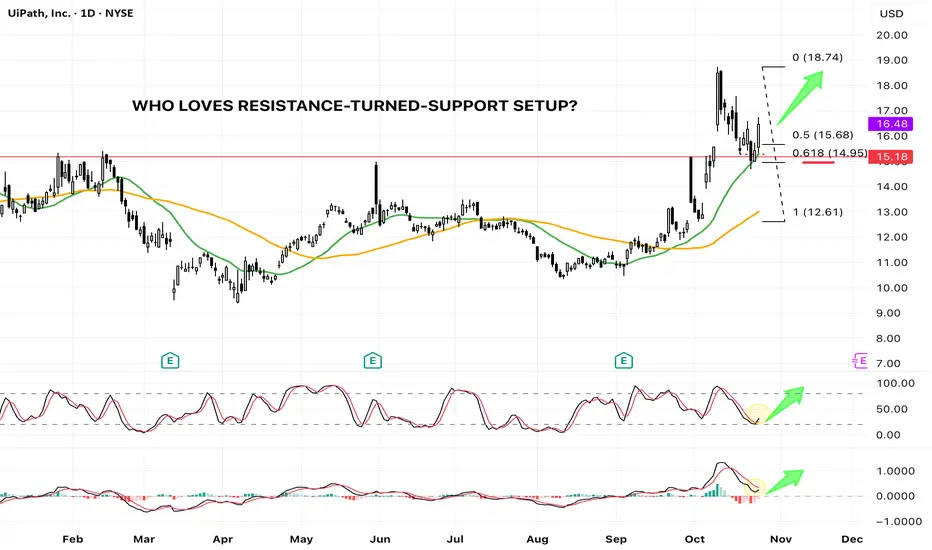
PATH - Textbook R/S Flip at Key Fib & MA Support (Bullish Setup)UiPath ( NYSE:PATH ) spent the majority of 2025 range-bound, oscillating between the $10 and $15 marks. This consolidation phase ended dramatically in early October, when the price decisively breached the long-standing 2025 horizontal resistance at approximately $15.
The breakout led to a swift rally, tagging a new year-to-date high of $18.74 . Following this strong move, the stock began a healthy retracement, pulling back to test the very level that had previously acted as resistance—the classic Resistance-Turned-Support (R/S Flip) setup.
The Confluence of Support
This current pullback is resting on a powerful confluence of technical supports, significantly increasing the probability of a bullish continuation:
1. Horizontal Support: The previous major resistance line (around $15) now acts as a crucial horizontal support.
2. Moving Average Support: The price is testing the 20-day Simple Moving Average (SMA 20, Green Line) . Importantly, this is the first time the price has pulled back to the SMA 20 since the bullish SMA 20/SMA 50 Golden Cross , signaling a strong trend retest.
3. Fibonacci Golden Pocket: The retracement has landed perfectly into the 0.618 Fibonacci Retracement level (from the $12.61 swing low to the $18.74 swing high), a statistically significant reversal zone often called the "Golden Ratio."
Momentum Indicators Confirm Bullish Bias
Beyond the price action, our auxiliary indicators are flashing constructive signals:
* Stochastic: The Stochastic oscillator is reversing from the oversold territory and is showing a clear bullish cross , indicating waning selling pressure and the start of a new upward momentum cycle.
* MACD: The Moving Average Convergence Divergence (MACD) indicator is attempting a bullish cross above the zero line , a powerful sign of increasing positive momentum.
Conclusion
The confluence of price action and indicator signals presents a high-probability bullish setup. The market is currently rewarding the successful test of the R/S flip at the 0.618 Fib and SMA 20 support.
While this setup suggests a strong likelihood for the next leg higher, traders must remember that trading involves probabilities. A clearly defined stop-loss is essential to manage risk should the market invalidate this robust support zone.
NASDAQ: CEG — Strong Rebound from Support, Uptrend Still Intact?On the daily chart, CEG found solid support and began to rebound.
The September price action shows a clear higher high, higher low structure — confirming a healthy uptrend. The upward trendline (green) continues to act as reliable dynamic support.
In October, the stock broke above the previous horizontal resistance (red dotted line), and recent pullbacks have retested the same level as support — a classic resistance-turned-support setup.
After a successful retest of the horizontal support line — which coincides with the Fibonacci 0.618 retracement zone — the latest candle closed back above the 20-day SMA (purple), reaffirming that the uptrend remains firmly intact.
Friday’s session showed strong momentum with a gap-up and a full-bodied bullish candle, signaling renewed buying interest.
Overall, the uptrend remains valid, and this rebound from support may mark the beginning of the next leg higher.

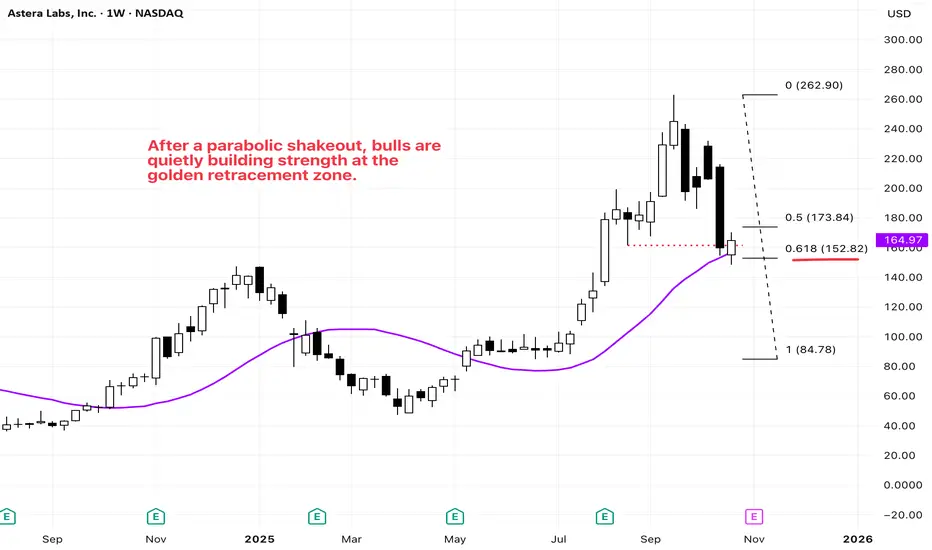
NASDAQ: ALAB — Holding the Golden Zone After a Parabolic DropALAB shows a structure similar to RDDT(see my previous idea) — a newly listed growth stock that gained strong momentum after breaking above its weekly SMA 20 in mid-May.
After reaching an all-time high, the stock started to pull back in late September.
Recently, a sharp parabolic drop drove the price down toward a confluence of supports:
* the previous swing low around $160(red dotted line),
* the weekly SMA 20 (purple),
* and the Fibonacci 0.618 retracement level of the recent rally.
This week’s candle closed bullishly, reclaiming the $160 area and confirming strong demand at this golden zone. The sharp sell-off likely flushed out retail stop orders, providing the base for a potential next leg up.
Overall, this area offers an attractive risk-to-reward setup, with technical supports aligning across multiple timeframes.
NYSE: RDDT Weekly – A Classic 0.618 Pullback in PlayRDDT has been trending higher since April, and its uptrend gained momentum after breaking above the 20-week SMA in mid-June.
The stock saw some pullback in mid-September, retesting the previous swing low around 205 (red dotted line), which also lines up with the rising trendline (green) and the 20-week SMA (purple) — right near the key Fibonacci 0.618 level.
This week, price bounced from that confluence zone and closed with a bullish candle, reclaiming the previous low. The move looks like a possible stop-hunt before the next leg higher, showing that buyers are defending this key support area.

Euro Coils Ahead of Fed / ECBEuro plummeted more than 3.1% from the yearly highs with price exhausting into technical support for the past three-weeks and the focus is on possible inflection into this zone with the medium-term risk still weighted to the downside while below the monthly open (1.1734).
Initial weekly support rests with the July low-week close (LWC) / 61.8% retracement of the July advance at 1.1586/93 and is backed by 1.1497-1.1505- a region defined by the March 2020 high, the 2022 high, and the 100% extension of the September decline. Look for a larger reaction there IF reached with a break / weekly close below needed to suggest a more significant high is in place / a larger correction is underway within the broader uptrend. Subsequent support objectives eyed at the Aril high close at 1.1394 with the next major technical consideration eyed at the 2024 high-week close (HWC) / 38.2% retracement of the yearly range at 1.1228/54.
Weekly resistance is eyed at the 1.1747/75- a region defined by the 2025 HWC, the June high-close, and the 61.8% retracement of the September decline. A breach / weekly close above this pivot zone is needed to mark resumption of the broader uptrend with key resistance steady at the 100% extension of the 2022 advance / 38.2% retracement of the broader 2008 decline at 1.1917-1.2020 (area of interest for possible exhaustion / price inflection IF reached. Subsequent resistance eyed at the 2021 HWC at 1.2218 in the event of a breakout.
Bottom line: Euro is trading just above support, and the focus is on inflection off this zone in the days ahead with a weekly close below needed to fuel the next leg of this pullback. From a trading standpoint, rallies should be limited to 1.1734 IF price is heading lower on this stretch with a close below 1.1497 needed to fuel the next leg of the decline.
-MB

“Bitcoin is consolidating after a strong recovery from the deman “Bitcoin is consolidating after a strong recovery from the demand zone around 108,800. The orange circle highlights a clean higher low, confirming buyers’ control. Right now, price is holding above the 50% Fibonacci retracement and testing the 61.8% level near 111,200. If bulls manage to break and close above this yellow resistance zone, the next target sits around 112,400 — the 78.6% Fibonacci level.

$COAI — market maker in full control🎯 When a market maker has a goal — no market sentiment can stop him.
💥 The price of $COAI has almost been “pushed” to its all-time high around $20, while the project’s market cap has already climbed to nearly $4B.
A lot or not — for such a “young” project? 🤔
📈 What’s more, arbitrage traders are adding fuel to the fire — with a funding rate of -1.5%/h, short sellers are literally paying long holders to stay in position.
That creates a chain reaction: short liquidations → less liquidity → another price spike 🚀
⚠️ But once the market maker reaches his target — this could all end suddenly.
The market’s emotional right now, so stay alert.
💡 Some even speculate that similar moves might be repeated on other freshly listed tokens.
What do you think — could that happen again?
Drop your thoughts in the comments and we will analysis this coins 👇
______________
◆ Follow us ❤️ for daily crypto insights & updates!
🚀 Don’t miss out on important market moves
🧠 DYOR | This is not financial advice, just thinking out loud.

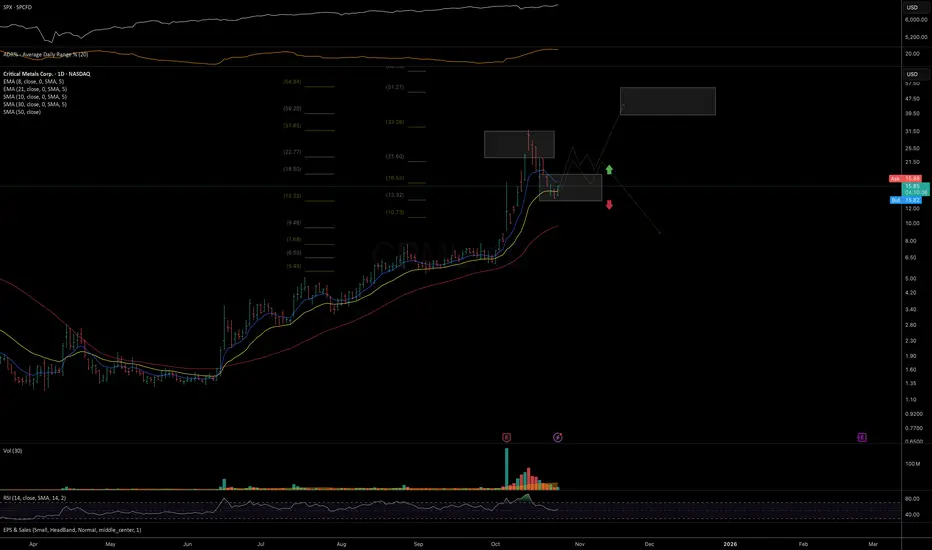
CRML dubious speculationHighly speculative setup, but for now, price continues to respect the key levels of uptrend support and resistance.
As long as price holds above 13, there is room for at least a bounce, if not a potential continuation move toward the 39–55 macro resistance zone, which aligns with the broader uptrend structure from the April 2025 bottom.
Chart:
BMNR: potential start of a new swing move Still early in development and price has a lot to prove before confirming a sustainable trend shift, but it might be attempting to start a new swing from today’s action.
The key task for bulls is to see closes above the EMAs and the formation of a higher low to confirm stability of upside momentum.
Conversely, a breakdown below the 44–42 support zone would increase odds for further downside and invalidate the potential reversal setup.
Chart:
