#ETHUSDT: Still Waiting For Price To Come Down $2000 LevelETHUSDT OVERVIEW! 🏆🚀
🔺The market is still showing signs of weakness. We’re seeing a lot of traders getting tired of buying at the $3400 level, which is a big deal for many swing traders. Right now, we’re still thinking it’s best to buy ETH when it’s at the lower price of $2000. To do this, we need the price to drop a lot, with lots of strong bearish trading happening each day.
🔺We’re aiming to get in at $2000, but it might take some time for the price to get there. We’re going to wait for a clear sign from the market.Right now, the main reason people are buying is because of what’s happening with the fundamentals, and we think those will settle down soon. Once they do, we expect the price to go down a bit.
🔺When you’re trading cryptocurrency, it’s really important to be careful with your risk. It can be risky and you could lose all your money. This analysis is just to help you learn, so please do your own research and make sure you understand the risks.
Team SetupsFX❤️🧠
Fibonacci

BTC is forming a corrective bounce within a broader downtrend.Price is reacting from local support and may retrace toward the descending trendline and key Fibonacci resistance.
Overall structure remains corrective; rejection at resistance would confirm continuation lower.

SOL $80 bottom?CRYPTOCAP:SOL is accelerating in wave C of 4 and now coming into a major High Volume and 0.382 Fibonacci retracement zone where wave 4 has a high probability of ending.
Wave Cs are characteristically scary for investors and come with extreme negative sentiment and quick drops to add fuel to the fear. Thats why they are capitulation events.
Losing $80 bring up the weekly S1 pivot at $8.
Weekly RSI has hit oversold but with no divergence.
Safe trading

AUD/JPY Market Analysis: Macro + Structure [MaB]1. The Macro Context (The "Why") 🌍
Hi traders! Before looking at the candles, let's look at the money. My fundamental scoring table speaks clearly: there is a +7 differential, indicating a Strong Bullish bias that we cannot ignore.
Key Factor Analysis:
🏦 Current Rates: Explanation: RBA is at 3.85% post-hike, making rates attractive, while BoJ remains at 0.75%, still very low vs G7. Score AUD: +1 Score JPY: -1
🌍 Economic Regime: Explanation: AUD is in Reflation with accelerating inflation; JPY is in Expansion (Goldilocks). Score AUD: +2 Score JPY: +1
📊 Rate Expectations: Explanation: RBA is hawkish, being the first major to hike in 2026; BoJ is hawkish following the December hike but in a tactical pause. Score AUD: +1 Score JPY: +1
🎈 Inflation: Explanation: AUD at 3.8% is well above target; JPY at 2.91% keeps pressure on BoJ for tightening. Score AUD: +1 Score JPY: +1
📈 Growth/GDP: Explanation: AUD GDP (2.3%) is considered more robust compared to the weak JPY GDP at 0.5%. Score AUD: 0 Score JPY: -1
⚖️ Risk Sentiment: Explanation: Current market appetite is neutral with no specific bias. Score AUD: 0 Score JPY: 0
🏛️ COT Score: Explanation: Longs are strong for AUD with accelerating buying; JPY shorts are strong but buying is starting. Score AUD: +2 Score JPY: 0
🗞️ News Bonus: Explanation: RBA hiked 25bp three days ago; no relevant JPY news in the last 24h. Score AUD: +1 Score JPY: 0
Currency Score Summary:
Total Score AUD: +8 (Strong Bullish)
Total Score JPY: +1 (Bullish)
Synthesis:
AUD (Strong, Score +8): Very strong with RBA being the first major to hike in 2026 and a determined hawkish stance.
JPY (Weak, Score +1): Benefits from a hawkish BoJ stance, but growth remains very weak at 0.5%.
Conclusion: With this scenario, we are only looking for Long setups.
2. The Technical Setup (The "Where") 📉
Timeframe: 4H | Pair: AUD/JPY
The SMC Market Structure + Price Zones indicator gave us the confirmation we needed for our statistical edge. Look at the dashboard on the right:
🚀 Continuation Rate (72.2%): We are well above the 60% threshold. This tells us the market is in a healthy, directional trend.
🔥 Streak (4) & Streak Pct (4): We are at the 4th consecutive impulse. It's a mature trend, but as long as the music plays, we dance.
🔄 Retest (41.2%): The indicator tells us that statistically, price retraces into the previous zone only 41.2% of the time.
💥 BOS/Ret Rate (68.1%): This parameter tells us that once price retraces inside the previous zone, it has a high probability of reacting and creating a new BOS.
🎯 Extension Rate (1.79x): The algorithm projects an ambitious target. We expect this move to extend 1.79 times the current pullback leg.
3. Execution Plan on Chart
Moving to the chart, the SMC Market Structure + Price Zones indicator supports us in pinpointing liquidity:
Entry and Stop Loss: We place a limit entry in the Demand Zone 4H (Cyan Band) and the stop loss a few pips below the zone.
Take Profit: We leverage the Extension Rate and place the target by measuring with Fibonacci at 1.79x relative to the pullback leg.
Trade Parameters:
Entry Price: 107.815 Stop Loss: 106.769 Take Profit: 112.011
⚠️ Disclaimer: This analysis is based on a proprietary algorithm and is shared exclusively for educational and didactic purposes. It does not constitute financial advice or investment solicitation in any way. Trading involves significant risk.

CIFR triangle in wave B has completed, per previousNASDAQ:CIFR has completed the triangle in wave B of 4 with thrust down in wave C, characteristic behaviour of wave Cs.
Triangle are patterns found before a terminal move suggesting we are nearing a bottom at the daily 200EMA, 0.236 Fibonacci retracement.
Safe trading

FET SHort exitMy NYSE:FET short exit remains $1.4 at the High Volume Node support EQ.
I don't expect FET to be a significant player moving forward.
Safe trading

IREN Ready for lower $27.50Interestingly the same pattern as CRYPTOCAP:BTC which has been a leading indictor for some stock price action for some time, with stocks lagging.
Price appears to have completed wave B up, with yesterdays -17% drop.
Wave C of 4 is underway with an initial target of the 0.382 Fibonacci retracement, right at the S2 pivot and High Volume Node $27.50. The 1:1 of wave A to B.
Safe trading

BTC triple major supportSET:BTS has arrived at the weekly 200EMA, S1 weekly pivot and major High Volume Node on weekly RSI oversold. Weekly bearish divergence has now played out. Price could go lower but this s High probability major bottom area. Wave 4 is likely to finish around the .382 Fibopnacci retracement form the 2022 bottom to 125k.
This has only ever happened 3 times with a 500%+ rally afterwards.
Sentiment is the worst it ever been for the longest at extreme fear, 11.
Safe trading

Banknifty 06/02/2026 Analytics.Price is currently trading inside a falling channel, forming lower highs and lower lows.
Short-term trend remains bearish unless price breaks and sustains above the upper channel.
🔸 Key Decision Zone (Rectangle Area):
➡️ 60,120 – 60,200
🔴 Scenario 1 – If market opens / sustains below this zone:
Bearish continuation likely
📉 Targets:
• 59,980
• 59,880 (Major Support)
🛑 Stop Loss: 60,220
Logic:
✔ Falling channel intact
✔ Price below 9 & 20 EMA
✔ Rejection from supply zone
✔ Weak pullback structure
🟢 Scenario 2 – If market opens / sustains above this zone:
Pullback reversal possible
📈 Targets:
• 60,300
• 60,390
🛑 Stop Loss: 60,050
Logic:
✔ Upper channel breakout
✔ EMA reclaim
✔ Possible short-covering move
🧠 Technical Analytics:
✅ Trend: Short-term bearish
✅ Pattern: Falling channel
✅ EMA: Price below fast EMAs → weakness
✅ Volume: Declining volume on fall → bounce possible, confirmation needed
✅ Best setup: Zone break + retest
⚡ Conclusion:
👉 60,120–60,200 = Make or Break Zone
Below zone → Sell on rise
Above zone → Quick pullback buy
Avoid entries without confirmation.

Bitcoin Daily Accumulation: Short‑Term Buy Bias Backed by Macro Bitcoin has sharply corrected from its 2025 highs and is now pulling back on the daily chart, but several fundamental drivers still favour a short‑term bullish bias.
Strong net inflows into spot Bitcoin ETFs at the start of 2026 signal renewed institutional demand and a reversal of the ETF outflows seen late last year, easing structural selling pressure.
With the Fed shifting to a more neutral stance on rates and Bitcoin trading in a fearful sentiment zone after the drop below the 75,000 area, the post‑halving environment of slower new supply continues to support dip‑buying interest.
I’m looking at BTC as a daily‑timeframe buy while price holds key support and ETF flows remain positive, targeting a grind back toward major resistance and psychological levels, with invalidation on a decisive daily close below the latest swing low and a clear deterioration in ETF inflows.

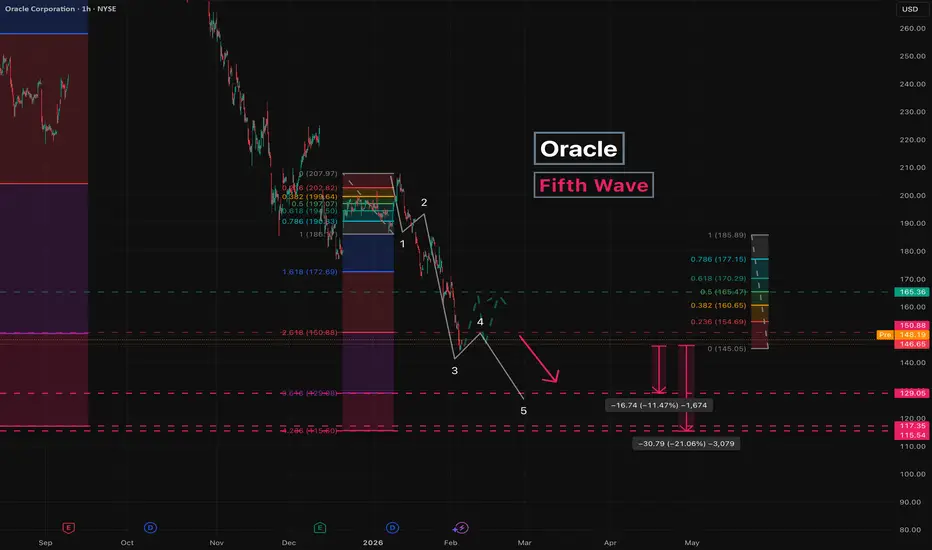
Oracle - Fifth WaveWe continue to analyze the decline in Oracle stock.
In the previous idea, we reached the first target at 150 , with price moving exactly along the projected path.
Wave 5 doesn’t look complete yet, so we expect further downside.
Before the next leg down, the price may pull back to around 165 or slightly lower.
Key targets:
129
117 / 115
Potential move from the current level: 11-21% .
A move below 100 is possible, but it’s too early to consider and seems unlikely for now.
Let’s focus on executing the current idea first.
---
Subscribe and leave a comment.
You’ll get new ideas faster than anyone else.
---
US 100 Index – Riding the Sentiment RollercoasterThe US 100 has ridden the sentiment rollercoaster up and down several times over the last 7 trading days.
On Wednesday 28th January it looked like the US 100 index may be ready to break to new record highs above 26277 (October 30th high), riding a wave of positive AI driven momentum, only to see that opportunity crushed by a negative reaction to Microsoft’s earnings update which flagged slowing growth in its cloud unit. Further disappointment followed on Friday, when President Trump announced that Kevin Warsh would be the new Federal Reserve Chair to replace Jerome Powell when his term ends in May. A move which threw into doubt market hopes for further interest rate cuts during the first half of 2026, weighing on stocks within the US 100 which usually benefit from lower interest rates to fund their growth. This all led to a Monday open drop down to lows at 25070.
Then suddenly everything changed again on Monday afternoon, a stronger US ISM Manufacturing PMI survey reenforced the narrative of a resilient US economy, and then Palantir Technologies posted a revenue forecast for 2026 that beat analyst expectations and the rally was back on again, well for 24 hours it was!
After trading from 25070 on Monday morning up to a high of 25919 on Tuesday, traders started to fret about the impact of AI on the business models of popular software companies, all sparked by the release of a new AI automation tool from Anthropic. Sentiment turned lower, then accelerated to the downside on Wednesday, as concerns grew regarding the impact of AI across a wider selection of industries. The negativity wasn’t helped by disappointing earnings updates from Alphabet and Qualcomm overnight, all of which led the US 100 to touch a weekly low of 24679.
While there has been a slight rebound this morning (24965, 0715 GMT), traders may remain cautious about where the US 100 could move into the weekend, especially given Amazon reports its latest results after the close tonight.
Against this uncertain backdrop reviewing the latest technical outlook could be helpful for future trade planning.
Technical Update: Focus on the 25129 Uptrend
While the US 100 index staged a strong recovery from the 24881 low of January 21st, the advance stalled beneath resistance extending up to the 26277 all‑time high posted on October 30th. As a result, recent price action has seen selling pressure reemerge, retracing all the prior advance, as the market anticipated then digested the Alphabet earnings release. As the chart below illustrates, this pullback is now below what might have been viewed by some traders as a key support area.
This old support at 25137, aligned with the uptrend connecting several lows from the November 21st downside extreme. However, with the risk of further volatility materialising in market activity, how the US 100 index reacts around this 25137 area moving into the Friday close could provide important clues about the next directional price moves.
Assessing Potential Support Levels:
While the close below the 25137 trendline is not a guarantee of further declines, it could encourage additional price weakness. Although not an outright negative in isolation, such a move could prompt traders to anticipate deeper declines and potential tests of lower support levels.
If a more extended decline in price were to unfold, focus may shift toward 24644, which is the December 17th session low. Closing breaks below this level could open the possibility for a deeper move toward 23834, which is the November 21st extreme.
Assessing Potential Resistance Levels:
Of course, the trendline break below 25137 may not attract increased selling pressure, however it may still be classed as the first resistance level on any bounce. Breaks back above 25137 could see the focus shift to 25454 as the next possible resistance focus. This level represents half of the latest decline. Closing breaks above 25454 may signal further attempts to push toward higher levels.
If such moves were to develop, tests of the key resistance zone at 26244/26277 (prior failure highs) might then be possible. However, closing breaks above 26244/26277 would still be required to open scope toward the next resistance at 27211, which corresponds to the 38.2% Fibonacci extension level.
The material provided here has not been prepared accordance with legal requirements designed to promote the independence of investment research and as such is considered to be a marketing communication. Whilst it is not subject to any prohibition on dealing ahead of the dissemination of investment research, we will not seek to take any advantage before providing it to our clients.
Pepperstone doesn’t represent that the material provided here is accurate, current or complete, and therefore shouldn’t be relied upon as such. The information, whether from a third party or not, isn’t to be considered as a recommendation; or an offer to buy or sell; or the solicitation of an offer to buy or sell any security, financial product or instrument; or to participate in any particular trading strategy. It does not take into account readers’ financial situation or investment objectives. We advise any readers of this content to seek their own advice. Without the approval of Pepperstone, reproduction or redistribution of this information isn’t permitted.

ENPH [Enphase Energy] EWP FIB TC ANALYSIS WEEKLY TFENPH – late-stage corrective structure
ENPH remains inside a long-term rising macro channel. The ATH at $339.92 marked the upper boundary, followed by a large corrective phase now unfolding within a descending channel.
Price is currently reacting near the 0.382 Fib (~31.12), but the main structural confluence lies lower in the 0.5–0.618 zone (~14.87 → 7.10), aligning with both the lower boundary of the corrective channel and the rising macro channel. RSI on the 3W timeframe is deeply oversold, suggesting downside momentum is mature.
A final flush into this demand zone would complete a textbook macro ABC correction, opening the door for reaccumulation and a potential multi-year continuation toward the upper macro channel.
This appears to be a bull-market correction, not a secular trend break.
Like and follow for more charts like this.

Coiling Like a CobraBeen tracking this textbook distribution since November and it appears that the market is coiling its way toward an explosive move. I personally have successfully traded the past few months like a protracted “short every bounce” opportunity and will continue to execute on my bearish corrective thesis until proven otherwise.
As a newer retail trader without decades of experience in weathering myriad market conditions, I did not possess the insight that I now have when the 2022 correction occurred. In fact, having only begun trading in January of 2021, just after the post-Covid parabolic recovery, my only reference point was the hyper-euphoric FinTwit regime of newly minted perma-bull millionaires. At that time the prevailing winds only blew in one direction—UP UP UP!
Across most of the Usual Suspects, SPY, QQQ, AAPL (as goes AAPL, so goes the market), Crypto, etc., everyone was buying the dip and getting rich. At least that’s what it looked like to me. So when the market dipped in January of ‘22, I took my port long with what appeared to be a sure thing. 0DTE calls became just the latest in a series of opioid-like addictions, and by mid-Summer I was financially dopesick, with no relief in sight. High tuition paid in full.
Fast-forward 3.5 years and here we are, all the perma-bears finally coming out of hibernation after the bulls’ exponential 10-20x gains. With nothing but bad news across the macro-verse, a looming AI bubble, failed Trump 2.0 expansion, flight to precious metals, the aforementioned textbook topping shows NQ already down-trending and multiple ES failures at 7000. Note that rising bearish volume since November. The fix is in. And it’s not looking pretty! ES 5000 incoming. Or I’m an idiot. Who knows?

NZDJPY - Consolidation above previously broken resistanceFX:NZDJPY continues to follow an upward trend amid the weakening of the Japanese yen, caused by the rise of the dollar. The currency pair is breaking through resistance and trying to stay above the key level.
The Japanese yen continues to decline. The index is falling below 0.64, which only reinforces the movement. Against this backdrop, the NZD may strengthen.
The currency pair is breaking through the resistance of the ascending triangle, which only confirms the bullish sentiment. Consolidation is forming above 94.0. If the bulls keep the price above the key support, the growth may continue.
Resistance levels: 94.18, 95.0, 96.0
Support levels: 93.900, 93.65
Consolidation above 93.90 - 94.0 and a breakout of 94.18 will be a confirming signal of readiness to move higher within the bullish trend.
Best regards, R. Linda!

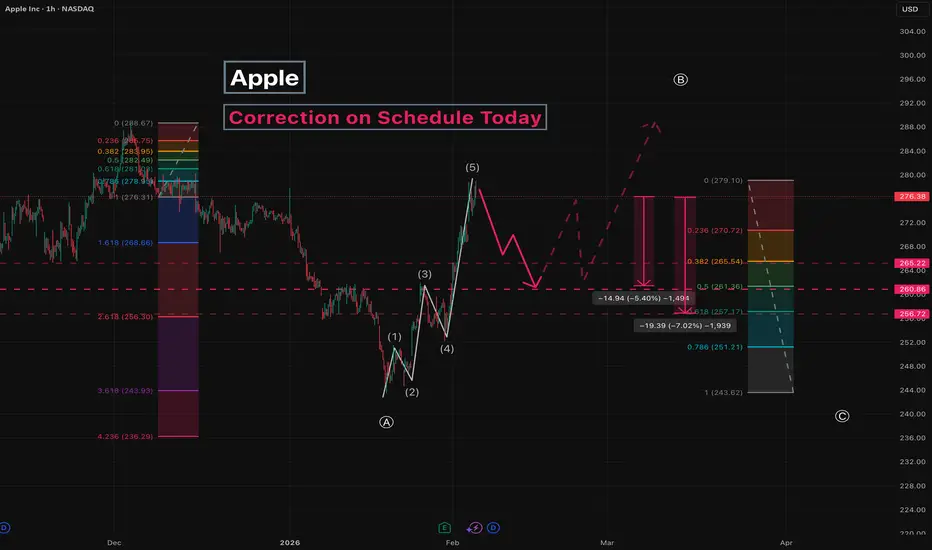
Apple - Correction on Schedule TodayWe continue to cover corrective moves in Apple stock.
Previously, we discussed Wave A .
Currently, the stock price is in Wave B .
The five -wave impulsive move up is complete and is now being corrected.
Key targets:
265 - local correction
260
256
Potential move from current level: 5-7% .
After that, expect a return to the growth phase,
with possibly one more small upward impulse toward the 290 area, slightly above or below, before Wave C develops.
---
Subscribe and leave a comment.
You’ll get new ideas faster than anyone else.
---
Silver — Bullish Correction Into a Bearish WallSilver just printed a fresh bullish ABC on the 1H.
C-target sits around $96 .
Here’s the part that matters:
That $96 level is also a bearish WCL from higher timeframe structure.
So no, this isn’t a “new bull market” victory lap.
HTF is still bearish .
But this pullback? It’s doing exactly what a healthy correction should do — walking straight into HTF resistance.
That’s ideal.
What I’m watching:
Bullish sequence stays valid → price can tag the $96 C-target
That level = decision point, not a blind buy zone
If HTF sellers show up there, continuation lower stays on the table
If $96 gets accepted, HTF bias is in trouble
This is context , not prediction.
Correction into resistance first. Reaction second. Ego last.
Let price speak.
Not financial advice.

Chumtrades XAUUSD Has Wave B finished?GOLD – DAILY PLAN
Has Wave B finished?
→ No confirmation yet.
Macro & Market Sentiment
US–Iran negotiations have been cancelled. Geopolitical risks remain, but not strong enough to trigger a new bullish wave.
Gold experienced a relatively calm trading session, failed to break above the key level around 5,100, and saw a moderate pullback during the US session.
The Daily candle formed a Spinning Top, indicating market indecision and consolidation, with a lack of momentum for a breakout.
👉 Macro factors are supporting prices, but not pushing the market into an immediate uptrend.
Technical Structure & Outlook
Price is still moving within a descending price channel.
On the H1 timeframe, price has broken above the 4,888 key level, showing a technical rebound.
However, the higher timeframe structure remains bearish, with no confirmed trend reversal.
→ Therefore, current rebounds are considered pullbacks within a downtrend.
Key Levels
Support: 4,810 | 4,830 | 4,700–4,750 | 4,650–4,624
Resistance: 4,950–5,000 | 5,100
Trading Scenarios
Primary strategy: Sell the rallies within the descending channel.
Look for SELL setups near resistance zones, targeting lower lows.
Momentum SELL may be considered if price clearly breaks below 4,882–4,890, with confirmation on H2 or H4, targeting around 4,810.
No BUY positions while price remains inside the descending channel.
👉 Only if price breaks and holds above 5,100, will we start reassessing a trend-following BUY scenario.
👉 Deeper pullbacks are viewed as potential zones for swing BUY opportunities, not short-term buys at this stage.
Note: The market is in a “confidence-testing” phase. Focus on zone-based trading, trend alignment, reduced position size, and avoid FOMO.

dolar dxy short idea using fibonacciusing fibonacci leveles to show idea in 4H graphic and take profit is in support levels from 2022

NQ Power Range Report with FIB Ext - 2/5/2026 SessionCME_MINI:NQH2026
- PR High: 25125.00
- PR Low: 25042.00
- NZ Spread: 185.5
Key scheduled economic events:
08:30 | Initial Jobless Claims
Session Open Stats (As of 12:25 AM)
- Session Open ATR: 462.90
- Volume: 49K
- Open Int: 272K
- Trend Grade: Long
- From BA ATH: -6.2% (Rounded)
Key Levels (Rounded - Think of these as ranges)
- Long: 26521
- Mid: 25264
- Short: 24008
Keep in mind this is not speculation or a prediction. Only a report of the Power Range with Fib extensions for target hunting. Do your DD! You determine your risk tolerance. You are fully capable of making your own decisions.
BA: Back Adjusted
BuZ/BeZ: Bull Zone / Bear Zone
NZ: Neutral Zone

META - a deeeeep pullback soon META had solid bull run and probably this gonna follow rest of the names in this pullback.
Short it anywhere with some longer expiry puts. My preference would be Enter and Exit with good R:R zones and take profits. Expecting a fast move to the downside soon.
I prefer to use round number targets as those zones have good liquidity for puts.
Target 1 - 680
Target 2 - 600
Target 3 - 555
Target 4 - 500
Target 5 - 450
Target 6 - 400

Bitcoin Below 40K? An Uncomfortable Pattern...
Looking back at Bitcoin’s historical behavior, a striking pattern emerges.
Across the last three major market cycles (dating back to 2013), Bitcoin has consistently retraced into the golden pocket of the 3.618 Fibonacci extension, measured from the most recent bear-market low to the subsequent bull-market high.
In each case, this zone acted as a magnet before the next structural phase unfolded.
If history were to repeat — and this is a BIG IF — a similar retracement would place Bitcoin below the 40K level (35K to be precise).
At the current moment, this scenario may feel hard to imagine. That said, the similarity in past behavior is remarkable and worth acknowledging from a purely technical perspective.
This is not a forecast and not financial advice — only an observation based on historical chart behavior.

Gamestop: Got To Love ItWell hasn't the narrative changed around GME
I've been WRONG and MORE WRONG about almost everything regarding pure timing with this one
But what I havent been wrong about is the fact that I said all last year that GME would hold that 20-22 region
What Im also not wrong on is the fact that there is NOTHING ABOVE 32
So what now?
No idea except I still feel the 20-22 region is the "floor" on GME and the price structure still points UP as far as I can tell
Where is the cat? No idea BUT I did say multiple times that GME DOES NOT NEED HIM TO RUN SIGNIFICANTLY HIGHER...and as we see someone else (i.e. Burry) is the recent viral catalyst
And the last question: Am I still in GME?
Of course :)
Good trading to you all!
P.S. I will not be responding to comments as this post is mainly just to document for myself a significant change in the GME story
