Inventing the "Growth" Story of Inventure "Growth & Securities"Inventure - A leading provider of investment advisory service and distributes financial products like mutual funds, insurance products, etc.
The stock turned Multi-bagged when it multipled from 0.80 / Share to 6.75 / share in a matter of 22 months. Now - after a perfect 0.786 retracement on the Fibonacci scale - it is all set to beat its earlier bull run.
Here are the Technicals:
Fib 0.786 Retracement on Monthly
Perfectly following a Parallel Channel on monthly since 10 years
A beautiful Rounding Bottom pattern - about to BO above 3.15 for Target of 4.8
Resistances:
A Multi-year resistance from its IPO duration in 2011 is pushing the price down from 3.1 levels. Inventure is all set to make new highs only 3.15 is taken out decisively on WCB
Targets
Short Term: 3.9
Rounding Bottom: 4.8
Fib Extensions: 6.15, 11.05
A True Multi-bagger in the making
Disclaimer:
Stocks-n-Trends is NOT a SEBI registered company. We do not provide Buy / Sell recommendations - rather we provide detailed analysis of how to review a chart, explain multi--timeframe views purely for Educational Purposes. We strongly suggest our followers to "Learn to Ride the Tide" and consult your Financial Advisors before taking any positions.
If you like our detailed analysis, please do rate us with your Likes, Boost and share your comments
-Team Stocks-n-Trends
Fibonacci Confluence

Bitcoin: All Fibonacci Schematics-This concept overall is called Fibonacci Clustering , which is laying over many different Fib Schematics on each-other...
-I have combined 7 of my greatest Bitcoin Schematics into this one complete idea.
-These Fibonacci Clustered charts have been battle tested for months. I have linked the original ideas down below to show how I first created these (by myself).
- The first box is a monthly timeframe with the longest fib circles from each halving , so there are two circles .
--VERY IMPORTANT--
THE FIBONACCI EXTENSIONS ON #1 ARE HIGHLIGHTED AS WHITE HORIZONTAL LINES . WE FRONTAN 70K AND RETREATED BACK TO 15K . GIVEN THIS MONTHLY PATTERN OF A FRONTRUN AND RETURN TO THE MEAN WE CAN EXPECT TO FULLY TAKE 70K AND THEN SOME BASED SOLEY ON THE FRONTRUNNING OF 70K....
-There is also the longest/earliest Fibonacci Extension in the 1st box. This is why it is a Monthly.
-The second and third box are the 2 most prominent weekly schematics for Bitcoin . They are separate boxes but work together simultaneously.
-Since they are created after #1, it makes sense to make them weeklies. But if I were to place them all into Monthly timeframes or visa versa, it would work either way ...
If you click on "The Bitcoin Matrix" linked below, you'll notice that the Spikes in this idea are from #1 #2 and #3 in that one...

XRP Bull Breaker - Alternate View By Popular Request (5:1 Short)My most popular idea by far, with over 70 comments in half as many hours, is this one, which I've revised in order to show the Trend Exhaustion details w/in the AVWAP Array on the 1D chart. Again, if you are a long term Bull, you won’t like it, and yet since I operate by the Steel Man principle, I welcome your toughest questions and chart-based counter-arguments.
As I always, I strive to render my ideas so that I need no words to explain them, although I can (and do) write detailed paragraphs (elsewhere).
Anyways, in the medium term, I expect price to fall to the $0.3785 shown here, which also marks the Point-of-Control from the last major swing low. Price Action already tested the positive 3rd Standard Deviation of the AVWAP from the same reference point, as shown, and will, by degrees, retest the negative 2nd Standard deviation below (+/- $0.22 USD as of this writing).
The stop loss shown here is discretionary and conservative, and should be revised for current conditions if you are considering a short trade. Closer study on lower timeframes may reveal a better entry or stop loss as the chart unfolds over time.
Hopefully this version clarifies a few details for the confused.
In practice, the Trend Exhaustion Wedge reveals stop loss and profit targets for day traders on the lowest time frames (minutes, even seconds), which are, by nature, moving targets on any given day. The AWVAP Array, on the other hand, is dynamic, and prints according to the timeframe, unlike the trend lines.
I intend to start live-streaming soon, so feel free to ask questions if you have any. Critical thinkers only ... XRP-Trolls need not apply.
Until then, be liquid!

BTCUSDT - 17/09/2023The weekend for BTC is essentially a trap. People get bored, they get into trades, place their stop losses at the recent high/low and eventually get stopped out, most of the times on both sides, long and short.
A variant of the TR Pocket Fib consists of drawing it from the Saturday's high to its low, referring to UTC+0 timezone and after that I will then look at current market conditions to determine which entries are most likely to happen.
This Sunday I believe we can actually get a trade from all 4 levels or 2 at least because I think it's most probable for us to come to one of the lower levels to get liquidity and then go to the higher ones, possibly 27000 which has a Single Print or to 27190 which is a TPO POC. However, when and if we go to one of those higher levels, it is also very probable to come down to 23568 which has another Single Print right on top of a super ancient Breaker Block. This trap move usually happens around Sunday 16 to 19pm UTC+0.
So I think the most probable move would be to reach a lower level of the TR Pocket, bounce from there and then reject from 27000 (Single print), 27190 (TPO POC) or 27392 (Liquidation level).
However, if we go to one of the levels above first, it would then be probably best to cancel the longs since we have a considerable liquidity curve to grab and also a big vector to recover below us.
How I personally trade this is to enter on each of the levels, take TP1 at the 0.5 of the TR Pocket Fib, move the stop to breakeven and then try to let the rest ride because this can be the trade that lasts for 3 or 4 days until we get the Mid-Week-Reversal.
Also, although my bias is for more downside, we have to consider we are in a macro daily range, ever since we SFP'd 24778 (MEXC Value) so any of these long entries might be what takes BTC up if we are to do a full range rotation eventually.

EURUSD 4H Bullish & Bearish EURUSD 4H Bullish & Bearish and M and W.
Double tops and bottoms are important technical analysis patterns used by traders.
A double top has an 'M' shape and indicates a bearish reversal in trend.
A double bottom has a 'W' shape and is a signal for a bullish price movement.
Double top and bottom formations are highly effective when identified correctly. However, they can be extremely detrimental when they are interpreted incorrectly. Therefore, one must be extremely careful and patient before jumping to conclusions.

Gold's Final Schematic: Fibonacci ClusteringXAU covered through Fibonacci Clustering.
Two are regular scale charts and the other two on the right are Logarithmic.
This Final Fib Set I made for Gold is built to last.

BNBUSDT Potential Bear ActionPotential bearish scenario to this asset. Price action is suggesting a further drawdown to the 239USDT demand region as the actual pullback seems to be accomplished. The reciprocal AB=CD pattern projection is reinforcing this idea, as a Head and Shoulders pattern is likely in formation. Thus, on this hypothetical 30m scenario, the price can made a ranging interacting w/ the neckline. Chaikin Money Flow hidden divergence & below zero + Awesome oscillator twin peaks in formation + Fisher Transform bear crossing.

WC June 19 XAUUSD OutlookShorts are in order but banking only until 618 level. Breached a weekly trendline. Could progress further to 786 but we will see how price reacts to M3 key level.

EURUSD weekly outlook: Bearish bias for June weeks 3-4Weekly Outlook (W)
Bear bias until price action establishes an uptrend above 1.1092
6/15/23
Still making higher highs and lower highs
Last week of May just made the last higher low @ Weekly fib 78.6 level
Expectation:
IF
Continues uptrend: reach last HH level or 1.1100 and eventually 1.1250 (27 ext)
If not:
Price reactions from levels below:
1) 0.0865
H&S Weekly line and does a downtrend from there
2) Weekly IMB and OB with BOS down.
INVALIDATION POINT: 1.1092

📈 Fibonacci Power in Uptrends📍 What Are Fibonacci Retracement Levels?
Fibonacci retracement levels—stemming from the Fibonacci sequence—are horizontal lines that indicate where support and resistance are likely to occur.
Each level is associated with a percentage. The percentage is how much of a prior move the price has retraced. The Fibonacci retracement levels are 23.6%, 38.2%, 61.8%, and 78.6%. While not officially a Fibonacci ratio, 50% is also used.
The indicator is useful because it can be drawn between any two significant price points, such as a high and a low. The indicator will then create the levels between those two points.
📈 To effectively trade Fibonacci retracements during an uptrend and strategically enter the market during pullbacks, follow these steps:
🔷Identify the uptrend: Determine the presence of a clear upward price movement.
🔷Apply Fibonacci tool: Utilize the Fibonacci retracement tool to identify potential retracement levels within the uptrend.
🔷Focus on pullbacks: Wait for the price to experience a pullback or retracement within the uptrend.
🔷Assess Fibonacci levels: Analyze the price's interaction with key Fibonacci levels, such as the 61.8% or 65% zone, to identify potential support or resistance areas.
🔷Higher highs confirmation: Look for the formation of higher highs after the price touches a Fibonacci level, indicating a continuation of the uptrend.
🔷Entry opportunity: Consider entering the market after a pullback when the price resumes its upward movement, using appropriate risk management strategies.
By combining the power of Fibonacci retracements, recognizing pullbacks in uptrends, and waiting for higher highs, traders can position themselves to capitalize on the potential profit opportunities offered by the market.
👤 @QuantVue
📅 Daily Ideas about market update, psychology & indicators
❤️ If you appreciate our work, please like, comment and follow ❤️

$EURUSD Can Jump #EURUSDTraders and Investors,
EURUSD has been falling after reaching one of our long-term targets. Now it is at a junction from which it can make a little jump. The price action is still weak, so we must be watchful and wait for good confirmations.
Please support this analysis by liking and sharing. 👍🙂
Rules:
1. Never trade too much
2. Never trade without a confirmation
3. Never rely on signals, do your own analysis and research too
✅ If you found this idea useful, hit the like button, subscribe and share it in other trading forums.
✅ Follow me for future ideas, trade setups, and updates on this analysis
✅ Don't hesitate to share your ideas, comments, opinions, and questions.
Take care and trade well
-Vik
____________________________________________________
📌 DISCLAIMER
The content of this analysis is subject to change at any time without notice and is provided for the sole purpose of education only.
Not financial advice or signal. Please make your own independent investment decisions.
____________________________________________________

$TSLA Can Fall #TeslaTraders and Investors, Tesla has been in a downtrend and is looking weaker at the moment. It is forming a potential M pattern which can push the price down. A good confirmation may be needed to initiate a position.
Please support this analysis by liking and sharing. 👍🙂
Rules:
1. Never trade too much
2. Never trade without a confirmation
3. Never rely on signals, do your own analysis and research too
✅ If you found this idea useful, hit the like button, subscribe and share it in other trading forums.
✅ Follow me for future ideas, trade setups, and updates on this analysis
✅ Don't hesitate to share your ideas, comments, opinions, and questions.
Take care and trade well
-Vik
____________________________________________________
📌 DISCLAIMER
The content of this analysis is subject to change at any time without notice and is provided for the sole purpose of education only.
Not financial advice or signal. Please make your own independent investment decisions.
____________________________________________________

$EURCAD Can Rise Now #EURCADTraders, EURCAD has been falling nicely and gave us a very good short trade. Now it has completed an M pattern in a medium time frame. When the M pattern completes the market goes up. So we can expect this market to rise up any time.
Beware that this can still form an extended M pattern as we have a trend lines cross. So trade what you see and only with a confirmation.
Please support this analysis by liking and sharing. 👍🙂
Rules:
1. Never trade too much
2. Never trade without a confirmation
3. Never rely on signals, do your own analysis and research too
✅ If you found this idea useful, hit the like button, subscribe and share it in other trading forums.
✅ Follow me for future ideas, trade setups, and updates on this analysis
✅ Don't hesitate to share your ideas, comments, opinions, and questions.
Take care and trade well
-Vik
____________________________________________________
📌 DISCLAIMER
The content of this analysis is subject to change at any time without notice and is provided for the sole purpose of education only.
Not financial advice or signal. Please make your own independent investment decisions.
____________________________________________________

$NZDCAD Can Rise On An M Pattern #NZDCADTraders, NZDCAD has been falling nicely and gave us a very good short trade. Now it has completed an M pattern in a medium time frame. When the M pattern completes the market goes up. So we can expect this market to rise up any time.
Please support this analysis by liking and sharing. 👍🙂
Rules:
1. Never trade too much
2. Never trade without a confirmation
3. Never rely on signals, do your own analysis and research too
✅ If you found this idea useful, hit the like button, subscribe and share it in other trading forums.
✅ Follow me for future ideas, trade setups, and updates on this analysis
✅ Don't hesitate to share your ideas, comments, opinions, and questions.
Take care and trade well
-Vik
____________________________________________________
📌 DISCLAIMER
The content of this analysis is subject to change at any time without notice and is provided for the sole purpose of education only.
Not financial advice or signal. Please make your own independent investment decisions.
____________________________________________________

#NASDAQ Can Go Higher $NQ $NDX On The Higher Time FramesTraders, We have been bullish since the last quarter of 2022 on this market. NASDAQ now is reaching a point of a possible breakout. Short term it can go a down a bit but on this higher time frame, it is still forming a bigger W FCP Pattern which means that it is still on its target to reach higher levels.
Please note that the chart is Weekly timeframe.
Please support this analysis by liking and sharing. 👍🙂
Rules:
1. Never trade too much
2. Never trade without a confirmation
3. Never rely on signals, do your own analysis and research too
✅ If you found this idea useful, hit the like button, subscribe and share it in other trading forums.
✅ Follow me for future ideas, trade setups, and updates on this analysis
✅ Don't hesitate to share your ideas, comments, opinions, and questions.
Take care and trade well
-Vik
____________________________________________________
📌 DISCLAIMER
The content of this analysis is subject to change at any time without notice and is provided for the sole purpose of education only.
Not financial advice or signal. Please make your own independent investment decisions.
____________________________________________________

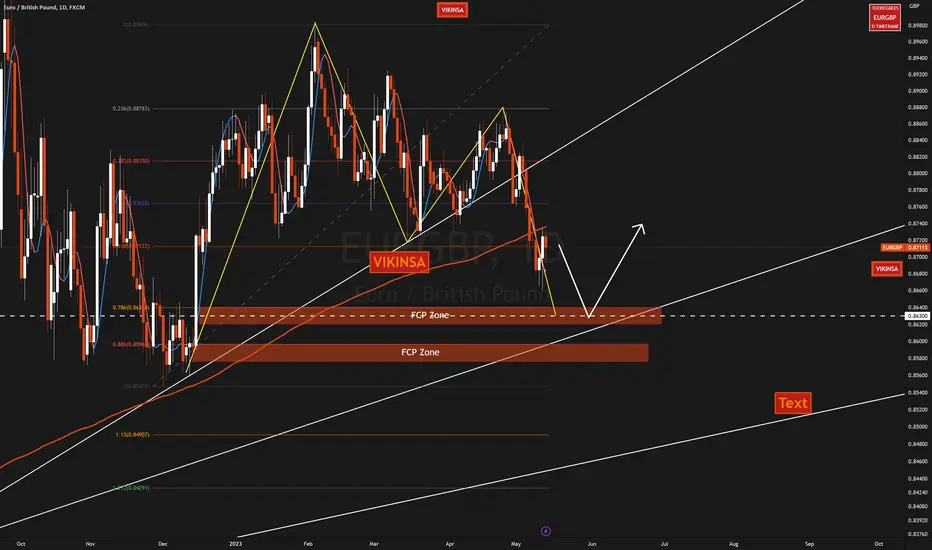
$EURGBP Can Fall Down Further Before Rising Up #EURGBPTraders, EURGBP last week showed a rejection from the 200 sma. It fell a bit from there. We have a potential M pattern forming on the daily time frame. So it can continue to fall until it reaches one of the FCP zones where it can bounce upward again.
Please support this analysis by liking and sharing. 👍🙂
Rules:
1. Never trade too much
2. Never trade without a confirmation
3. Never rely on signals, do your own analysis and research too
✅ If you found this idea useful, hit the like button, subscribe and share it in other trading forums.
✅ Follow me for future ideas, trade setups, and updates on this analysis
✅ Don't hesitate to share your ideas, comments, opinions, and questions.
Take care and trade well
-Vik
____________________________________________________
📌 DISCLAIMER
The content of this analysis is subject to change at any time without notice and is provided for the sole purpose of education only.
Not financial advice or signal. Please make your own independent investment decisions.
____________________________________________________
$DXY Latest Analysis #DXY #USDOLLARTraders and Investors,
It is still consolidating. I tried to go higher in the last week of the last month but failed to keep the breakout. There is a double bottom below which can target liquidity but trade what you see. It may or may not happen. Below this, we have 100 as the psychological level. A possible W pattern is also forming. It is not confirmed yet and is just a scenario (possibility) for now to consider. The higher time frame levels are there on the chart.
Please check USDCHF and USDJPY analysis too as they can give strength to DXY.
Please support this analysis by liking and sharing. 👍🙂
Rules:
1. Never trade too much
2. Never trade without a confirmation
3. Never rely on signals, do your own analysis and research too
✅ If you found this idea useful, hit the like button, subscribe and share it in other trading forums.
✅ Follow me for future ideas, trade setups, and updates on this analysis
✅ Don't hesitate to share your ideas, comments, opinions, and questions.
Take care and trade well
-Vik
____________________________________________________
📌 DISCLAIMER
The content of this analysis is subject to change at any time without notice and is provided for the sole purpose of education only.
Not financial advice or signal. Please make your own independent investment decisions.
____________________________________________________

$CADJPY Can Rise #CADJPYCADJPY has a similar pattern as USDJPY. Please see the attached USDJPY analysis:
Please support this analysis by liking and sharing. 👍🙂
Rules:
1. Never trade too much
2. Never trade without a confirmation
3. Never rely on signals, do your own analysis and research too
✅ If you found this idea useful, hit the like button, subscribe and share it in other trading forums.
✅ Follow me for future ideas, trade setups, and updates on this analysis
✅ Don't hesitate to share your ideas, comments, opinions, and questions.
Take care and trade well
-Vik
____________________________________________________
📌 DISCLAIMER
The content of this analysis is subject to change at any time without notice and is provided for the sole purpose of education only.
Not financial advice or signal. Please make your own independent investment decisions.
____________________________________________________

$GBPUSD Watch These 2 Zones On #GBPUSD Traders and Investors,
GBPUSD has been very bullish but the recent price action has started to show signs of fatigue. So watch these 2 zones (as marked on the chart) for a possible correction downward or trend reversal. A proper confirmation will be needed as the trend has been strong.
Please support this analysis by liking and sharing. 👍🙂
Rules:
1. Never trade too much
2. Never trade without a confirmation
3. Never rely on signals, do your own analysis and research too
✅ If you found this idea useful, hit the like button, subscribe and share it in other trading forums.
✅ Follow me for future ideas, trade setups, and updates on this analysis
✅ Don't hesitate to share your ideas, comments, opinions, and questions.
Take care and trade well
-Vik
____________________________________________________
📌 DISCLAIMER
The content of this analysis is subject to change at any time without notice and is provided for the sole purpose of education only.
Not financial advice or signal. Please make your own independent investment decisions.
____________________________________________________

$USDJPY Can Rise #USDJPYTraders and Investors,
Overall on the monthly and weekly time frame, it is still bullish although it fell down from the 150 level. Once this sort of thing happens, it is natural for the price action to revisit areas around previous highs to form a W pattern. USDJPY created a double top this week and fell down. now we are watching a few zones and the trend lines which can provide support to the price. If the price gets supported it can target that liquidity above the double top. This also can lead it to rise higher to complete a W pattern. The formation of the W pattern is bullish and the completion is bearish. So whilst it will be making a W pattern, it is expected to rise higher.
So watch out for these levels and trend lines in the coming weeks.
Check UDSDCHF also pointing a little bullish pattern here:
Please support this analysis by liking and sharing. 👍🙂
Rules:
1. Never trade too much
2. Never trade without a confirmation
3. Never rely on signals, do your own analysis and research too
✅ If you found this idea useful, hit the like button, subscribe and share it in other trading forums.
✅ Follow me for future ideas, trade setups, and updates on this analysis
✅ Don't hesitate to share your ideas, comments, opinions, and questions.
Take care and trade well
-Vik
____________________________________________________
📌 DISCLAIMER
The content of this analysis is subject to change at any time without notice and is provided for the sole purpose of education only.
Not financial advice or signal. Please make your own independent investment decisions.
____________________________________________________

$USDCHF Can Rise Soon #USDCHFTraders and Investors,
USDCHF has completed a weekly M pattern as we approach the end of this week. Remember this is a weekly time frame pattern so may take days and weeks but we can expect USDCHF to rise upward because of the M pattern and trend line. This can impact EURUSD inversely and also can give strength to DXY (USDOLLAR) which in turn can impact all asset classes.
Last week (the last week of April) a rise in this gave strength to DXY. This can happen again. So beware of this potential bullish pattern.
DXY, on the other hand, has a possibility of W formation of a smaller time frame which can push the price up
There are also a few gaps left on DXY as below in the chart. Bearea that we have a potential double bottom and 100 psychological number. So the market may try to come down to collect liquidity below the double bottom and 100 number. But even in that case, the potential bullish W pattern will still be valid.
Please support this analysis by liking and sharing. 👍🙂
Rules:
1. Never trade too much
2. Never trade without a confirmation
3. Never rely on signals, do your own analysis and research too
✅ If you found this idea useful, hit the like button, subscribe and share it in other trading forums.
✅ Follow me for future ideas, trade setups, and updates on this analysis
✅ Don't hesitate to share your ideas, comments, opinions, and questions.
Take care and trade well
-Vik
____________________________________________________
📌 DISCLAIMER
The content of this analysis is subject to change at any time without notice and is provided for the sole purpose of education only.
Not financial advice or signal. Please make your own independent investment decisions.
____________________________________________________

$GBPJPY Can Go Much Higher #GBPJPYTraders and Investors,
GBPUSD fell to multi-decade lows last year and since then it has been consistently rising up. Whilst GBPUSD itself was not moving that sharply up, other pairs such as GBPJPY showed much higher strength. GBPJPY last week/month crossed an important barrier. If this trend line and this correct resistance level are broken and confirmed, GBPJPY can rise much higher into FCP zones as marked on the chart to complete potential W patterns.
Please note that this is a Weekly/Month time frame so it can take months with a lot of ups and downs.
Please support this analysis by liking and sharing. 👍🙂
Rules:
1. Never trade too much
2. Never trade without a confirmation
3. Never rely on signals, do your own analysis and research too
✅ If you found this idea useful, hit the like button, subscribe and share it in other trading forums.
✅ Follow me for future ideas, trade setups, and updates on this analysis
✅ Don't hesitate to share your ideas, comments, opinions, and questions.
Take care and trade well
-Vik
____________________________________________________
📌 DISCLAIMER
The content of this analysis is subject to change at any time without notice and is provided for the sole purpose of education only.
Not financial advice or signal. Please make your own independent investment decisions.
____________________________________________________

BTCUSDT ZIGZAG heading to 19600USDTBTCUSDT entered in a downtrend on a corrective intermediate Zig-Zag pattern, in which minor wave-(A) is potentially aiming the greater demand @ 19600. A swing trading plan can be made easily based on supply and demand theory, avoiding to trade in the grey sectors, so-called equilibrium zone.
