Simple forecasting with Fibonacci. What to do?I have plotted the monthly, and weekly and also zoomed in on the daily time frame to get a better view of it. The zone marked are zones that CLUSTERS the daily fibo together with weekly and monthly. There are 4 things to do before you place a trade on it.
1) Wait and let the market touch or come inside the marked zone
2) Wait
3) A bullish candle needs to close above the marked zone
4) Wait for a pullback which I prefer or you can instantly enter the market.
If there is no bullish candle that closes above the zone and continues breaking the zone, expect it to go lower. Don't guess, follow what the market tells you to do.
You can swing this trade all the way to 2026.
Fibonacci Confluence

EURUSD ready to continue doenWe have a Fibonacci retracement and Confluence zone setup on EURUSD ...can the trend going down or it will be a change of the direction?

$DOWI #US30 Watch This Level For A Possible BounceTraders and Investors,
With the dollar strength the indices have been taking a beating. US30, US500 and US100 have been following the same pattern but the leading one is still Dow Jones (US30).
So far:
1. It has crossed the 200 sma on the weekly timeframe so a bounce/retest is expected at some point.
2. There is an FCP zone coming around round number 29000 which can act as support
3. An extended M FCP pattern is forming and will complete around the FCP zone.
So watch this area closely to find a confirmation to go long for a bounce.
Please support this analysis by liking and sharing. 👍🙂
Rules:
1. Never trade too much
2. Never trade without a confirmation
3. Never rely on signals, do your own analysis and research too
✅ If you found this idea useful, hit the like button, subscribe and share it in other trading forums.
✅ Follow me for future ideas, trade set ups and the updates of this analysis
✅ Don't hesitate to share your ideas, comments, opinions and questions.
Take care and trade well
-Vik
____________________________________________________
📌 DISCLAIMER
The content on this analysis is subject to change at any time without notice, and is provided for the sole purpose of education only.
Not a financial advice or signal. Please make your own independent investment decisions.
____________________________________________________

$XAUUSD #Gold Can Be Bullish Next MonthTraders and investors,
Gold has been falling for straight 6 months. Now that on the monthly time frame XAUUSD has broken the mid point of potential M pattern, it can try to retest. However it all depends on how it closes this week and month. So watch it closely.
Please support this analysis by liking and sharing. 👍🙂
Rules:
1. Never trade too much
2. Never trade without a confirmation
3. Never rely on signals, do your own analysis and research too
✅ If you found this idea useful, hit the like button, subscribe and share it in other trading forums.
✅ Follow me for future ideas, trade set ups and the updates of this analysis
✅ Don't hesitate to share your ideas, comments, opinions and questions.
Take care and trade well
-Vik
____________________________________________________
📌 DISCLAIMER
The content on this analysis is subject to change at any time without notice, and is provided for the sole purpose of education only.
Not a financial advice or signal. Please make your own independent investment decisions.
____________________________________________________

$SPY #SPX Watch This Level For A Possible BounceTraders and Investors,
With the dollar strength the indices have been taking a beating. US30, US500 and US100 have been following the same pattern but the leading one is still Dow Jones (US30).
On the SnP500 so far:
1. It has NOT touched/crossed the 200 sma on the weekly timeframe so a test and then a bounce is expected at some point.
2. There is an FCP zone coming around round number 3550 which can act as support
3. An extended M FCP pattern is forming and will complete around the FCP zone.
So watch this area closely to find a confirmation to go long for a bounce.
Please support this analysis by liking and sharing. 👍🙂
Rules:
1. Never trade too much
2. Never trade without a confirmation
3. Never rely on signals, do your own analysis and research too
✅ If you found this idea useful, hit the like button, subscribe and share it in other trading forums.
✅ Follow me for future ideas, trade set ups and the updates of this analysis
✅ Don't hesitate to share your ideas, comments, opinions and questions.
Take care and trade well
-Vik
____________________________________________________
📌 DISCLAIMER
The content on this analysis is subject to change at any time without notice, and is provided for the sole purpose of education only.
Not a financial advice or signal. Please make your own independent investment decisions.
____________________________________________________

Complete Dollar (DXY) Top Down Analysis =Where Is It Headed Now?Traders and Investors,
Dollar has been on a run again and it is moving towards our multi year target of 113 which we predicted nearly 2 years ago. Although it completed a W pattern and was inside an FCP zone, it did not have a substantial correction. On smaller time frames, it showed a little retaracement but that was not enough. The strength in dollar is taking it to our next multi year target of 113 zone. This zone again will have potential to push the price down or at least sow it a bit. After that we will have 116 as a new intermediate resistance followed by 127 zone.
In this DXY (Dollar) technical analysis we will study few scenarios which can help in understanding what is about to come next few days/weeks.
Please support this analysis by liking and sharing. 👍🙂
Rules:
1. Never trade too much
2. Never trade without a confirmation
3. Never rely on signals, do your own analysis and research too
✅ If you found this idea useful, hit the like button, subscribe and share it in other trading forums.
✅ Follow me for future ideas, trade set ups and the updates of this analysis
✅ Don't hesitate to share your ideas, comments, opinions and questions.
Take care and trade well
-Vik
____________________________________________________
📌 DISCLAIMER
The content on this analysis is subject to change at any time without notice, and is provided for the sole purpose of education only.
Not a financial advice or signal. Please make your own independent investment decisions.
____________________________________________________

#US10Y #Bonds Can Fall From This FCP ZoneTraders & Investors, US 10 Year Bonds have been on the rise. After a minor correction they rose higher but now they could be approaching an FCP zone which can act as a resistance. We also have Relative Strength Index divergence setting up on weekly time frame.
Out this on your watch list as this can impact stock market, indices and other asset classes due to money flow from this asset class.
Rules:
1. Never trade too much
2. Never trade without a confirmation
3. Never rely on signals, do your own analysis and research too
✅ If you found this idea useful, hit the like button, subscribe and share it in other trading forums.
✅ Follow me for future ideas, trade set ups and the updates of this analysis
✅ Don't hesitate to share your ideas, comments, opinions and questions.
Take care and trade well
-Vik
____________________________________________________
📌 DISCLAIMER
The content on this analysis is subject to change at any time without notice, and is provided for the sole purpose of education only.
Not a financial advice or signal. Please make your own independent investment decisions.
____________________________________________________

Crab Harmonic and Head and ShouldersA bearish Crab Harmonic and a Head and Shoulders. These are actuallythe most reliable chart patterns playing out. Some swing traders seriously considering a double top from Alt-Time-High but before this we have an imponent H&S that became valid from the fulfillment of your pullback to the neckline and really more reliable. So, I'm targeting a reliable level at 14.6% of the Fibonacci retracement. As we can see on this daily chart I'm adding a confluent projection from the prior bearish CRAB Harmonic. This extension of Fibonacci ratio is in fact 1.278 wich is the square root of 1.618 from a AB=CD pattern.

$USDJPY Could Be Reaching The Final Bullish TargetTraders, USDJPY has been extremely bullish for last few months and this Forex pair is the one giving most of the strength to DXY (Dollar Index). Now USDJPY could be reaching an FCP zone along with a multi year cross trend line. This can give us the final target for our bullish trades and may also give us good opportunity for short trades depending on a good confirmation at least on the daily time frame.
Rules:
1. Never trade too much
2. Never trade without a confirmation
3. Never rely on signals, do your own analysis and research too
✅ If you found this idea useful, hit the like button, subscribe and share it in other trading forums.
✅ Follow me for future ideas, trade set ups and the updates of this analysis
✅ Don't hesitate to share your ideas, comments, opinions and questions.
Take care and trade well
-Vik
____________________________________________________
📌 DISCLAIMER
The content on this analysis is subject to change at any time without notice, and is provided for the sole purpose of education only.
Not a financial advice or signal. Please make your own independent investment decisions.
____________________________________________________


$WTI $USOIL Can Rise #crudeoilTraders, Intraday USOIL (WTI) has been slipping but the structure has been broker to the upside on the smaller timesframes. There is a very good confluence zone coming up soon on Crude Oil which can be a great place for long entry if the confirmation arrives. This can be a little risky trade so manage the risk. The target ultimately is the unfilled gap which left there days ago.
Rules:
1. Never trade too much
2. Never trade without a confirmation
3. Never rely on signals, do your own analysis and research too
✅ If you found this idea useful, hit the like button, subscribe and share it in other trading forums.
✅ Follow me for future ideas, trade set ups and the updates of this analysis
✅ Don't hesitate to share your ideas, comments, opinions and questions.
Take care and trade well
-Vik
____________________________________________________
📌 DISCLAIMER
The content on this analysis is subject to change at any time without notice, and is provided for the sole purpose of education only.
Not a financial advice or signal. Please make your own independent investment decisions.
____________________________________________________

$VIX Is In The Zone, Can Take A CorrectionTraders, $VIX Is In The Zone, Can Take A Correction. Watch $DXY too with it. If these 2 fall, we are looking at some relief in indices (Dow Jones, SnP500 and NASDAQ)
Rules:
1. Never trade too much
2. Never trade without a confirmation
3. Never rely on signals, do your own analysis and research too
✅ If you found this idea useful, hit the like button, subscribe and share it in other trading forums.
✅ Follow me for future ideas, trade set ups and the updates of this analysis
✅ Don't hesitate to share your ideas, comments, opinions and questions.
Take care and trade well
-Vik
____________________________________________________
📌 DISCLAIMER
The content on this analysis is subject to change at any time without notice, and is provided for the sole purpose of education only.
Not a financial advice or signal. Please make your own independent investment decisions.
____________________________________________________

👻 $DXY $BTC Divergence [What's up with $EURX and $CRO?]Usually when $DXY tanks, $BTC and other investment assets rise, but today is again diverging from the norm (2 or 3 time in the past days). What explains it? Perhaps the fact that $EUR is 🔺 up? A rebalancing of the currency books, perhaps? Or we're setting up for a fake out in during US open. Where are my currency experts at?
The market seems to expect more dovish announcements during the upcoming Jacksonhole FED event; my take based on Chair Powell's speech in June is that we could indeed expect rather a 100bp hike (very hawkish) or at least 75bp, again like last time. The doves are hoping for a 50bp hike. If we get 50bp, does it feel like the market will be ready for a rally?
I stopped out of the majority of my $cro short around .13. Looking to add more back in some more if we dump through the .1285 - .13 range and retrace back to these levels.
I expect 20750 to be an important stopping point for BTC and opportunity for quick long scalp for a few points if the dumpiness continues during the EU trading session, as I would expect the US brinks to put a little long pressure on before it shows it's true intention for the day to either continue the $dxy dump and move into longing other asset prices, or to reverse and really dump the markets at market open.
Summary, SHORT.
My analysis still isn't solid and clear; but i'm hoping you're following along and interested anyway. Comments, suggestions, questions welcome! GL out there!

#BANKNIFTY Can Rise From The FCP Zone Traders,
BANKNIFTY Can Rise Intraday. We have an FCP zone and an unfilled gap. So watch out for this intraday opportunity. NIFTY
Rules:
1. Never trade too much
2. Never trade without a confirmation
3. Never rely on signals, do your own analysis and research too
✅ If you found this idea useful, hit the like button, subscribe and share it in other trading forums.
✅ Follow me for future ideas, trade set ups and the updates of this analysis
✅ Don't hesitate to share your ideas, comments, opinions and questions.
Take care and trade well
-Vik
____________________________________________________
📌 DISCLAIMER
The content on this analysis is subject to change at any time without notice, and is provided for the sole purpose of education only.
Not a financial advice or signal. Please make your own independent investment decisions.
____________________________________________________

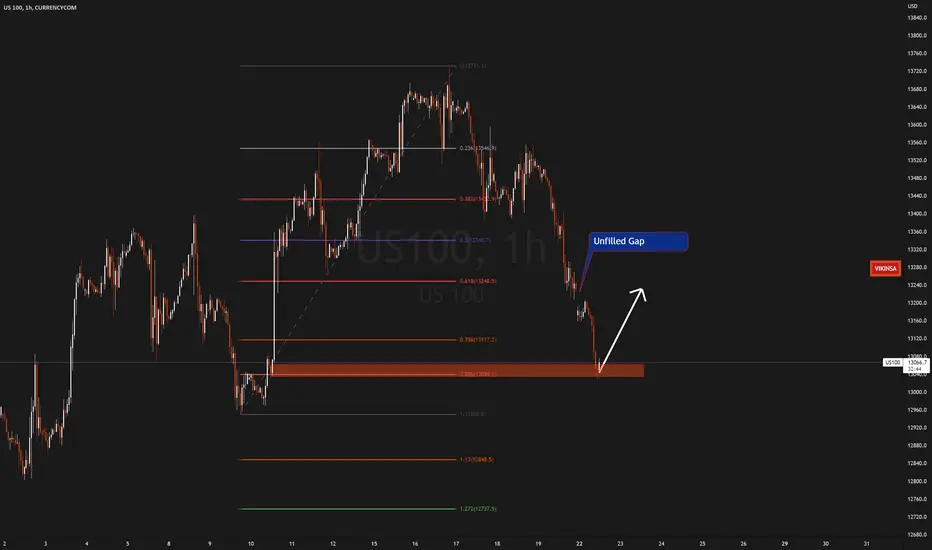
NASDAQ ($NAS100) US100 Can Rise IntradayTraders,
NASDAQ ($NAS100) US100 Can Rise Intraday. We have an M pattern, a demand zone and an unfilled gap. So watch out for this intraday opportunity.
Rules:
1. Never trade too much
2. Never trade without a confirmation
3. Never rely on signals, do your own analysis and research too
✅ If you found this idea useful, hit the like button, subscribe and share it in other trading forums.
✅ Follow me for future ideas, trade set ups and the updates of this analysis
✅ Don't hesitate to share your ideas, comments, opinions and questions.
Take care and trade well
-Vik
____________________________________________________
📌 DISCLAIMER
The content on this analysis is subject to change at any time without notice, and is provided for the sole purpose of education only.
Not a financial advice or signal. Please make your own independent investment decisions.
____________________________________________________
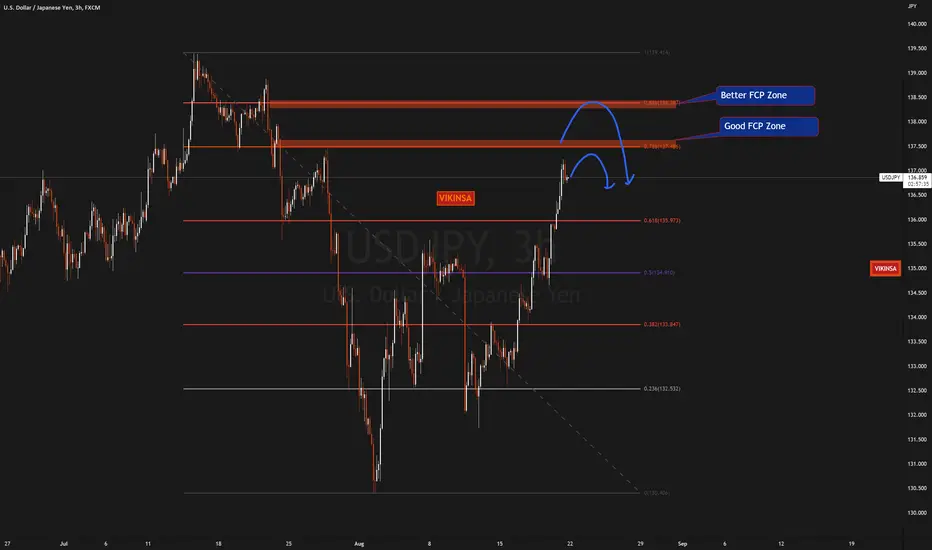
$USDJPY - 2 Important Zones AheadTraders, USDJOY has been very bullish over months and now it is truing to go back to the previous highs. In the process it is creating a FCP Pattern which can push the price down at least for a correction. These are the 2 zones that we should be watching for trading opportunities.
Rules:
1. Never trade too much
2. Never trade without a confirmation
3. Never rely on signals, do your own analysis and research too
✅ If you found this idea useful, hit the like button, subscribe and share it in other trading forums.
✅ Follow me for future ideas, trade set ups and the updates of this analysis
✅ Don't hesitate to share your ideas, comments, opinions and questions.
Take care and trade well
-Vik
____________________________________________________
📌 DISCLAIMER
The content on this analysis is subject to change at any time without notice, and is provided for the sole purpose of education only.
Not a financial advice or signal. Please make your own independent investment decisions.
____________________________________________________
⁉️ How to use Fibonacci Retracement?‼️ Forex traders use Fibonacci retracements to pinpoint where to place orders for market entry, taking profits and stop-loss orders. Fibonacci levels are commonly used in forex trading to identify and trade off support and resistance levels. After a significant price movement up or down, the new support and resistance levels are often at or near these trend lines . Usually the price retracts to 50% or untile OTE (0.62, 0.705, 0.79) before another impulse movement occurs.

$APPL Can Fall Now - W Pattern CompletedTraders and Investors, Apple Inc ($APPL) has completed a W pattern which can push the price down. It also has reached an areas of resistance so we can can expect a move down. The downward arrows show the possible bearish targets. However, if the apple stok breaks above the starting point of the W pattern and crosses the limit, then we should look for further bullish targets into 200s.
Manage the risk and make sure that you are watching stock movement closely along with US30 (Dow Jones)
Rules:
1. Never trade too much
2. Never trade without a confirmation
3. Never rely on signals, do your own analysis and research too
✅ If you found this idea useful, hit the like button, subscribe and share it in other trading forums.
✅ Follow me for future ideas, trade set ups and the updates of this analysis
✅ Don't hesitate to share your ideas, comments, opinions and questions.
Take care and trade well
-Vik
____________________________________________________
📌 DISCLAIMER
The content on this analysis is subject to change at any time without notice, and is provided for the sole purpose of education only.
Not a financial advice or signal. Please make your own independent investment decisions.
____________________________________________________

GBPUSD Can Rise As M Pattern Has CompletedTraders, GBPUSD can rise as an FCP M pattern has been completed. However this may not be able to push the price too high as the DXY is still rising and strong. So if you are looking for a smaller bounce then look for a confirmation on this GBPUSD pair and take the entry.
On the chart there are 2 arrows which point at the approximate profit targets. Take one step at a time and manage the risk.
Rules:
1. Never trade too much
2. Never trade without a confirmation
3. Never rely on signals, do your own analysis and research too
✅ If you found this idea useful, hit the like button, subscribe and share it in other trading forums.
✅ Follow me for future ideas, trade set ups and the updates of this analysis
✅ Don't hesitate to share your ideas, comments, opinions and questions.
Take care and trade well
-Vik
____________________________________________________
📌 DISCLAIMER
The content on this analysis is subject to change at any time without notice, and is provided for the sole purpose of education only.
Not a financial advice or signal. Please make your own independent investment decisions.
____________________________________________________

Important price points for TASI 1214 Shaker Weekly ContinuedShaker TADAWUL:1214 continued to rise after spotted RSI divergence.
Price has crossed resistance points 21.12 and 21.54 and now trying to reach 3rd point at 22.86 which intersects with the lower trend and resistance point at RSI.
In case of breakout the following are potential targets 24.74 channel point and 27.12 point of triangle breakout
supporting points are previous resistance points 21.54 then 21.12

Possible Divergence for TASI 1214 Shaker WeeklyTASI TADAWUL:1214 1214 Shaker
target reached for 1st bearish flag. possible 2nd bearish flag target and/or divergence for long term
Logarithmic and Fibonacci Multiples and possible RSI divergence as indicated on the chart
with possible targets

$BABA Is Alibaba Ready To Be Treasured In Our Portfolios?Traders, Speaking to my of my investor friend in the US around a year ago, I predicted alibaba to fall below 100 and that's when we could get a chance to buy back again. Alibaba $BABA Has been consolidating at the current levels for few months under 100 dollars. Now as it has created a very good pattern inside the bollinger band, this can become a speculative buy in our portfolio again. The risk is limited i.e. stop loss will be below last lowest low and the target much higher giving us very good Reward to Risk.

$ZM Is It About To Zoom Again?Traders, Zoom has fallen from its glory and created exact same structure as that of stock bubble. Now that it has reached its actual mean and is also creating an M pattern, it looks like a BUY. However it will be a speculative buy and we must keep an eye on the Indices as well along its price action.
On the other technical size, we have Bollinger bands squeezing which means a breakout is imminent.
Keep the risk management tight.
