ERIC | Communication Equipment Provider on the Rise | LONGTelefonaktiebolaget LM Ericsson engages in the provision of telecommunications equipment and related services to mobile and fixed network operators. It operates through the following segments: Networks, Cloud Software, Services, Enterprise, and Other. The Networks segment supports all radio-access technologies and offers hardware, software and related services for both radio access and transport. The Cloud Software segment offers solutions for core networks, business and operational support systems, network design and optimization, and managed network services. The Other segment refers to the media business and other non-allocated business. Segment-level information has also been presented to Other. The company was founded by Lars Magnus Ericsson in 1876 and is headquartered in Kista, Sweden.
Fibonacci Extension

PLUS | AI Related Software Apps Will Rise | LONGePlus, Inc. engages in the provision of information technology (IT) solutions that enable organizations to optimize their IT environment and supply chain processes in the United States. It operates through the Technology and Financing segments. The Technology segment offers hardware, perpetual and subscription software, maintenance, software assurance, and internally provides outsourced services and advanced professional and managed services, including ePlus managed, professional, security, staff augmentation, server and desktop support, and project management services. The Financing segment specializes in arrangements, such as direct financing, sales-type, and operating leases, loans and consumption-based financing arrangements, and underwriting and management of IT equipment and assets. Its financing operations consist of sales, pricing, credit, contracts, accounting, risk management, and asset management. This segment primarily finances IT equipment, communication-related equipment, medical equipment, industrial machinery equipment, office furniture and general office equipment, transportation equipment, and other general business equipment directly, as well as through vendors. The company was founded by Bruce M. Bowen in 1990 and is headquartered in Herndon, VA.

APP | New ALL TIME HIGHS Incoming | LONGAppLovin Corp. engages in the development and operation of a mobile marketing platform. It offers AppDiscovery, MAX, Adjust, and SparkLabs. Its software-based platform caters to mobile application developers to improve the marketing and monetization of applications. The company was founded by Andrew Karam, John Krystynak, and Adam Foroughi in 2011 and is headquartered in Palo Alto, CA.t represents results from other non-reportable segments and corporate-related charges. The company was founded by Robert Norton Noyce and Gordon Earle Moore on July 18, 1968 and is headquartered in Santa Clara, CA.

INTC | Intel is Going To Pop In The Future | LONGIntel Corp. engages in the design, manufacture, and sale of computer products and technologies. It delivers computer, networking, data storage, and communications platforms. The firm operates through the following segments: Client Computing Group (CCG), Data Center and AI (DCAI), Network and Edge (NEX), Mobileye, Accelerated Computing Systems and Graphics (AXG), Intel Foundry Services (IFS), and All Other. The CCG segment consists of platforms designed for notebooks, 2-in-1 systems, desktops, tablets, phones, wireless and wired connectivity products, and mobile communication components. The DCAI segment delivers solutions to cloud service providers and enterprise customers, along with silicon devices for communications service providers and high-performance computing customers. The NEX segment offers computing system solutions from inflexible fixed-function hardware to general-purpose compute, acceleration, and networking devices running cloud native software on programmable hardware. The Mobileye segment develops driving assistance and self-driving solutions. The AXG segment provides products and technologies designed to help customers solve the toughest computational problems. Its products include CPUs for high-performance computing and GPUs targeted for a range of workloads and platforms, from gaming and content creation on client devices to delivering media and gaming in the cloud, and the most demanding high-performance computing and AI workloads on supercomputers. The IFS segment refers to full stack solutions created from the foundry industry ecosystem. The All Other segment represents results from other non-reportable segments and corporate-related charges. The company was founded by Robert Norton Noyce and Gordon Earle Moore on July 18, 1968 and is headquartered in Santa Clara, CA.

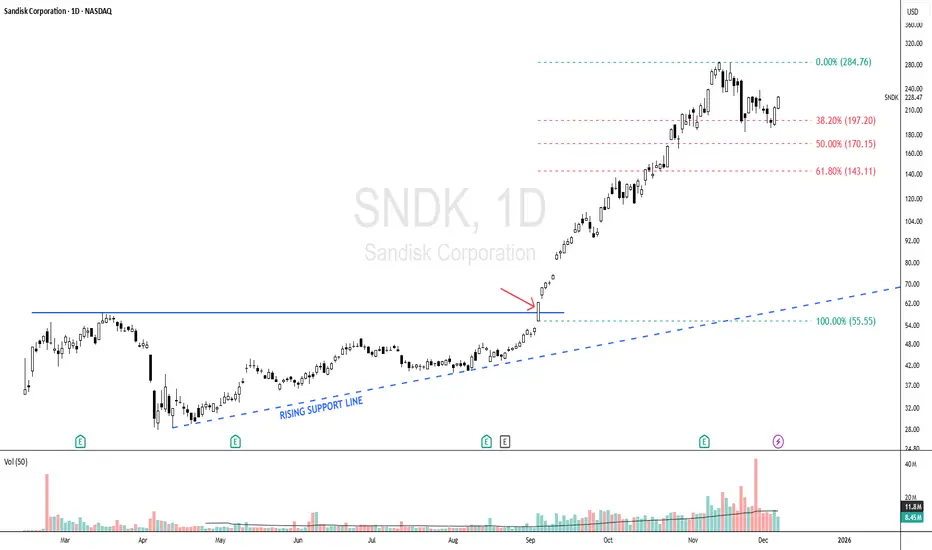
SNDK - Bullish Scenario Since 04 Sept, Momentum Still Intact!SNDK - CURRENT PRICE : 228.47
🔥 Bullish Scenario Supported by Trend Structure & Fibonacci Reactions
SNDK began showing early signs of a bullish scenario when price respected a rising support line , indicating steady accumulation and higher lows forming. The major bullish confirmation occurred on 04 September , when price broke above the 55.55 level (look at red arrow), triggering strong momentum and leading to a rapid vertical rally. As with many fast-moving stocks, a healthy retracement followed, and SNDK pulled back precisely toward the Fibonacci 38.2% golden ratio, where the stock found support and began forming a new base. This behavior suggests the prior uptrend remains intact, and the uptrend may resume as long as the stock continues to hold above this retracement zone.
Some Elliott Wave practitioners may also interpret the current structure as a developing Wave 5, suggesting the potential for another upside leg if the trend continues to follow impulsive wave behavior.
Take note that I'm using logarithmic scale chart because the share price has already risen more than 300% since the 04 September breakout, making it more suitable for analyzing large percentage moves and trend structure.
ENTRY PRICE : 228.47
FIRST TARGET : 270.00
SECOND TARGET : 324.00 (Projected based on Fibonacci extension)
SUPPORT : 183.00 (The low of 21 Nov HAMMER candle)
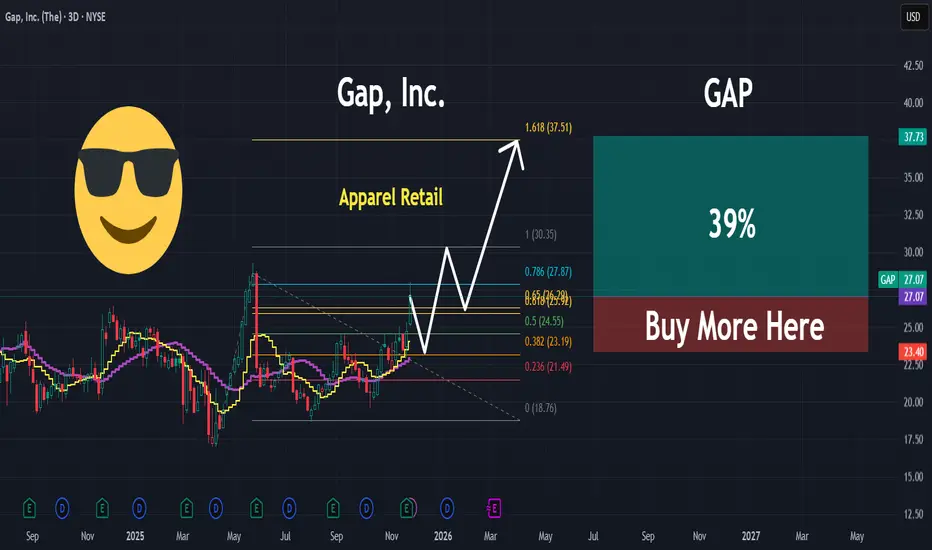
GAP | This Retailer Has Potential | LONGGap, Inc. operates as a global apparel retail company, which offers clothing, apparel, accessories, and personal care products for men, women, and children. The firm operates through the following segments: Gap Global, Old Navy Global, Banana Republic Global, Athleta, and Other. The Gap Global segment includes apparel and accessories for men and women under the Gap brand, along with the GapKids, BabyGap, GapMaternity, GapBody, and GapFit collections. The Old Navy Global segment offers clothing and accessories for adults and children. The Banana Republic Global segment provides clothing, eyewear, jewelry, shoes, handbags, and fragrances. The Athleta segment offers fitness apparel for women. The company founded by Donald G. Fisher and Doris F. Fisher in July 1969 and is headquartered in San Francisco, CA.
USB | This Regional Bank May POP Higher ! | LONGU.S. Bancorp operates as a bank holding company, which offers financial services including lending and depository services, cash management, foreign exchange and trust and investment management. The firm also offers mortgage, refinance, auto, boat and RV loans, credit lines, credit card services, merchant, bank, checking and savings accounts, debit cards, online and mobile banking, ATM processing, mortgage banking, insurance, brokerage and leasing services. The company was founded on April 2, 1929, and is headquartered in Minneapolis, MN.

PEP | Bullish Move Incoming for Pepsico| LONGPepsiCo, Inc. engages in the manufacture, marketing, distribution, and sale of beverages, food, and snacks. It operates through the following business segments: Frito-Lay North America (FLNA), Quaker Foods North America (QFNA), PepsiCo Beverages North America (PBNA), Latin America (LatAm), Europe, Africa, Middle East, and South Asia (AMESA), and Asia Pacific, Australia and New Zealand, and China Region (APAC). The FLNA segment consists of branded convenient food businesses in the United States and Canada. The QFNA segment includes cereals, rice, and pasta under the Quaker, Pearl Milling Company, Quaker Chewy, Cap'n Crunch, Life, and Rice-A-Roni brands. The PBNA segment is composed of beverage concentrates, fountain syrups, and finished goods under various beverage brands such as Pepsi, Gatorade, Mountain Dew, Diet Pepsi, Aquafina, Diet Mountain Dew, Sierra Mist, and Mug. The LatAm segment covers beverage, food, and snack businesses in the Latin American region. The Europe segment offers beverage, food, and snack goods in Europe and Sub-Saharan Africa regions. The AMESA segment deals with all beverage and convenient food businesses in Africa, the Middle East, and South Asia. The APAC segment refers to all business operations in the Asia Pacific, Australia and New Zealand, and China region. The company was founded by Donald M. Kendall, Sr. and Herman W. Lay in 1965 and is headquartered in Purchase, NY.

ANFIBO XAUUSD – Fibonacci Breakout and Continuation Plan
Hi guys, Anfibo’s here!
XAUUSD Weekly Trading Plan
Overall Picture
On the 4H chart, gold has broken out of the previous descending trendline and is now trending inside a rising bullish channel. Price is pushing toward the upper boundary of this channel, and the next key reaction zone is where:
The new uptrend channel resistance
The old descending trendline (now potential resistance)
And the Fibonacci extension cluster
all line up around the 4240s.
This is where I expect the market to show its hand:
Either give a short-term corrective pullback,
Or consolidate and build energy for a continuation rally toward the higher Fibonacci extensions (2.618 around the 4370–4380 zone).
Macro Context – Why USD Still Matters
From a macro perspective, the U.S. Government and Treasury have a direct impact on the U.S. Dollar Index (DXY) through:
Fiscal policy (budgets, new laws, spending programs)
Announcements from the administration
Treasury funding needs and issuance
At the same time, U.S. GDP data is a core driver of dollar sentiment:
Stronger‐than‐expected GDP → supports DXY → often weighs on gold.
Weaker GDP or slowdown signals → pressures DXY → tends to support gold.
So while the chart is clearly giving us a bullish technical structure, the strength or weakness of upcoming U.S. data will strongly influence whether gold can sustain a breakout beyond these Fibonacci levels or get capped and pull back deeper.
Trading Plan – Using Fibonacci and Structure
For next week, I’m working with one tactical short setup at resistance and one continuation buy setup on the dip.
>>> Scenario #1 – Short-Term SELL at Fibonacci Resistance
If price extends into the confluence zone around 4240+ and shows rejection, I’ll treat it as a counter-trend sell opportunity:
Sell entry: 4241 – 4243
Stop loss: 4248
Take profit levels:4210-4194-4165-4120
Idea: fade the first touch into the Fibonacci + trendline resistance box, targeting a corrective leg back towards mid-channel support and potentially the lower part of the structure around 4120 if sellers step in aggressively.
>>> Scenario #2 – BUY the Continuation from 4194 Support
If the market respects the breakout and only offers a shallow pullback, I’ll look to join the trend from the key support / Fibonacci area:
Buy entry: around 4194
Stop loss: 4185
Take profit levels:
TP1: 4210
TP2: 4235
TP3: higher extension zone toward the 2.618 area (4370+ if momentum continues)
Idea: use 4194 as a continuation buy zone, where broken resistance + Fib support align, aiming to ride the next impulsive leg higher inside the ascending channel.
Key Technical Levels for the Week
Resistance / Sell zone: 4241 – 4243
Intermediate resistance: 4235, then higher at the Fib extension band near 4370–4380
Support / Buy zone: 4194
Deeper supports: 4165 and 4120 (bottom of corrective structure)
As long as price holds above the 4165–4120 block on a closing basis, the medium-term bias remains bullish.
Risk Management
Treat the sell setup as tactical / short-term against higher timeframe bullish structure.
Always wait for clear confirmation (rejection wick, slowdown, or shift in 4H / 1H structure) at 4240s before entering shorts.
Keep Risk:Reward ≥ 1:2 on both scenarios; avoid forcing trades in the middle of the range.
Do not hold opposing positions simultaneously – follow the scenario the market confirms first.
If strong fundamentals (e.g., very strong GDP, hawkish fiscal tone) push DXY sharply higher or lower, be ready to reassess the bias instead of clinging to the plan.
Conclusion
Gold has flipped from a descending structure to a rising channel, and Fibonacci confluences are giving us clear, objective levels to work with next week. Whether price reacts with a short-term pullback from 4240s or respects 4194 as continuation support, we already know:
Where to sell tactically,
Where to buy with the trend,
And how our risk is defined.
LET THE LEVELS GUIDE YOU, TRADE WITH CONFIDENCE, AND STAY DISCIPLINED, GUYS! 💛📈

ZM | Price Will ZOOM Higher | LONGZoom Communications, Inc. engages in the provision of a communications and collaboration platform. It operates through the following geographical segments: Americas, Asia Pacific, and Europe, Middle East, and Africa. The company was founded by Eric S. Yuan in 2011 and is headquartered in San Jose, CA.

Google at record highs but Wave 3 cluster/RSI screams pullback!Alphabet is leading the Magnificent Seven, hitting record highs near $330, while most AI and growth stocks, including Nvidia, have stalled. Since launching Gemini 3 in mid-November and with news of a $4.9 billion Berkshire stake, Alphabet has rallied more than 135% off its April low, outperforming all Big Tech peers in 2025.
But Alphabet is at the 161.8% Fibonacci extension of its long-term move and long-to-medium-term move, which matches a textbook Elliott Wave 3 cluster completion. RSI is at an extreme 83 on the weekly, hinting a Wave 4 pullback to $288 could be next, even as the macro backdrop (Gemini 3 AI buzz, Fed rate cut hopes, and demand for Google’s AI chips from Meta) stays strong. Ultimately, a final Wave 5 could extend up to $380-$400.
Key drivers:
Gemini 3 launch positions Alphabet as an AI leader, topping major multimodal benchmarks.
$4.9B Berkshire stake signals major institutional confidence.
Meta seeks Google’s TPU chips, boosting Alphabet’s AI hardware story while pressuring Nvidia.
Fed rate cut odds above 80% further support growth stocks.
Elliott Wave/technical structure aligns with a potential $288 pullback before any push to $380.
Will Alphabet finally pause after eight explosive months, or does the rally have further to run?
Let us know your view and Elliott Wave count in the comments, and follow for more big-picture, technical-plus-macro trade ideas!
This content is not directed to residents of the EU or UK. Any opinions, news, research, analyses, prices or other information contained on this website is provided as general market commentary and does not constitute investment advice. ThinkMarkets will not accept liability for any loss or damage including, without limitation, to any loss of profit which may arise directly or indirectly from use of or reliance on such information.

AG | Silver Miners Will Rise | LONGFirst Majestic Silver Corp. engages in the production, development, exploration and acquisition of mineral properties. It owns and operates producing mines in Mexico including the La Encantada Silver Mine, La Parrilla Silver Mine, San Martin Silver Mine, La Guitarra Silver Mine, Del Toro Silver Mine, Santa Elena Silver & Gold Mine, and San Dimas Silver & Gold Mine. The company was founded by Keith Neumeyer on September 26, 1979 and is headquartered in Vancouver, Canada.

SLV | Next Leg Higher Is Here | LONGiShares Silver Trust seeks to reflect generally the performance of the price of silver. The Trust seeks to reflect such performance before payment of the Trust's expenses and liabilities. It is not actively managed. The Trust does not engage in any activities designed to obtain a profit from, or to ameliorate losses caused by, changes in the price of silver.

GM | New All Time Highs Incoming Before the Drop | LONGGeneral Motors Co. engages in the designing, manufacturing, and selling of trucks, crossovers, cars, and automobile parts, and in providing software-enabled services and subscriptions. It operates through the following segments: GMNA, GMI, Cruise, and GM Financial. The company was founded by William C. Durant on September 16, 1908 and is headquartered in Detroit, MI.

FER | Highway and Freeway Construction will Rise | LONGFerrovial SE provides infrastructure construction and transportation services. It offers all kinds of services related to urban and interurban transport infrastructure, either by land, sea or air. The company was founded by Rafael del Pino y Moreno on December 18, 1952 and is headquartered Amsterdam, the Netherlands.

WYNN | This Casino Will Make Money As Gambling Rises | LONGWynn Resorts Ltd. is a holding company, which Wynn Resorts Ltd. is a holding company, which engages in the design, development, and operation of destination casino resorts. It operates through the following segments: Wynn Palace, Wynn Macau, Las Vegas Operations, Encore Boston Harbor, and Corporate and Other. The company was founded by Stephen Alan Wynn, Elaine P. Wynn, and Kazuo Okada in 2002 and is headquartered in Las Vegas, NV.engages in the design, development, and operation of destination casino resorts. It operates through the following segments: Wynn Palace, Wynn Macau, Las Vegas Operations, Encore Boston Harbor, and Corporate and Other. The company was founded by Stephen Alan Wynn, Elaine P. Wynn, and Kazuo Okada in 2002 and is headquartered in Las Vegas, NV.

AMGN | Healthcare STRONG | LONGAmgen, Inc. is a biotechnology company, which engages in the discovery, development, manufacture, and marketing of human therapeutics. The company was founded by William K. Bowes, Jr., Franklin Pitcher Johnson, Jr., George B. Rathmann, and Joseph Rubinfeld on April 8, 1980 and is headquartered in Thousand Oaks, CA.

PDD | Temu On The Rise | LONGPDD Holdings, Inc. is a multinational commerce group that owns and operates a portfolio of businesses. The company aims to bring more businesses and people into the digital economy so that local communities and small businesses can benefit from increased productivity and new opportunities. It has built a network of sourcing, logistics, and fulfillment capabilities, that support its underlying businesses. PDD Holdings was founded by Hua Lin Cai and Zheng Huang in 2015 and is headquartered in Dublin, Ireland.

CNX | Oil Is On The RISE | LONGCNX Resources Corp. is a premier independent low carbon intensity natural gas development, production, midstream, and technology company, which engages in the business of producing pipeline quality natural gas for sale primarily to gas wholesalers. It operates through the following segments: Shale, Coalbed Methane (CBM), and Other Gas. The Shale segment focuses on reserves, production, and capital investments. The CBM segment is involved in extracting CBM natural gas primarily from the Pocahontas No. 3 seam. The Other Gas segment includes nominal shallow oil and gas production. The company was founded in 1864 and is headquartered in Canonsburg, PA.

I would call this a Change of Character (CHoCH) for BTCI want to share with you that the 2 Day On Balance Volume (OBV) is now below its EMA(100).
The last time this happened was at ATH in November 2021.
Also the 2D OVB EMA(100) was spot on at the ATL in January 2023.
BTC has reached it's 6.618 Fibonacci of Wave 1 resulting in 698%.
Don't you think a correction would be in order?
And yet people are still talking about a coming bull run ;)))
I don't say this is the final top, even though it looks like it… one more high after a short correction could still be possible.
I'm just saying this is something to keep in mind » Already 7x, bullish OBV is finished AND … according to a simple sine wave (yellow) we are now in a down phase until around February - March 2026.
Let's see what happens.

MRVL - RSI Back Above 50, Eyes Fibonacci Targets at 99 and 112MRVL - CURRENT PRICE : 86.00 - 88.00
MRVL is showing early signs of bullish continuation after finding support near the 50-day EMA and rebounding with positive momentum. The price structure remains healthy as it trades above the EMA 50, suggesting the medium-term trend is still intact.
Key Technical Highlights :
1) Price Above EMA 50
The stock price is holding above the EMA 50, showing that the uptrend remains valid and buyers are still in control.
2) RSI Above 50 and Not Overbought
RSI has crossed back above the 50 level, confirming improving momentum while staying below overbought territory, leaving more room for upside.
3) MACD Structure
Although the MACD line is still below the signal line, both are positioned above the zero level, indicating the overall market tone remains positive with potential for a new bullish crossover.
Based on Fibonacci extension, potential upside targets are at :
1st Target: USD 99.00 (0.618 level)
2nd Target: USD 112.00 (1.000 level)
ENTRY PRICE : 86.00 - 89.00
FIRST TARGET : 99.00
SECOND TARGET : 112.00
SUPPORT : 80.50

RAIL | Railroads on the Rise | LONGFreightCar America, Inc. is engaged in the manufacturing of railcars and railcar components. It operates through the Manufacturing and Aftermarket segments. The Manufacturing segment includes new railcar manufacturing, used railcar sales, and railcar conversions and rebodies. The Aftermarket segment deals with the selling of forged, cast and fabricated railcar parts and supplies for all railcar types, and provides aftermarket services including safety training, railcar inspections, and preventative maintenance. The firm offers freight cars including box cars, covered hoppers, open top hoppers, gondolas, intermodal, and non-intermodal flat cars that transport dry bulk and containerized freight products. The company was founded in 1901 and is headquartered in Chicago, IL.

QS | Autopart Industries on the Rise | LONGQuantumScape Corp. engages in developing next-generation solid-state lithium-metal batteries. The company's next-generation batteries are designed to enable greater energy density, faster charging, and enhanced safety to support the transition away from legacy energy sources toward a lower-carbon future. The company was founded by Jagdeep Singh, Tim Holme, and Fritz B. Prinz in May 2010 and is headquartered in San Jose, CA.
