MRVL | Another Semi Run Coming | LONGMarvell Technology, Inc. engages in the design, development, and sale of integrated circuits. Its products include data processing units, security solutions, automotive, coherent DSP, DCI optical modules, ethernet controllers, ethernet PHYs, ethernet switches, linear driver, PAM DSP, transimpedance amplifiers, fibre channel, HDD, SSD controller, storage accelerators, ASIC, and Marvell government solutions. It operates through the following geographical segments: United States, Singapore, Israel, India, China, and Others. The company was founded by Wei Li Dai and Pantas Sutardja in 1995 and is headquartered in Wilmington, DE.
Fibonacci Extension

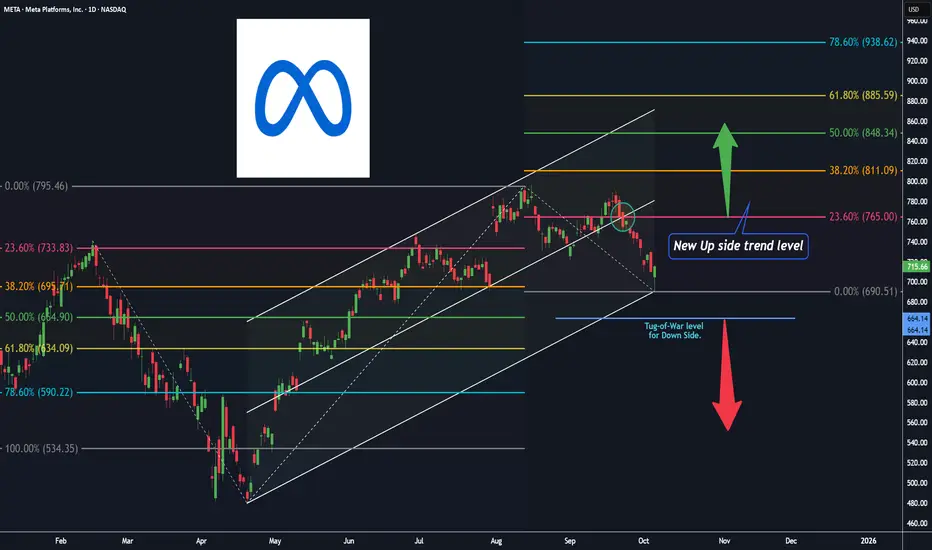
Meta platforms, D ( Channel + 2 Fibonacci Extensions up & down )Hey Traders and Investors, I hope you all are doing well in your life.
market is nature's response and Price is the God .
Let's check the market with the help of natural levels tool : Trend Based Fibonacci Extension in addition with Trend Channel .
After forming almost a ' Head and Shoulders ' pattern on Daily chart, Meta platforms has given a pull-back ( base for Fib-Extension UP level tool on the right side , $690.51 ).
The Pull-back trend expect to continue till the retest level of 23.6% ( $765 ) of Fib-Extension UP level tool on the right side .
The most near level for the re-test is the 50% level ( $664.14 ) of Fib-Extension Down level tool on the left side , for a new UP trend Entry ( investors ).
Note: The marked Circle ⭕ enclosed candle is the important level candle, Up Trend channel's 50% trend line is intersecting with 23.6% of Fib-Extension UP level tool on the right side .
Keep on checking this Level for your future trading decisions.
" Buy 🟢 "above $731 with the stop loss🔻of $690 for the
🎯 Target 1: $765
🎯 Target 2: $811
🎯 Target 3: open.
" Sell 🔴 " below $664 with the stop loss🔺of $690 for the
🎯 Target 1: $634
🎯 Target 2: $590
🎯 Target 3: open.
Smart Levels is Smart Trading 👨🎓
⚠ RISK DISCLAIMER :
All content provided by "TradeWithKeshhav" is for information & educational purposes only.
It does not constitute any financial advice or a solicitation to buy or sell any securities of any type. All investments / trading involve risks. Past performance does not guarantee future results / returns.
Always do your own analysis before taking any trade.
Regards :
Team @TradeWithKeshhav
Happy Trading and Investing!
Two-phase FOMC reaction on EURUSD explained: Where next?EURUSD experienced a classic "dovish-then-hawkish" whipsaw following the Fed's 25bp cut. The Initial dovish reaction saw the fibre surge above 1.19 to multi-year highs as the dot plot showed 50bp additional cuts vs expected 25bp in 2025. However, Powell's hawkish presser reversed gains within the hour, describing the cut as "risk management" rather than an aggressive easing cycle start.
EURSD is finding support at 1.1778 (previous high), with the price having taken out the 100% Fibonacci extension from August lows. Critical support sits at 1.1740, with a break below invalidating the bullish bias.
Bullish Scenario
Targets : 1.1830, 1.1866 (critical level), then 1.2000-1.2032
Triggers : Hold above 1.1778, break above 1.1866
Rationale : ECB-Fed divergence theme intact with ECB holding, while Fed cuts
Bearish Scenario (Potential Dead Cat Bounce)
Targets : 1.1750, 1.1730
Entry : Short at 61.8% Fibonacci retracement (~1.1832)
Stop : Above 1.1878
R:R Ratio : 3.38
Where next?
ECB pause vs Fed easing supports underlying bullish EUR/USD theme despite near-term volatility. But the next FOMC meetings are more critical as Powell emphasised a "meeting-by-meeting" approach. Current pullback is likely a retracement before a potential continuation higher, but watch for rejection at the weekly trendline resistance shy of 1.20.
This content is not directed to residents of the EU or UK. Any opinions, news, research, analyses, prices or other information contained on this website is provided as general market commentary and does not constitute investment advice. ThinkMarkets will not accept liability for any loss or damage including, without limitation, to any loss of profit which may arise directly or indirectly from use of or reliance on such information.

GBPUSD – Medium-Term H1/H4 Technical Outlook
Overview: GBPUSD has broken below its ascending channel after failing to hold gains around the 1.3530–1.3575 supply zone. Price is now testing the 0.618 retracement (~1.3366) with the RSI (5) at heavily oversold levels (~13–14), suggesting scope for a corrective bounce before the broader bearish bias continues.
For traders, the focus remains on selling into rallies while considering short-term buy opportunities at key liquidity zones.
Market Structure
Trendline Break: The uptrend line has been breached, turning the bias towards selling rallies.
Resistance/Supply: 1.3537 and 1.3453–1.3428.
Support/Demand: Initial levels at 1.3366 (Fib 0.618) and 1.3319; major demand between 1.3143–1.3093.
Momentum: Oversold conditions increase the probability of corrective upside moves before continuation lower.
Trading Scenarios
Sell the Rally – Primary Plan
Entry: 1.3500 – 1.3510
Stop Loss: 1.3550
Take Profit: 1.3480 – 1.3466 – 1.3445 – 1.3430
Rationale: Short opportunities on retests of broken structure. Bias only invalidated if price closes above 1.3550 on the 4H chart.
Buy the Dip – Intraday Scalps
Entry: 1.3310 – 1.3330
Stop Loss: 1.3290
Take Profit: 1.3355 – 1.3368 – 1.3390 – 1.3410
Rationale: Oversold conditions and demand at 1.3319 favour quick long scalps back into resistance.
Deeper Liquidity Sweep – Swing Buy
Entry: 1.3090 – 1.3110
Stop Loss: 1.3050
Take Profit: 1.3135 – 1.3160 – 1.3200 – 1.3240
Rationale: A sweep into the 1.3143–1.3093 demand zone could provide a stronger base for swing long positions.
Risk Management & Invalidation
A 4H close above 1.3550 invalidates the bearish scenario.
A strong break below 1.3310 suggests focusing on the deeper buy zone rather than scalping longs.
Stagger take-profit levels and move stops to breakeven once the first target is reached.

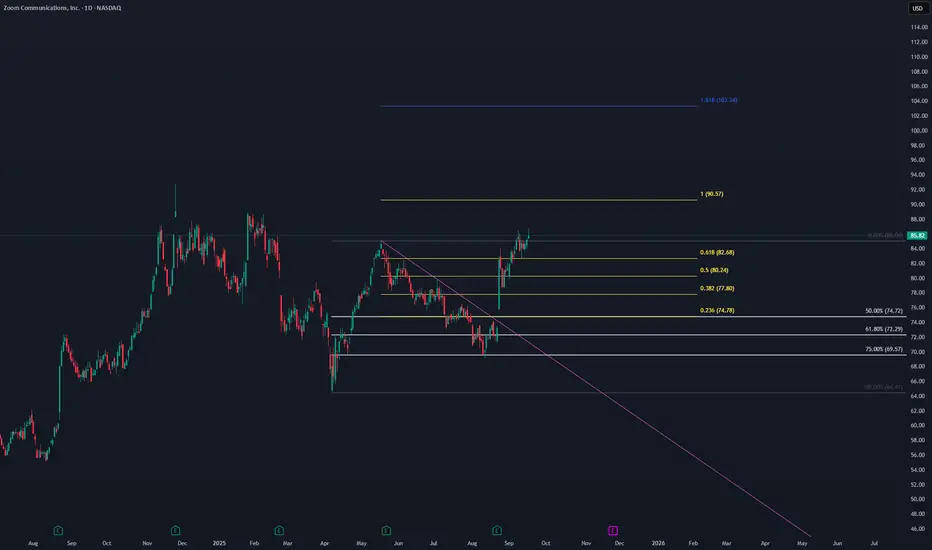
Zoom Update. Near ObjectiveLike previous analysis ZM is near to reach the objective.
FIB RETRACEMENT⮕PRICE RETRACEMENT⮕TRENDLINE CROSSING⮕FIB EXTENSION⮕TARGET THE OBJECTIVE
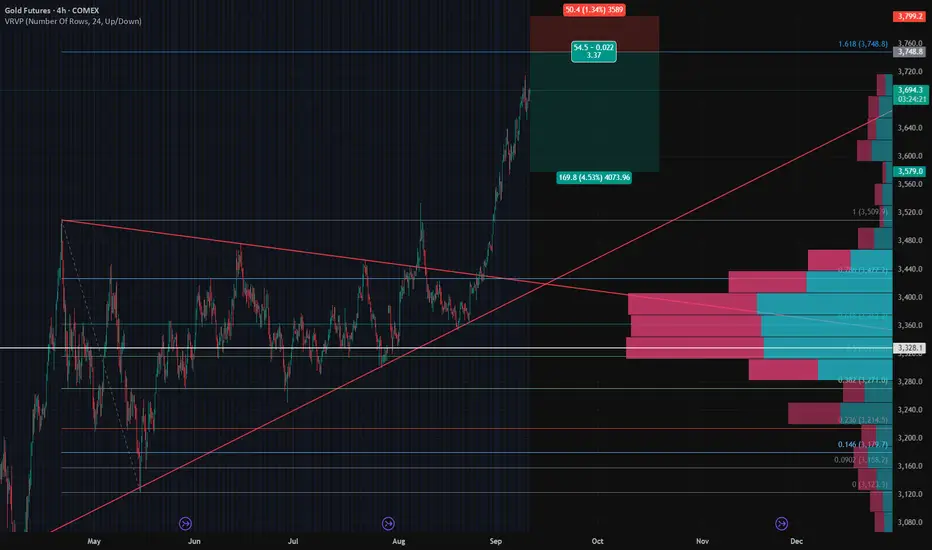
Gold Futures – Short Setup to Lock in Profits🟠 Gold Futures – Short Setup to Lock in Profits
Gold has had a strong breakout above the symmetrical triangle and has now pushed into an extended move near $3,700+. While the trend remains bullish on the higher timeframe, the current leg looks overextended, and I’m looking to hedge profits with a short setup.
🔑 Key Technicals
Pattern Breakout: Gold broke out of a long consolidation wedge and accelerated higher.
Resistance Zone: Price is testing the Fib 1.618 extension near $3,750, a potential exhaustion area.
Volume Profile: Strong demand zone sits between $3,300 – $3,360 where most volume is concentrated. A pullback could retest this area.
Risk-Reward: Setup gives ~1:3.4 RR with stop above recent highs and target into the HVN zone.
📉 Trade Idea – Protective Short
Entry: 3750
Stop Loss: 3800 (extension level).
Take Profit: $3580
⚖️ Strategy
This is not a reversal call – the larger trend is still bullish. The short setup is hedge/profit-protection only, aiming to capture a pullback after the parabolic leg.
I’ll be watching if buyers can defend $3,600 on the first dip; failure to hold could accelerate selling toward the high-volume zone.
📊 Bias
Short-term: Bearish (pullback expected)
Mid-term: Neutral to Bullish (trend intact above $3,300)
What do you think – do we see a healthy correction here, or is gold too strong to fade yet?
Gold hits record highs ahead of FOMC! Tech SetupGold reached fresh all-time highs near $3690 ahead of Wednesday's FOMC meeting. Its rally reflects a perfect storm of Fed dovishness and geopolitical tensions, but technical divergences suggest positioning carefully ahead of Powell's decision. The 100% Fib extension and double divergence setup makes any hawkish surprise particularly dangerous for leveraged longs.
CATALYSTS DRIVING THE RALLY:
Fed rate cut fully priced in (25bps expected, some 50bps speculation)
US-China tensions escalate (Nvidia antitrust accusations)
Stephen Miron confirmed to Fed Board of Governors (dovish member)
Dollar weakness supporting precious metals
Surprising correlation: Nasdaq & S&P 500 also hit records alongside gold
TECHNICAL LEVELS:
Resistance :
$3,700 - Key psychological level
$3,750 - Next major target
$3,800 - Extended upside if dovish
Support :
$3,660 - First support for entries
$3,610 - Major support level
Previous swing lows - Stop loss reference
WARNINGS:
Double divergence on 4H & 1H timeframes
100% Fibonacci extension reached
RSI overbought conditions
Momentum diverging from price action
FOMC SCENARIOS:
Bullish Case : Dovish 25bps + accommodative guidance → Target $3,750-$3,800
Risk Case : Hawkish surprise or even neutral tone → Profit-taking toward $3,600-$3,500
KEY RISKS:
Powell emphasising inflation persistence
Resistance to aggressive cutting cycle
Hawkish dot plot projections
Any break below $3,660 signals deeper correction potential
This content is not directed to residents of the EU or UK. Any opinions, news, research, analyses, prices or other information contained on this website is provided as general market commentary and does not constitute investment advice. ThinkMarkets will not accept liability for any loss or damage including, without limitation, to any loss of profit which may arise directly or indirectly from use of or reliance on such information.

PLTR to 234Big weekly bullish engulfing candle to end the week after a perfect 0.618 rejection 2 week prior. Upside target is just short of 234, stop is 2 fib levels below. If this one doesn't work out, I will be looking for another entry lower.

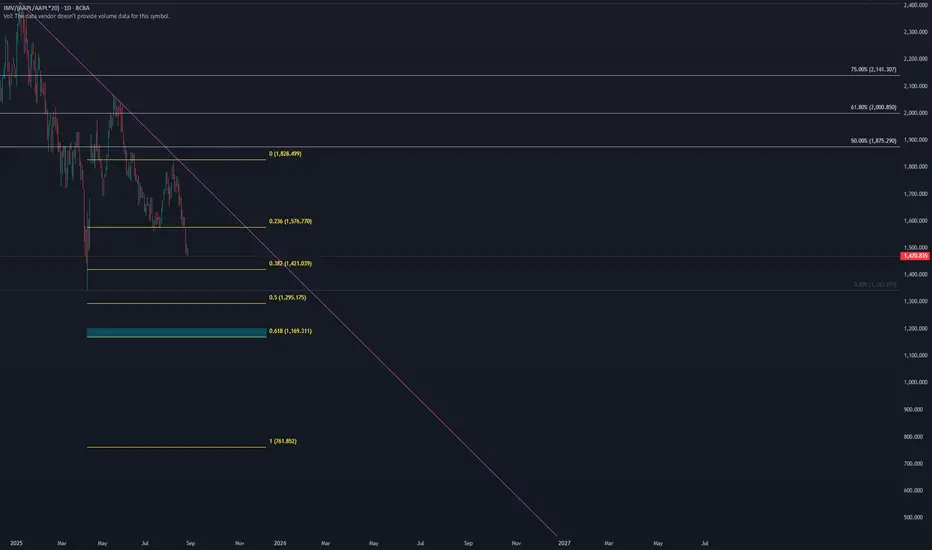
Merval desafiando a Fibonacci con de todoThe retracement reached the 61.8 level, and from there it began its downward path, aiming for the 0.618 extension. Keeping the basic analysis in mind, it seems like it still has room to fall for quite a while.
EUR/USD Possible LongEUR/USD tested a key Fibonacci retracement level and is now retesting the trendline, where it has paused. The next move will depend on whether it can break through with volume and momentum, potentially targeting the key Fibonacci extension levels.

EUR/USD Bullish But... Trendline📊 EUR/USD Technical Analysis – August 19, 2025
The Euro/Dollar pair is currently trading around 1.1657, showing consolidation after recent strong moves.
🔹 Key Fibonacci Levels
Immediate resistance at 1.1687 (38.2%).
Psychological and technical barrier at 1.1775 (50%).
Major resistance at 1.1867 (61.8%).
Upside extension projected towards 1.2159 if the bearish trendline is broken.
🔹 Trend
The descending trendline (in purple) continues to act as a dynamic ceiling. Unless broken decisively, upside potential may remain limited.
🔹 Important Supports
First support at 1.1575 (23.6%).
High-liquidity zone between 1.1450 – 1.1370, crucial to maintain the medium-term bullish structure.
A break below 1.1275 could open the door to a deeper correction.
📌 Conclusion:
The pair is at a decision point. A breakout above the trendline and 1.1687 could trigger fresh bullish momentum. On the other hand, losing the 1.1575 – 1.1450 zone would increase the likelihood of a deeper pullback.

Globant, Bright Future or Total Darkness?📊 Technical Analysis – Globant (GLOB) – Weekly
The price of Globant (NYSE: GLOB) remains under strong bearish pressure, approaching a key long-term support area.
🔑 Fibonacci Levels
0.618 (61.55 USD): critical zone currently being tested. A clear breakdown could open the door to further declines.
0.5 (77.15 USD): first major resistance in case of a rebound.
0.382 (92.75 USD): secondary resistance, aligned with previous supply zones.
0.236 (112.04 USD): stronger resistance level; a breakout above would suggest a trend reversal.
📉 Support and Resistance
Main Support: 65–61 USD, which acted as a strong base during 2019–2020.
Immediate Resistance: 77 USD, followed by 93 USD.
🔄 Volume
Volume has increased significantly over the past weeks, indicating strong institutional activity around this support area. This could hint at a potential technical rebound if the level holds.
📌 Conclusion
As long as GLOB holds above 61 USD, there is room for a rebound toward 77–93 USD.
A breakdown below 61 USD would open a more bearish scenario with medium-term targets around 50–45 USD.
Current bias remains bearish, but we are at a key decision zone.

NVDA goes to $200NVDA keeps pushing towards $200 major resistance area, a very good momentum showed by a clear bullish trendline and stochastic momentum. No sign of bearish yet but still we've seen a slow but steady gain over the last couple days. Trend-based fibonacci is used to project the target price for NVDA. Short-term downward momentum might appear, however if NVDA isn't break down the 1.618 fibonacci level ($165-$170 price range) from the previous trend-based fibonacci, we could say that NVDA still remain bullish. Stop loss is optional on that level.

AAPL Set for a Breakout? | Technical Checklist & Projections
▍Observation & Context
▪ AAPL has been moving sideways within a clearly defined range for the past three months .
▪ On July 07 , price tested the range resistance decisively, showing some interest in the upside.
→ Let's first explore the bullish breakout scenario.
▍What Makes a Good Breakout ?
Before we talk about targets, let’s define what a good breakout looks like:
▪ A strong bullish candle breaking through the resistance in one clean move .
▪ Followed by a retest of the broken resistance (now acting as support).
▪ After that, price should ideally:
1. Form a higher low , and
2. Reach the next resistance or target zone before pulling back.
▍Target Price – Method 1: Extension of the Range
🔹 Near-Term Target: 1.5–1.618x Fibonacci Extension
- A common zone where momentum often pauses.
- Aligns with the previous high from the last downtrend.
- Technically, to reverse a trend, price needs to take out the previous high. Even though the range has “cooled off” the pressure, we still respect that level.
🔹 Ultimate Target: 2x Range Extension
- Represents a 100% projection of the previous range.
- Commonly used in range breakout targets.
🔹 Dream Target: 2.618x Fibonacci Extension
- Aligns with the start of the last downtrend , adding significance to the level.
- Often marks the exhaustion point of strong trends.
▍Target Price – Method 2: Projection from Higher Low
Note: The new higher low is not yet confirmed at the time of writing. The levels below assume an upward breakout without dropping below 207.22 . However, the same logic can be applied once the higher low forms.
🔹 Near-Term Target: Same as Method 1
🔹 Ultimate Target: 100% Projection of Prior Swing
- Projecting the prior swing (from previous low to recent high) from the new higher low .
- This level also aligns with the 1.5–1.618x Fibonacci extension of that swing, increasing its significance.
🔹 Dream Target: Another 100% projection
- Rare, but happens when momentum is very strong .
- In such cases, price might skip any retracement and launch directly into a second leg , equal to the previous swing.
- Here, the level aligns perfectly with the start of the last downtrend , just like the 2.618x extension in Method 1.
▋Mental Notes
▪ No one knows for sure if the breakout will be real or fake. But when it happens, knowing what to look for and where price might go next gives us a clear plan of action .
▪ The market will always find ways to surprise. Stay open and follow the flow.
▋Not Financial Advice
The information contained in this article is not intended as, and should not be understood as financial advice. You should take independent financial advice from a professional who is aware of the facts and circumstances of your individual situation.

Bitcoin hits second target MacroBitcoin just hits second target, Volume is getting smaller, could indicate that buyers are weakening. We should keep an eye, maybe a corection is soon to be seen.
Litecoin to $1100 (12X) In This Coming AltseasonBased on tried and true fractals, multi-fib confluences, and historical price action, Litecoin is poised to hit prices between $900-1500 this cycle. The multi-fib confluences are pointing to $1100-1200 range as the most likely target. This is expected over the next 6-12 months if things continue to play out how I am expecting. As of today SEC approval of a LTC ETF is imminent but yet to be actualized.

JINDAL STEEL: Leading Diagonal Starting?JINDAL STEEL & POWER appears to be constructing an initial impulsive advance that may very well be taking the form of a Leading Diagonal. The advance from the 770 lows has so far developed into a structure where Wave 4 has overlapped with Wave 1 territory, suggesting that a classical impulse structure may not be applicable here. Instead, the price action fits neatly within the characteristics of a leading diagonal pattern, which allows such overlaps.
Wave 1 terminated at 923.80 followed by a corrective pullback into Wave 2 at 833.60. The subsequent rise into Wave 3 reached 985.80, which completed near the 100% extension of Wave 1, supporting the diagonal scenario where extensions are often limited. This was followed by a clear a-b-c correction into Wave 4, which found support at 882.65. Notably, the c-leg of Wave 4 reached close to 1.618 times the length of Wave a, adding further symmetry to this structure.
The current advance may therefore represent Wave 5 of this diagonal, projecting towards the 1036 to 1131 region of Fibonacci extensions. However, since leading diagonals typically signal the start of a larger structure, this entire formation could well be unfolding as either the first leg of a higher degree impulse (Wave 1) or as an initial Wave A of a larger correction. The labeling is thus kept open as "1/a" to reflect both possibilities at this stage.
The invalidation level for the current bullish scenario remains at 882.65, below which this entire leading diagonal interpretation would require reassessment. Until then, the bias remains upwards as the final leg of this structure seeks completion.
Disclaimer: This analysis is for educational purposes only and does not constitute investment advice. Please do your own research (DYOR) before making any trading decisions.

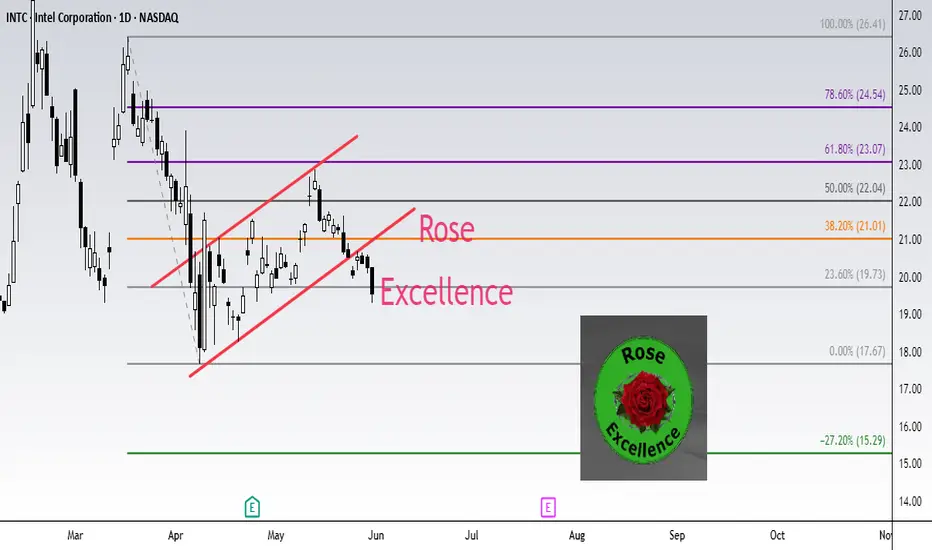
INTEL INTC Short setup target 15.29Fibonacci technical analysis : Intel Corporation NASDAQ:INTC has already found resistance at the Fib level 61.8% (23.07) of my Down Fib. The May 30th Daily candle has closed below retracement Fib level 23.6% (19.73), confirming a sell signal. A Bear Flag pattern has also formed. My Down Fib guides me to look for NASDAQ:INTC to eventually go down to hit first target at Fib level -27.2% (15.29).
NASDAQ:INTC – Target 1 at -27.2% (15.29), Target 2 at -61.8% (12.26) and Target 3 at -78.6 (10.79)
Stop loss slightly above the 50.0% retracement Fib level (22.04).
Enjoy the trading process and take time to smell the roses🌹
S&P ES Long setup target 5963.50 / Calls SPY target 596Fibonacci technical analysis : S&P 500 E-mini Futures CME_MINI:ES1! has already found support at the Fib level 78.6% (5623.50) of my Down Fib. Last Daily candle (May 2) has closed above retracement Fib level 78.6%. My Down Fib guides me to look for CME_MINI:ES1! to eventually go up to hit first target at Fib level 127.2% (5963.50).
CME_MINI:ES1! – Target 1 at 127.2% (5963.50), Target 2 at 161.8% (6205.50) and Target 3 at 178.6 (6322.75)
Stop loss slightly below the 61.8% retracement Fib level (5506.25).
Option Traders : My AMEX:SPY chart Down Fib shows price to go up to Target 1 at 127.2% (595.82), Target 2 at 161.8% (620.50) and Target 3 at 178.6 (632.50)
Stop loss slightly below the 61.8% retracement Fib level (549).
Enjoy the trading process and take time to smell the roses🌹

CADCHF Update | ~150pipsSimilar to USDCHF price broke below a major range and is now pulling back towards the latest breakout zone.
Bulls are looking strong after securing the lower support level and we could see about 150pips as price action looks for targets around 0.61000.

GOLD forms a DOUBLE TOP. Support 3200. Trend reversalGOLD is forming support for the double top reversal pattern
A break of 3200 will confirm the market's intention to reverse the trend and go downwards.
Scenario: There is a lot of important news from the US and Great Britain ahead. If the general fundamental background remains and the dollar continues its bullish trend, then we will be close to a breakdown of 3200.
Thus, a break of 3200 and consolidation below the level will be a signal that we are ready to go down.

NZDUSD is preparing for a reversal and a fallNZDUSD is in consolidation and preparing to exit it. Ahead is possible breakout of trend support and fall to 0.5757
The reason is as follows: change of fundamentals background (positive signals on tariff war), dollar growth and market reversal.
Scenario: break of consolidation support at 0.5885, price consolidation below this level - this will be a signal ready to start distribution, i.e. downward movement.
Primary target 0.5 fibo, secondary target 0.7 fibo

VIRTUALUSDT can derail support with momentumVIRTUAL is consolidating after the rally, but it cannot continue its growth yet. A descending triangle with a clear base support and a fourth retest relative to 1.877 is being formed, which in general only increases the chances of support breakout and decline
Scenario: if the compression of this format (within the descending triangle) continues and the price continues to compress to the support at 1.877, then in this case it will be possible to catch a breakout through a limit order. A sharp impulse is possible. As the first target I will wait for a decline to 0.5 fibo (1.73)
