GOLD → Correction before continuing distribution to 3400FX:XAUUSD entered a correction phase at the start of the session after Friday's rally, triggered by positive fundamentals...
Gold is falling after Friday's rise, triggered by Powell's unexpectedly dovish comments in Jackson Hole. He confirmed the Fed's readiness to cut rates in September amid risks to employment and economic growth. The probability of a September rate cut has risen to 88%.
Gold is correcting after a sharp jump, but the downside potential is limited. Market attention is focused on PCE inflation data this week
Technically, the decline in gold prices may be temporary as the market continues to reassess the prospects for the Fed's dovish policy. The key factor will be Friday's PCE data, which will confirm or adjust expectations for an aggressive rate cut.
Support levels: 3358, 3350, 3340
Resistance levels: 3375, 3405
The 3358-3350 area acts as a strong support zone, and it is also worth paying attention to the previously broken downward consolidation resistance. The market may test the support zone before rising, and a false breakdown and consolidation above the support level could have a bullish impact on the market...
Best regards, R. Linda!
Fibonacci Retracement

BITCOIN → Market potential change. Chance for growth to 125K...BINANCE:BTCUSDT , after a false breakdown of support, which we had been preparing for in my last idea, with the support of dovish hints from Powell, soared from 112K to 117K. What's next???
After Powell's speech and the shift in the fundamental background to positive, BTC broke the local bearish structure, forming a rally to 117K. The market exhausted its potential and, against the backdrop of the approaching weekend and a decline in liquidity, entered a correction phase. However, the relatively positive fundamental background should be taken into account when making further decisions. Lower interest rates could support the market...
Technically, after retesting the 112K zone and forming a false breakdown, Bitcoin changed market sentiment. The capture of liquidity and the breakdown of the local downward structure changes the technical situation in favor of buyers. Potential areas of interest could be 117.8, 120.27, and 125K
Resistance levels: 117K, 117.86K, 120.27K
Support levels: 114.6K, 111.9K
If, during the correction, the bulls manage to keep the price above the upper limit of the local trading range, i.e. above the downward channel and above the 114.600 zone, then interest in buying may increase. The market has the potential to test the resistance of the global trading range...
Best regards, R. Linda!

SOLUSDT 1W Chart1. Main trend
• You can see a strong upward trend from holes around 120 USDT.
• The course currently moves along the growing trend line (orange).
• The last candles show that the buyers are defending support and each hole is higher → a sign of market strength.
⸻
2. Support and resistance (key levels from the chart)
• Support:
• 186.56 USDT - the first strong support (coincides with the trend line).
• 166.42 USDT - another stronger support.
• 139.00 USDT - main strategic support.
• resistance:
• 219.02 USDT - the closest resistance (currently tested).
• 253.15 USDT - strong resistance if 219 is broken.
• 296.24 USDT - another target in the event of a bull market.
⸻
3. Indicators
• MacD - upward signal, lines are above the zero line, green histogram → momentum is growing.
• STOCHASTIC RSI - high, close to the purchase zone → a short correction may occur.
• RSI (classic) - ~ 60 points, i.e. not yet purchased, but the space for increases is reduced.
⸻
4. Scenarios
• Bycza (more likely at the moment):
If the SOL stays above 186 USDT and pierces USDT USDT, subsequent goals are 253 → 296 USDT.
• Bear (alternative):
If the price drops below 186 USDT and breaks the trend line, possible return to 166 and even 139 USDT.
⸻
🔑 Summary
• The trend is upward and still strong.
• Key breakdown is 219 USDT.
• Trend holding (above 186 USDT) = potential for further increases.
• Breaking the trend line = correction warning.

SOL - Buy it before it's too late!As simple as the chart looks, everything on it is clear with strong targets expected in a short time.
The blue line: a close above it means BOS (Break Of Structure), signaling continuation of the upward move.
🔸Notice: this is the third attempt to break it.
In trading, resistance that the price tests multiple times weakens over time, and when it finally breaks, it usually does so with a huge green candle.
The price has also broken the daily 0.618 Fibonacci level, crossed above the 25 EMA, and made a retest of it.
Your minimum target from here is $400.
It’s a beautiful chart, strong project, and a leading coin in the market with big targets ahead… all that’s left is for you to buy it.
Best Regards:
Ceciliones🎯

FETUSDT Resistance Lower High, Swing Low, Swing HigherRide The Next 2 Months of The AI Sector’s Corrections & Next Breakout, short the correction on a macro time frame ignoring the intraday noise. Take Profits & begin buying the dip, accumulating a sizable position to be long on throughout Q4.

GOLD → Consolidation and news. What are the chances for growth?FX:XAUUSD is consolidating in a symmetrical triangle pattern. Market uncertainty remains high. The global trend is bullish, while the local trend is neutral. What can we expect from gold?
Gold is falling ahead of Powell's speech in Jackson Hole. The dollar is strengthening on strong US economic data (housing sales and PMI growth), which reduces the likelihood of an early easing of Fed policy.
Key factors:
Powell may confirm a cautious approach to rate cuts. The probability of a rate cut in September has fallen to 75%. The rise of the dollar as a “safe haven” is putting pressure on gold
Scenarios after the speech:
Hawkish tone from Powell → dollar rises → gold falls below $3300.
Soft signal → dollar correction → gold recovery
Technically , the gold casino continues and it is difficult to determine in advance which way the symmetrical triangle will break, but if we bet on a bullish trend and the likelihood of an imminent interest rate cut, the most likely scenario is a rebound from the support zone followed by a breakout of resistance and a rise to local levels
Resistance levels: 3350, 3358, 3370
Support levels: 3323, 3320, 3315
A false breakout of the key support level, which is being defended quite aggressively by the bulls, could trigger an active recovery phase. However, it is important to keep an eye on Powell's speech, as well as Trump's, who will also be commenting this afternoon.
Best regards, R. Linda!

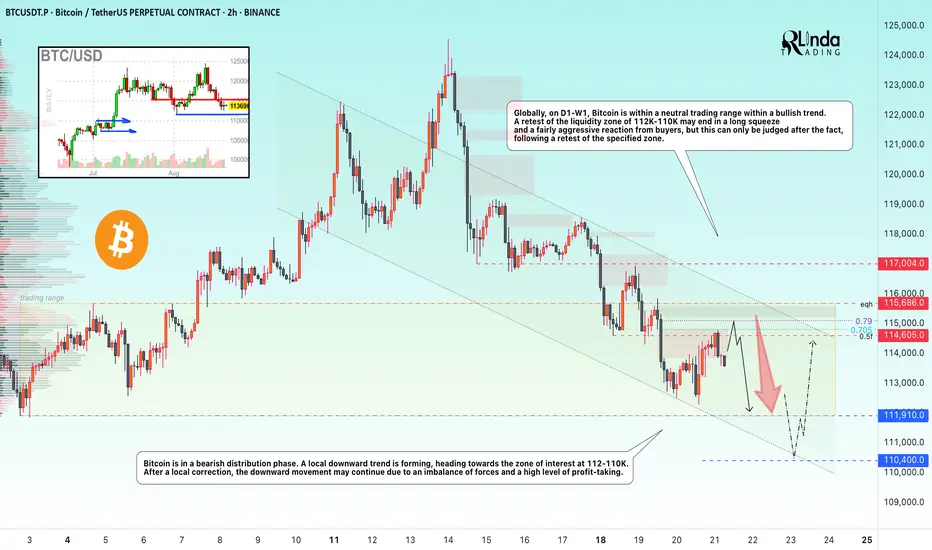
BITCOIN → Retest 112K - 110K before growthBINANCE:BTCUSDT.P is stuck within the trading range of 112K - 123K. The false breakout of the ATH ended with a reversal of the local trend and a bearish distribution phase, which may target the liquidity zone at 112 - 110K.
The market remains bullish, with no fundamental changes for the cryptocurrency market and the situation remaining positive. Technically, we are seeing a countertrend correction within the bullish trend. Bitcoin is in a distribution phase. A local downward trend is forming, directed towards the zone of interest 112 - 110K. After a local upward correction, the downward movement may continue due to an imbalance of forces and a high level of profit-taking.
Globally, on D1-W1, Bitcoin is within a neutral trading range within a bullish trend. A retest of the liquidity zone of 112K-110K may end with a long squeeze and a fairly aggressive reaction from buyers, but this can only be judged after the fact, following a retest of the specified zone.
Resistance levels: 114.600, 115680, 117000
Support levels: 111910, 110400
The downward movement is purposefully heading towards the zone of interest. Earlier, in early August, the market tested the specified level (previous ATH), but technically did not reach the liquidity zones. There is a fairly high chance of a retest of 112 - 110K before the market attempts to grow.
Best regards, R. Linda!
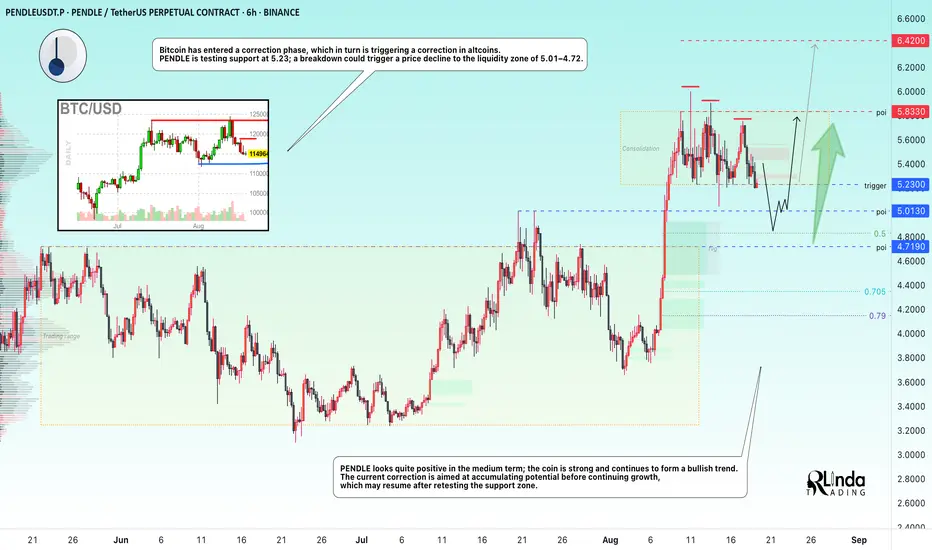
PENDLEUSDT → Retest of the 5.0 liquidity zone before rising to 7BINANCE:PENDLEUSDT is still consolidating, but is preparing to enter a correction phase, which could be triggered by a breakdown the 5.23 support level. Correction is a vital stage for further growth.
Bitcoin has entered a correction phase, which in turn is triggering a correction in altcoins. PENDLE is testing support at 5.23, and a break of this support level, which is already being tested for the sixth time, could trigger a price decline to the liquidity zone of 5.01 - 4.72
PENDLE looks quite positive in the medium term, the coin is strong and continues to form a bullish trend. The current correction is aimed at accumulating potential before continuing growth, which may resume after retesting the support zone.
Resistance levels: 5.833, 6.42
Support levels: 5.23, 5.013, 4.719
On the weekly chart, PENDLE is consolidating above the strong support level of 5.013. As part of the correction, the market may confirm this support and continue its growth towards the ATH from the mirror level.
Best regards, R. Linda!
EUR/USD Possible LongEUR/USD tested a key Fibonacci retracement level and is now retesting the trendline, where it has paused. The next move will depend on whether it can break through with volume and momentum, potentially targeting the key Fibonacci extension levels.

Globant 4H Double BottomGlobant posted a positive earnings report. On the 4-hour chart, a double bottom can be observed. Considering the recent decline in the stock, applying a Fibonacci retracement followed by an extension shows the lowest extension level at 1.618, which acted as support. Today, the price broke to the upside. It will be important to analyze with caution whether it starts gaining volume to return to previous levels, while adjusting the stop-loss as a precaution.

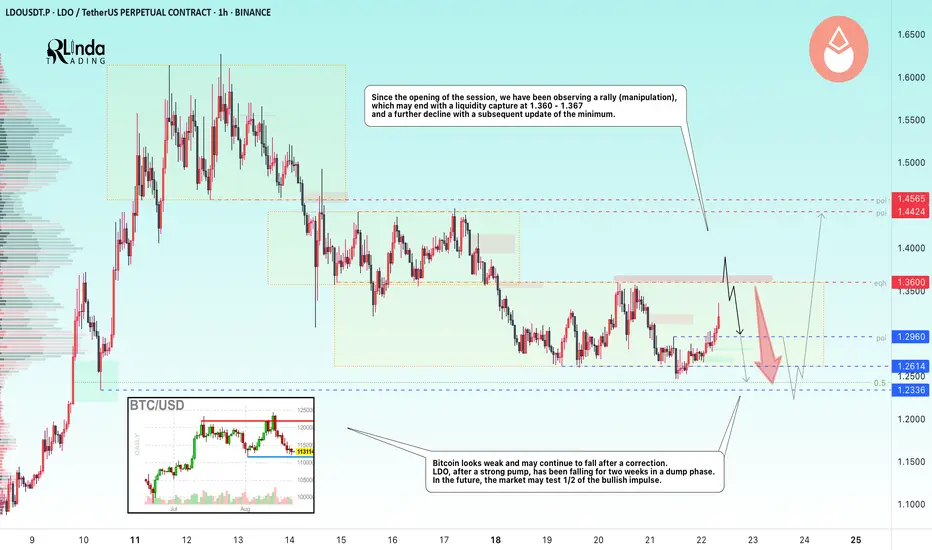
LDOUSDT → Hunting for liquidity ahead of a declineBINANCE:LDOUSDT.P , having failed to reach the zone of interest 1.250 - 1.233, has entered a phase of local rally or manipulation before a possible decline aimed at consolidating potential before long-term growth.
Bitcoin looks weak and, after a correction, may continue to fall to the coveted target of 112 - 110K. After a strong pump, LDO has been falling for two weeks in a dump phase. In the long term, the market may test 1/2 of the bullish momentum and the strong support level of 1.179 before resuming the pump to 1.62 - 1.97.
Since the opening of the session, we have been observing manipulation, the goal of which is most likely the liquidity zone of 1.36 - 1.36. The situation may end with a liquidity grab, a false breakout, and a further decline with a subsequent update of the low.
Resistance levels: 1.36, 1.37, 1.44
Support levels: 1.296, 1.2614, 1.2336
Technically, the price is still consolidating and intrarange trading is likely to continue. A false breakout of resistance could trigger a decline, in which case 1.26 - 1.23 could be considered a target, while a false break of 1.17 - 1.23 could trigger a global rise.
Best regards, R. Linda!
GOLD → Breakthrough of downward resistance, news ahead...FX:XAUUSD is recovering after a fairly prolonged decline, and there are signs of bullish sentiment on the chart, but caution is advised as important news is ahead...
Gold is in a holding pattern. Its short-term fate depends on today's US economic data and, to a greater extent, on tomorrow's speech by Powell, which will set the tone for the future. The price is recovering slightly after a recent decline, but is trading cautiously.
The market is awaiting the release of S&P Global's business activity indices (PMI), which will assess the strength of the US economy and influence Fed rate forecasts. Another key event of the week is the Fed chair's speech in Jackson Hole on Friday. His comments on future interest rates will determine the further movement of gold and the dollar.
Technically, we are seeing a rebound from the support of a global symmetrical triangle, with bulls still in the market but waiting for further signals. Locally, we are seeing positive dynamics — a breakout of downward resistance and consolidation in the buying zone...
Resistance levels: 3350, 3370
Support levels: 3331, 3315
The conditions for further growth should be a positive fundamental background and the bulls holding the price above key support. A retest of the trading range boundary (0.5f) is possible before growth.
Best regards, R. Linda!

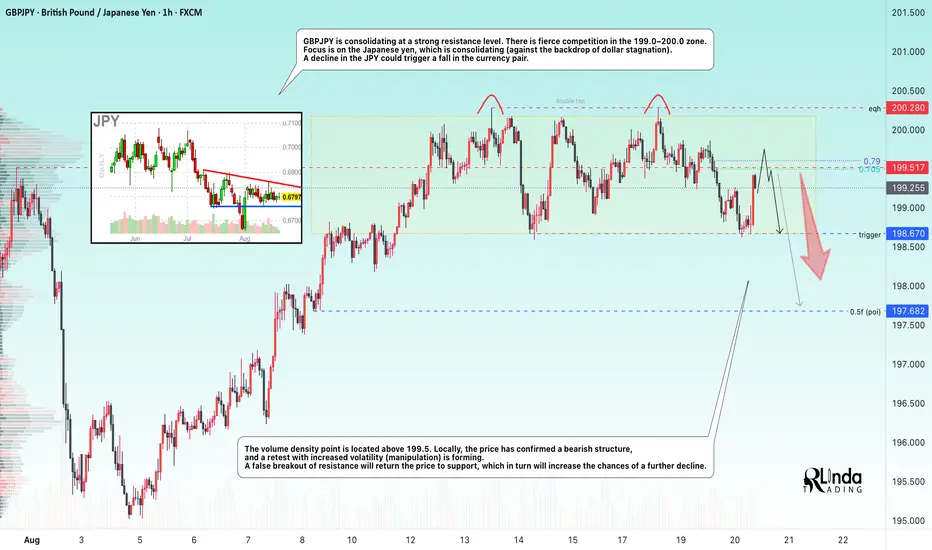
GBPJPY → False breakout and reversal patternFX:GBPJPY is forming a false breakout of strong resistance from D1. A trading range (consolidation) is forming, and market participants are fighting for the 199.0 - 200.0 zone.
GBPJPY is consolidating at strong resistance. A fierce battle is underway for the 199.0-200.0 zone. Focus is on the Japanese yen, which is consolidating (against a backdrop of dollar stagnation). A decline in the JPY could trigger a fall in the currency pair.
The volume density point is located above 199.5. Locally, the price has confirmed a bearish structure, and a retest is forming on increased volatility (manipulation). A false breakout of resistance will return the price to support, which in turn will increase the chances of a further decline
Resistance levels: 199.5, 200.28
Support levels: 198.67, 197.68
A double top reversal pattern is forming on the chart, indicating the presence of strong limit resistance, but the pattern has not yet been realized. The trigger is consolidation support. Locally, I expect a decline from 199.5 to retest the trigger, the breakout of which could trigger the reversal pattern.
Best regards, R. Linda!
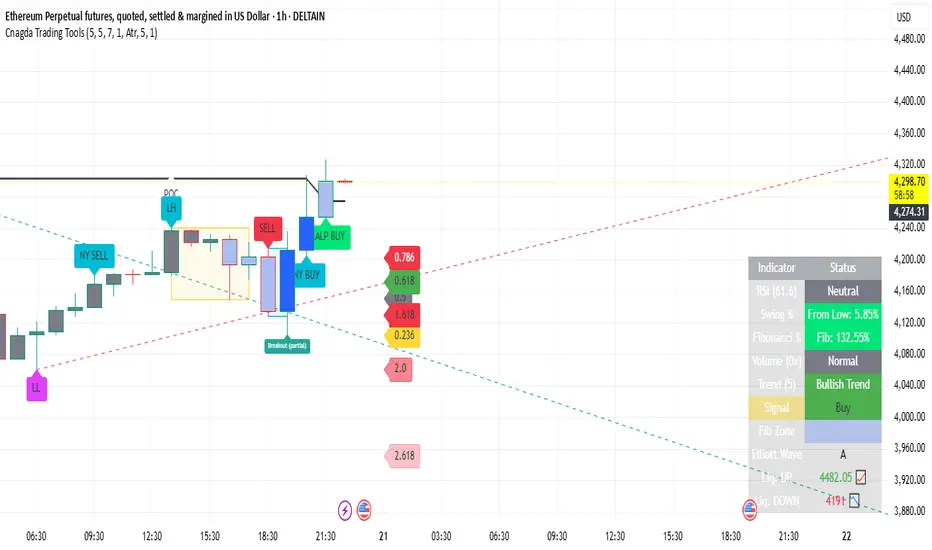
Where is ETH Headed Next? Clear Entry & Exit PlanCurrent Status (August 20, 2025, 1H Chart) Eth
Price: 4,310.40 USD (1-hour close)
Day High: 4,327.60 USD
Day Low: 4,253.65 USD
Change: +1.32% (large positive candle)
1. Trend and Momentum Indicator wise:
Almost all signals are bullish:
Mid-term moving averages (EMA/WMA) are pointing upwards.
Trend line breakouts and labels like “BUY”/“SCALP BUY” may appear.
Volume is also supporting – “High” or “Above Avg” on the dashboard.
RSI will also be above 50 – a sign of continued strength in the trend.
2. Next targets (Fibonacci Extensions)
Potential targets estimated from Fibonacci levels:
1.618 Extension: First resistance/target (approx. zone above current price)
2.0 Extension: Second target
2.618 Extension: Last/aggressive target
These levels are drawn automatically by Cnagda Indicator, and based on them price may pause, or reverse with weak volume.
3. Where can reversal happen?
Reversal Zone:
If RSI moves near or above 70 and price touches Fibonacci 1.618 or 2.0 extension – short term top or reversal is expected there.
If dynamic labels “SCALP SELL”, “SELL”, or “Breakout (red/orange)” are shown, it will be a reversal area.
If the "Signal" line in the dashboard becomes "Strong Sell" or "Sell" – the possibility of reversal increases a lot.
4. Entry-Exit Trading Plan
Entry (Long):
Entry Trigger:
When "BUY", "SCALP BUY" or "Breakout" (lime/green label) appears, and price volume and RSI give confirmation.
Stoploss:
Slightly below previous swing-low (dashboard or Fibonacci low zone)
Target (Long):
Primary target: 1.618 Fibonacci Extension (from Fib Levels line)
If strength continues: 2.0 or 2.618 Extension (hold position from trailing SL)
Partial Exit: "Liq. UP" from dashboard table
Reversal/Short Entry:
If “SELL” or “SCALP SELL”/Breakout is shown at the higher level and dashboard is "Sell/Strong Sell" – go short.
Plan short only if volume is falling, RSI is 70+ (overbought).
Target: Fibonacci 1.0, 0.618, or "Liq. DOWN".
Takeaway for Readers:
"Ethereum is currently bullish in trend and there is a high chance that it will touch the next Fibonacci extension levels (1.618/2.0/2.618) -
But as soon as the reversal label appears in the overbought zone or with strong volume, profit booking will be justified.
The perfect trading plan is:
Take trades according to the trend and the direction of the Cnagda Indicator.
Entry only on your signal, and target on the Fib level.
Take reversals only on clear confirmation of the table and signal."
Author Note:
This article is completely based on the Pine Script indicator which is as advanced as "Cnagda Trading Tools" - do not rely on anything other than real-time algorithmic signals...
USDCAD - price increase after correction. Bullish trendA reversal pattern is forming, indicating the emergence of limit resistance from bears. The pattern structure has been broken, and the price has entered the realization phase. As part of a downward rally, USDCAD may test 0.5 Fibonacci and return to the bullish trend.
Scenario: The current aggressive decline may be halted by a strong support zone, which has several confirmations. A false breakdown and consolidation above 1.3831 - 1.3835 will confirm the bullish sentiment and may return the price to retest the resistance at 1.3879.

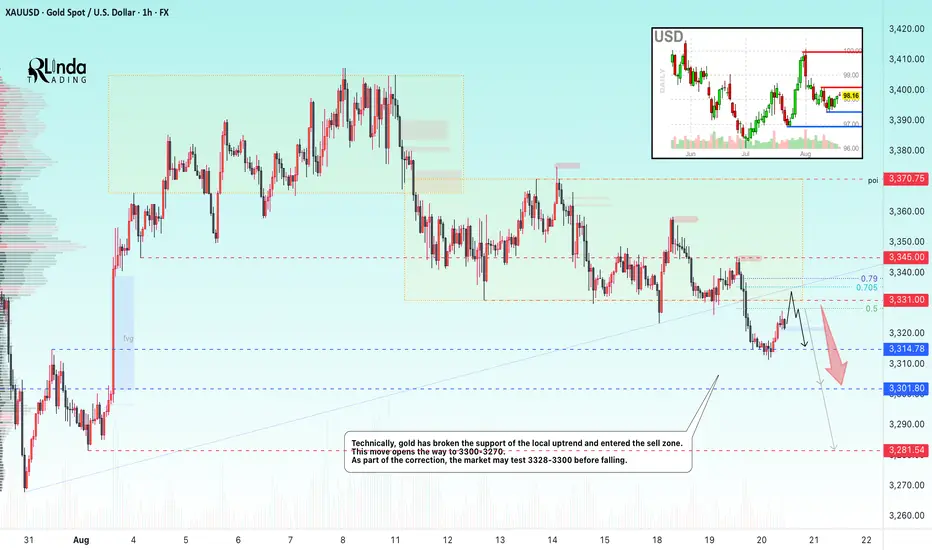
GOLD → Correction and retest of a previously broken level...FX:XAUUSD breaks through the support of the local consolidation “symmetrical triangle” and falls to a minimum of 3311...
Gold remained at a three-week low of around $3,300 in Asian trading on Wednesday as markets awaited the Fed minutes and Powell's speech in Jackson Hole. The dollar is strengthening on expectations that the Fed chair will reject the idea of aggressive rate cuts despite weak labor market and inflation data. The probability of a rate cut in September is estimated at 85%. Strong housing market data and news about negotiations on Ukraine provided additional support to the dollar. Powell's comments on Friday remain the key factor for gold, while current movements are mainly technical in nature.
Resistance levels: 3328, 3331, 3345
Support levels: 3314, 3300, 3328
Technically, a correction is forming after a bearish rally. As part of the correction, the price may test the zone of interest, which is represented by local resistance levels. Distribution could bring the price to 3300-3270.
Best regards, R. Linda!
GBPUSD Short Position idea! RR 1:6Price broke the daily trend line and its tested back the trend line resistance twice on 4HR down trend fibonacci. This could be a possible pullback till the key zone. Trade with your own risk, Cheers!

EURUSD Short Idea! 4H, RR 1:5Daily Trend line broke and being tested back on fibonacci retracement and trend line resistance.
It looks like there is some downward movement coming possible till the key zone. Cheers! Let’s see!

BTC/USD 1D LongTerm1. Price and main trend
• Current price: 113,448 USD (decrease -2.42%).
• On the daily chart you can see that Bitcoin pierced the yellow upward trend line and descended below the average walking (SMA). This is a signal of weakening the trend.
2. Support and resistance
• resistance:
• 117,687 (SMA - local resistance).
• 120,645 and 122.766 (stronger resistance zones).
• Support:
• 113.016 (first, local support).
• 110.541 (important support).
• 106,238 (key support - if it falls, more correction possible).
3. Medium walking (SMA/EMA)
• The price has gone below short -term medium (red and green lines).
• This suggests that the advantage has temporarily switched to the side of sellers.
4. MacD
• MacD histogram goes into a negative zone.
• The MacD line drops below the signal → This is a sales signal.
5. RSI
• RSI oscillates below 50 and slightly reduces.
• This means weakening the momentum of bulls and a potentially place for further decline (only around the RSI 30 would mean a strong sale).
6. Summary of the situation
• Technically the market looks weak - a breach of an upward trend, exit below medium and negative MacD.
• The next key support is: 113K → 110.5k → 106.2k.
• If 113K persists, it is possible to bounce up to 117k -120k, but only a return above 120K would change the sentiment to a more bullish.

GOLD → The market is waiting for a kick (driver). ConsolidationFX:XAUUSD is in a stalemate. A “casino” pattern is forming in the form of a symmetrical triangle. The odds are 50/50, and everything depends on the fundamental background and the emergence of a driver.
Gold is stuck in a symmetrical triangle - consolidation.
Gold is trading around $3330 on Tuesday, remaining in a range with a downward bias amid caution among traders ahead of the Fed minutes.
Technically, it is possible to trade the breakout from consolidation with the price consolidating above a certain level, i.e., post-factum.
Optimism after the meeting between Trump and Zelensky, who promised to end the conflict, is reducing demand for safe assets, but expectations of a Fed rate cut this year are supporting the metal. An additional factor is the confirmation of the US rating by S&P. Powell's speech on Friday will be a key driver, while the dollar has partially recovered after its recent decline.
Resistance levels: 3349.8, 3370.7
Support levels: 3331, 3315, 3301
Volatility has been very low over the past few days, with the market waiting for someone to kick-start movement. Fundamental factors are contradictory, and technically, gold looks uncertainly weak. Based on this, I expect that a retest of the nearest resistance could end with a downward breakdown from consolidation.
Sincerely, R. Linda!

EURCAD → Countertrend correction before growthFX:EURCAD is forming a correction to the support zone against the backdrop of temporary stagnation of the euro, which is the previous extreme from July 1...
EURCAD is forming a countertrend correction within the global bullish trend. The euro is gradually rising amid the fall of the dollar. The Canadian dollar is consolidating below strong medium-term resistance and may continue its decline, which will only support the bullish trend in EURCAD
Technically, the price is entering a liquidity zone, with a point of interest at 1.61 - 1.609, locally at 1.61225, where the upward support line also passes...
Support levels: 1.6122, 1.6100
Resistance levels: 1.618, 1.625
The main focus is on the specified support zones. If, after a false breakdown of the point of interest, the bulls are able to keep the price above the support zone, then in this case we can expect a possible continuation of the trend. Otherwise, the local trend may be broken and the market will go into a deep correction...
Best regards, R. Linda!

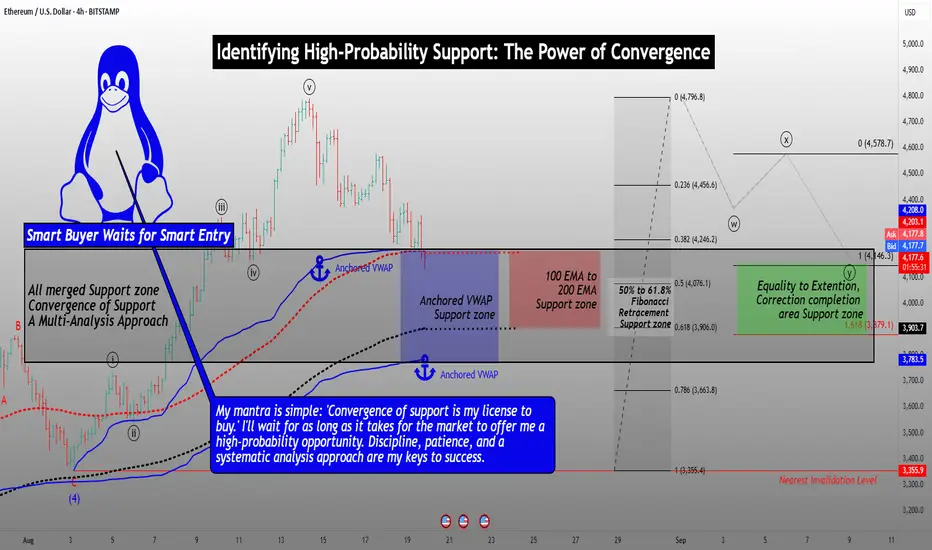
Identifying High-Probability Support: The Power of ConvergenceHello Friends,
Welcome to RK_Chaarts
Today we're going to learn Comprehensive Guide to Identifying Convergent Support Zones
Which are High Probability Support areas. This post is for Educational purpose only.
This detailed analysis will walk you through a step-by-step process of combining multiple technical analysis methods to identify a robust support zone. We'll explore how Elliott Wave theory, Anchored VWAP, EMA200, Fibonacci Retracements, and equality to extensions can coincidentally converge on the same support zone.
Step 1: Elliott Wave Analysis
Begin by identifying the Elliott Wave structure. Look for impulse waves, corrective waves, and the relationships between them. In this example:
- Wave Y is potentially completing near the equality zone (100% to 161.8% extension).
- This level marks a potential reversal point.
Support zone as per Elliott Wave theory Analysis
Step 2: Anchored VWAP Analysis
Apply Anchored VWAP to identify key support levels:
- Plot the VWAP from the last swing low and the second-last swing low.
- Note the convergence of these VWAP levels, which can indicate strong support.
Support zone as per Anchored VWAP Analysis
Step 3: EMA200 Analysis
Add the 200-period Exponential Moving Average (EMA) to your chart:
- The EMA200 has consistently provided support during previous corrections.
- Note the price approaching this level, increasing the likelihood of a bounce.
Support zone as per 200 Exponantial Moving Average
Step 4: Fibonacci Retracement Analysis
Apply Fibonacci retracements to the previous rally:
- Identify the 50%, 61.8%, and 78.6% retracement levels.
- Note the current fall has already exceeded the 38% retracement.
Support zone as per Fibonacci Retracement Analysis
Step 5: Convergence of Support Zones
Combine the analysis from each step:
- Note the striking convergence of support zones:
- Elliott Wave equality zone (100% to 161.8% extension)
- Anchored VWAP support zone
- EMA200 support level
- Fibonacci retracement zone (50%-61.8%)
Coincidentally all these are providing nearly same Support area (Price zone)
Trading Implications
With the convergence of these multiple analysis methods, you can:
- Identify a high-probability support zone.
- Look for buying opportunities near this zone.
- Monitor price action and market sentiment for confirmation of a reversal.
- Consider scaling into positions or setting limit orders within the support zone.
Important Note: Failure to Hold Support
If the price fails to hold support at this converged zone, it may indicate a stronger bearish trend. In this scenario:
- Be prepared for a potential significant downfall.
- Consider adjusting your trading plan to account for the increased bearish momentum.
- Keep a close eye on price action and market sentiment for further guidance.
By understanding the convergence of these multiple analysis methods and being aware of the potential risks, you'll be better equipped to make informed trading decisions and navigate the markets with confidence.
I am not Sebi registered analyst.
My studies are for educational purpose only.
Please Consult your financial advisor before trading or investing.
I am not responsible for any kinds of your profits and your losses.
Most investors treat trading as a hobby because they have a full-time job doing something else.
However, If you treat trading like a business, it will pay you like a business.
If you treat like a hobby, hobbies don't pay, they cost you...!
Hope this post is helpful to community
Thanks
RK💕
Disclaimer and Risk Warning.
The analysis and discussion provided on in.tradingview.com is intended for educational purposes only and should not be relied upon for trading decisions. RK_Chaarts is not an investment adviser and the information provided here should not be taken as professional investment advice. Before buying or selling any investments, securities, or precious metals, it is recommended that you conduct your own due diligence. RK_Chaarts does not share in your profits and will not take responsibility for any losses you may incur. So Please Consult your financial advisor before trading or investing.
EUR/USD Bullish But... Trendline📊 EUR/USD Technical Analysis – August 19, 2025
The Euro/Dollar pair is currently trading around 1.1657, showing consolidation after recent strong moves.
🔹 Key Fibonacci Levels
Immediate resistance at 1.1687 (38.2%).
Psychological and technical barrier at 1.1775 (50%).
Major resistance at 1.1867 (61.8%).
Upside extension projected towards 1.2159 if the bearish trendline is broken.
🔹 Trend
The descending trendline (in purple) continues to act as a dynamic ceiling. Unless broken decisively, upside potential may remain limited.
🔹 Important Supports
First support at 1.1575 (23.6%).
High-liquidity zone between 1.1450 – 1.1370, crucial to maintain the medium-term bullish structure.
A break below 1.1275 could open the door to a deeper correction.
📌 Conclusion:
The pair is at a decision point. A breakout above the trendline and 1.1687 could trigger fresh bullish momentum. On the other hand, losing the 1.1575 – 1.1450 zone would increase the likelihood of a deeper pullback.
