Ethereum conservative long target for this week. I have been posting about this latest trend Ethereum has been meticulously following. Notice all the confluence within the forks both long term and short term. New forecast is conservatively putting the price near 1900 in next few days. Pending any breakdown we could be looking for new highs by mid March!! #HODL!!
Fibs


QQQ very clear 5 waves down - The 'A' wave may be finished QQQ 5 waves down - the fib extensions measure out cleanly.
Because it appears there have been 5 waves down this implies it is the A wave of an ABC correction.
Now will watch for the B wave up dead cat bounce, before the c wave finishes it and could bring it lower.
There is another more bearish possible count here but wont post that just yet. If this ABC is the pattern that has started it, could play out something like this.
Many other tickers have this similar 5 wave structure down.
Look at the perfect bounce on this monthly candle level which was the monthly open for september 2020.
Volume climax.
Getting into oversold areas.
VIX never really spiked on this first drop...
Bigger fib extension long setup (yellow and red lines) could take this to the green target at 362 as long as the red line holds.
The more bearish elliott wave count would invalidate the fib setup.

TSLA very clear 5 waves down - The 'A' wave may be finished TSLA very clear 5 waves down and measurement levels are clean.
5 waves down is corrective and has 2 possible outcomes, this being the less bearish of the 2 and i lean towards this more conservative count for now.
It looks like tsla has put in an A wave of an ABC correction, and its very possible the A wave down is done.
Looking for a B wave bounce to start soon.
Other tickers as well as the QQQ have very similar 5 waves down.
Price bounced at the 50% fib of an extension fib setup. The longer term target for this fib setup is 1068 as long as 465 doesnt break.
Trendline Support.
Volume climax at lows.
RSI and Stoch oversold.
Watching for the start of the B wave up. Resistance into recent supply levels would make sense possibly up to 840.


Oh no! What should I do!?!?!? Do thisBTC is selling off a local top here. Is this the end? Just a dip? Who cares! Make money while the market decides. I see a lot of people use fib retracements literally anywhere and everywhere. But this instance is a perfect example of when fibs can be useful buy and sell zones. What will occur over the next few weeks is the reduction of volatility in bitcoin. Price will randomly sway up and down testing lower highs and higher lows. As this occurs a relatively probable (over 50% chance) correlation with fib retracement zones is obeyed.
DISCLAIMER: These buy and sell zones are not guaranteed and should not be taken with high leverage or high float.

Bitcoin and FibsOn one random Saturday, on an impulse, I decided to pull up a BTC chart and throw Fibs on it. This is the result. I'd say it's due for a reversal now at the 161% level.


THETAUSDT Target met!Just providing an update on THETA after it's long period of consolidation and subsequent breakout, ultimately reaching our profit target as expected.
All that is left to do is let the Trailing Stop take the rest away if the market allows.
Happy Trading all, manage your risk.

#LI Reversal Coming Soon?- Li showing life of reversal here but breaking that trendline + Fib plus strong support will just bring more downside.
- But with that being said everything mentioned above plus indicators do show signs of a bounce or possible reversal here.
- Li usually runs along with Nio and Xpev as well can pump along with energy so its something to watch out.
Overall bullish as there is a lot off signals showing strong strength of reversal.

The Mighty $DXY - A Bull with a sustainable infinite uptrendLadies and Gentlemen Traders of all legal ages please I Implore you to please DYOR. Okay lets get a little technical from what can be seen the cci indicator is showing that its starting to go above -100 for me its a confirmation that 89 is history The RSI indicator as well is showing bullish signs. Folks hope this could of being of some help hit the like and leave a comment. Happy hunting Im shorting the EURO. Long live Stimulus pumps lol

GBPCAD ShortI will let you know when i enter, i want price to come up at my entry and see 1-2 wicks on 5m. Lets see
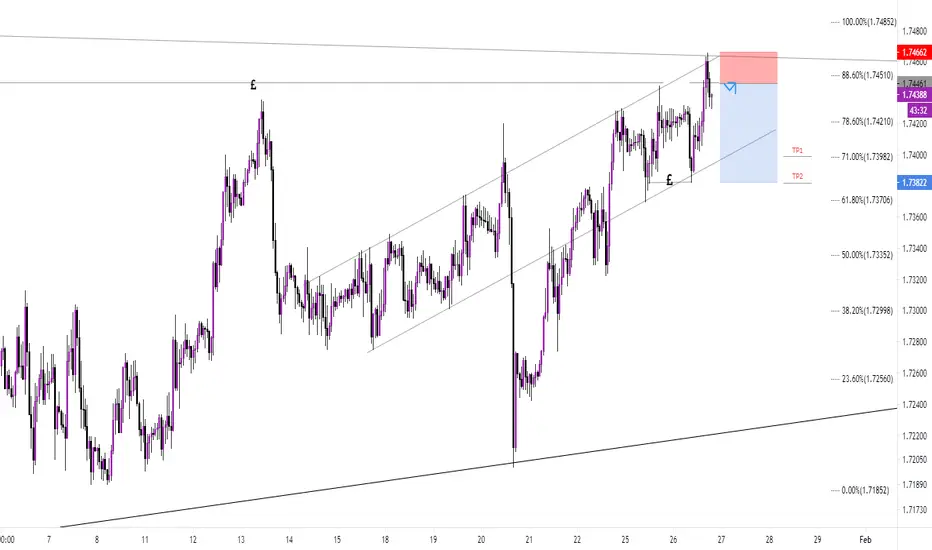
EURGBP DOWNWe have a bounce off resistance and a bounce off the 50 fib wkly level.
I am bullish on EUR, and I am also bullish on GBP so lets see how this plays out.


BTCUSD: A Potential Move HigherBTCUSD
Bias – bullish
Reference timeframe – 12H
Entry timeframe – 30M
Entry order type – limit
BTCUSD has been working the 30-40k range , with quite a substantial volume traded in the midpoint of that. If bulls manage to absorb the selling in this range, another round of marking up the price is expected. Seems reasonable to be looking for limit long entries on lower timeframes.

BTC Log Scale Moon Math w/Fib channel extensions.This is a Log scale chart on BTC/USD from Bitstamp. Utilizing fib channels with 618 extensions, trend based fib time, and regular fib extensions.

Gold Finding Support Hello Traders
If Gold Closes below the Resistance level, then Gold will need to retest a Fibonacci level in order to get back onto its bullish trend but for now its safer to catch the bearish movements in the market as of right now. So selling would be the safest bet, riding until one of the Golden Fibs are hit!

EURUSD POSSIBLE TRADE IDEAAfter a swift pullback on the 21st, the Daily chart created a pinbar with a massive wick that was filled today (22nd).
Price as you can see has moved into my zone, which lines up perfectly with the 0.79 fibonacci retracement that you can pull on the 1 or 4hr chart. I believe that with bearishness on the DXY, EURUSD could trade higher, targeting the buyside liquidity as indicated on the chart.

MUST SEE! LINK/USD To This Price!?! Here's How...Welcome everyone,
My name is Schyler with NewWave Traders. NWT is a movement in Elliott wave and trading education, a movement in creating independent and profitable traders, and a movement in lifestyle. I've been a full time trader since 2017 in the crypto markets and I help traders create a full time income for themselves without working the full time hours by mastering a proven Elliott Wave trading system that will allow you to trade on your time and live the life you deserve. Hit the follow & like button if you'd like to make it a reality. I've helped hundreds of traders just like you make it a reality for themselves. Looking forward to helping you create your success story and life. It's 100% possible!
Let's Talk LINK/USD
So this baby is staring at a dark scenario to $6, however depending on what side of it you are on that could be very profitable as well.
If you follow my style of trading and system I'm very big on acknowledging both counts to the market so we can be prepared for either scenario.
But we also have to pick a side, so we have had a short setup on LINK since 13.10, which is standing up about 10% at time of writing.
So the bearish invalidation is going to be surpassing previous high at 14.88. Until then downside potential seems strong.
Let's also talk about the upside potential. If downside count is invalidated at 14.88 basically, then that's where we should also know where the upside potential lies. It's hard to deny that LINK's current climb in the ascending channel has been corrective, it had the opportunity and dropped the ball, so if we're going to move higher it will have to be as a complex structure and we should likely look for a 1:1 extension in the green count that takes us to 25.74. In this case it'd have to be a running flat at most and then take us higher.
Multiple ways to trade the intraday on this as it plays out in either direction. Follow along to keep updated with the count and for more info check out my signature tag below.
To your success,
Schyler
