BTC Take OFF for a BUYNow at this time we are little late to take buy entry but we have still opperunity for BUY . Price Down at 93518.15 and we find a buy conformation in any 5,3 and 1M time ,other details I share in chart where price gone
Fixedrangevolumeprofile

FRVP INDICATOR TOOL ON BTCUSDThe frvp tool helps you to predict the future of the market. do well to follow me or inbox me for further explanations

GOLD BUY AreaNow at time price move on 4456.880 area and this is a support area of FVR if price closed above this price then we take a Buy minimum 4473.473 and maximum more above .these are black and red Line very important price where price more chances to struggling or Trend Reversal

Silver Retirement for a Bullish Direction Now this time is on high price level area we are wait for its price come down at minimum at 77.27916 then we get clear buy conformation for buy
DISCLAIMER
This is made for educational and informational purposes only.
It is not financial, investment, or trading advice.
Trading involves risk, and past performance doesn't guarantee future results.
Always do your own research or consult a licensed financial advisor
before making any trading or investment decisions.
The creator is not responsible for any profit or loss from your actions.
We don't offer paid signals or account management services.
Beware of scammers using our name - we are not connected to them.

How to Trade with Volume Profile in TradingView Master Volume Profile using TradingView's powerful charting tools in this step-by-step tutorial from Optimus Futures.
Volume Profile is an advanced charting indicator that helps traders identify key support and resistance levels, areas of price acceptance, and potential breakout zones by showing where trading activity is concentrated at different price levels.
What You'll Learn:
Understanding Volume Profile as a price-based volume tool that displays trading activity horizontally across price levels
How the Point of Control (POC) represents the price level with the highest traded volume
How the Value Area encompasses approximately 70% of all traded volume, bounded by the Value Area High (VAH) and Value Area Low (VAL)
Why High Volume Nodes signal areas of price acceptance and potential support or resistance
Why Low Volume Nodes signal areas of price rejection where markets tend to move quickly
Recognizing when price trades above or below the previous session's Value Area for directional bias
Why these levels aren't automatic buy or sell triggers, and how to confirm them with other tools like traditional support/resistance or trend analysis
Identifying the "low volume node breakout," a setup where price accelerates through thin areas
Spotting potential mean-reversion trades when price returns to the POC after an extended move
How to add Volume Profile tools on TradingView via the drawing tools panel
Understanding Fixed Range, Anchored, and Session Volume Profile options and when to use each
Practical examples using futures charts
Applying Volume Profile across daily, weekly, and intraday timeframes for market structure analysis and trade planning
Learn more about futures trading with TradingView:
optimusfutures.com
Disclaimer
There is a substantial risk of loss in futures trading. Past performance is not indicative of future results. Please trade only with risk capital. We are not responsible for any third-party links, comments, or content shared on TradingView. Any opinions, links, or messages posted by users on TradingView do not represent our views or recommendations. Please exercise your own judgment and due diligence when engaging with any external content or user commentary.
This video represents the opinion of Optimus Futures and is intended for educational purposes only. Chart interpretations are presented solely to illustrate objective technical concepts and should not be viewed as predictive of future market behavior. In our opinion, charts are analytical tools — not forecasting instruments.

Gold More Chances to Buy Now at this its price on exactly on VALUE AREA LOW POINT .its more Chances to goes Bullish side at 4370.289 to 4382.893 (POC and Value Area High ) these area are Struggling for if price break that level then will be another BULLISH Move 4548.009.
let’s see how price reacts around this level
DISCLAIMER
This is made for educational and informational purposes only.
It is not financial, investment, or trading advice.
Trading involves risk, and past performance doesn't guarantee future results.
Always do your own research or consult a licensed financial advisor
before making any trading or investment decisions.
The creator is not responsible for any profit or loss from your actions.
We don't offer paid signals or account management services.
Beware of scammers using our name - we are not connected to them.

SOLUSD SELL FOR THE BUY SIDENow this time Price move 134.57 .its come down at 131.89 here hits Fibonacci golden zone ,fair-value-gap(FVG)also have Internal Liquated sweep point take Clear Conformation they goes for a BUY Entry
DISCLAIMER
This is made for educational and informational purposes only.
It is not financial, investment, or trading advice.
Trading involves risk, and past performance doesn't guarantee future results.
Always do your own research or consult a licensed financial advisor
before making any trading or investment decisions.
The creator is not responsible for any profit or loss from your actions.
We don't offer paid signals or account management services.
Beware of scammers using our name - we are not connected to them.

ETHUSD Wait for BuyNow at time price retirement at 3124.91 point then its given clear Buy Conformation then I will a Buy Position .
DISCLAIMER
This is made for educational and informational purposes only.
It is not financial, investment, or trading advice.
Trading involves risk, and past performance doesn't guarantee future results.
Always do your own research or consult a licensed financial advisor
before making any trading or investment decisions.
The creator is not responsible for any profit or loss from your actions.
We don't offer paid signals or account management services.
Beware of scammers using our name - we are not connected to them.

Silver BULLISH Direction Silver Price Closed the above 75.20095 Resistance area, its Slow form to move up at 80.48488 Point if price closed above that level then price up side .
DISCLAIMER
This is made for educational and informational purposes only.
It is not financial, investment, or trading advice.
Trading involves risk, and past performance doesn't guarantee future results.
Always do your own research or consult a licensed financial advisor
before making any trading or investment decisions.
The creator is not responsible for any profit or loss from your actions.
We don't offer paid signals or account management services.
Beware of scammers using our name - we are not connected to them.

US30 Clear Buy Formation Made now at This time price move at side-way SIDE, hits 3rd trend-line touch and Bearish Order Block in BULLISH ENGULFING , Just Wait for price Closed 48485.02 in BULLISH Form .then we Ready For BUY
DISCLAIMER
This is made for educational and informational purposes only.
It is not financial, investment, or trading advice.
Trading involves risk, and past performance doesn't guarantee future results.
Always do your own research or consult a licensed financial advisor
before making any trading or investment decisions.
The creator is not responsible for any profit or loss from your actions.
We don't offer paid signals or account management services.
Beware of scammers using our name - we are not connected to them.

BTC Big Direction is Sell Side At Time BTC move is consolidation Not Found Clear up and Down Move ,Wait for Clear Move for BUY side in GREEN Line & SELL side for a RED Line

ETHUSD Sell Pressure Current Price Goes up and hits the Sell Order Block for a Bearish and also have a Resistance Point, after these Done Price Come Back to Sell at Consolidation 2935.66 to 2917.91 point . When Price will Close the 2916.61 Price Then Price Should be Clear and Quickly Goes Down at 2773.21 Near About. Now Lets see what they Does.

Gold Struggling at Higher Volume Area For Bullish SideFriday Night Gold Closed at High Volume Area as per (Fixed Volume Range) Price Hit the Order Block Point at 4510.000 and its Come Back to Up Side, also 3rd Conformation is Touch the trend-Line and Most important is Normal Volume is Goes to Down-Side its Mean Price Move to Buying Side ,But One More Conformation Need Price Closing required Above at 4535.033 Area. Now lets see What Gold does.

GOLD Buy Near at POI Now at time gold have a selling pressure price is 4508.235 But its will be come Down at 4464.833 round about +-, and that point have a clear Order Block , Fixed Volume Range that mean Showing Clear BUY Pressure also we another conformation is 3rd Time Trend-Line Touch and Volume at time Time is Down. Now let's see what gold does.

GOLD Again Buy OpperunityGold excite Point of interest area (POI) , where have Major POI ,Valid order block and also FVG , trend-line 3rd touch , Liquated Area and Fixed Volume Range

EURUSD Buy After Few Conformation Now at This Time Price 1.1774 Area. at time point price goes up near 1.1780 its a Internal High Level then price come to down at 1.1756 (its a Order Block area, Golden zone and also fixed Volume range)as par technical analysis May be possible Price Liquated sweep 1.1747 Then Find Clear up side Buy Conformation be carefully take all entry as per yourself .that is our analysis

GBPUSD 1H Buy Direction , Find Buy Entry Now at this time Price Moving at 1.33950 , Price Struggling to move Down Possible at 1.33704 where have Fibonacci GOLDEN ZONE Area ,1H Order Block that , up side Trend-Line also showing Clear Buy Direction But one more you must to be know 1.33566 is SUPPORT Area May be Possible hit and goes down and hits ALL SL Because this is a Liquated area and then Price GOES UP a BUY Side ,these all possible points where you want to BUY

XAUUSD BUY Opperunity With Patience At This Time Gold Move in Internal Structure, price May be possible lit bite move up near at 4332.999 Area. if any one want to SELL that is a Great AREA for SELL on On your confidence and Conformation, they SELL Target is 4304.536 and that is point where Price again move Up for BUY Direction on a Maximum Higher side, ( have Look a Chart for BUY Side R:R) above 4374.852 as per Technical Analysis

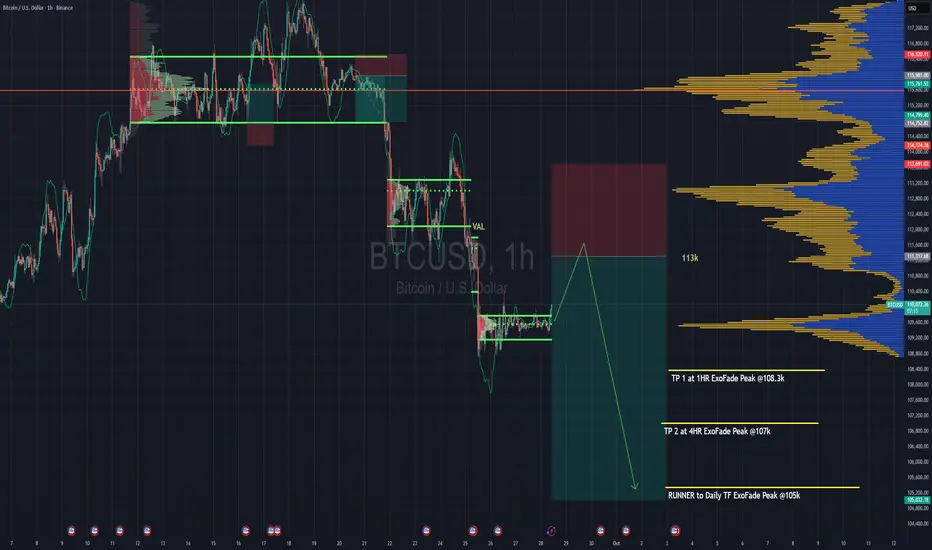
Looking to Short Bitcoin From Here : Winter Is Coming !!Looking to short BTC for a continuation of the downtrend.
Trend is your friend is what they say.
So we're basically going to wait for a pullback to 113k range then enter a sell.
The sell entry caters for both H4 & Daily timeframe trend, so it's a strong one.
The sell entry range also has the VAL of the last rotation we had from Sept 21st to Sept 24th when we finally broke down from it at 112k. That VAL should be a strong point for rejection, it'll be one of the places where we'll truly get to test the strength of the bears ( that's if we even make it that far )
TP targets are based on ExoFade peaks of the H1, H4 and Daily timeframe.. You can add the ExoFade to your charts to follow on your own charts as well.
VAL - Value Area Low of the volume profile
Strategy => Volume + Trend + Lots of coffee
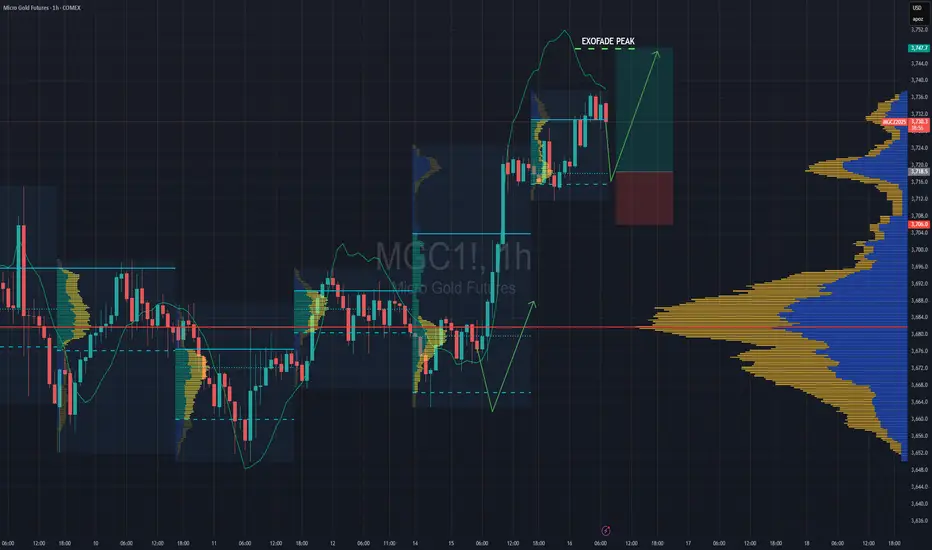
Gold Futures Day Trade Long EntryDont have enough time to go too into details on this one.
-Trade entry is based on Session Volume profile
- LVN on Visible range profile
- Entry at VAL - will likely get triggered during NY session today
- Weekly & Daily VWAP levels
Enjoy !!
Heads Up !! BTC Long Entry Incoming, Don't Miss ItThis is yet another Volume profile VAL long entry that is in line with the LVN of the current rotation we've been in since Sept 11.
Other strong confluences for this entry i did not show on this chart to keep it clean, but visible on my personal chart are
1. Entry is at Monthly VWAP
2. Entry is also at 1 SD from Weekly VWAP
Definitions
VAL - Value Area Low
LVN - Low Volume Node or Area
SD - Standard Deviation

PUMP SOMETHING LIKE THIS!!PUMP is now in price discovery and that means the only place to look for a long trade to join the PUMP is the previous pivot lows getting swept which will show us a clear defined area to put our stop-loss.
Calculate Your Risk/Reward so you don't lose more than 1% of your account per trade.
Every day the charts provide new information. You have to adjust or get REKT.
Love it or hate it, hit that thumbs up and share your thoughts below!
This is not financial advice. This is for educational purposes only.

NAS100USD Analysis – POC Magnet, Demand Zone🔎 Context
Price action on NAS100USD is currently trading within a clearly defined range between the Value Area High (VAH) and Value Area Low (VAL) . Volume Profile highlights a key Point of Control (POC) around 23150 – the price level where the highest amount of trading volume has accumulated in this range.
In Smart Money terms, we also have a refined demand zone forming below, with the proximal line aligning closely above the POC. This overlap strengthens the case for the POC acting as a "magnet" and a potential support base.
⚡ Key Levels
Value Area High (VAH) : ~23880 – range resistance.
Value Area Low (VAL) : ~23010 – range support.
POC : ~23150 – high-volume node, magnetic level.
Proximal Line : Sitting just above POC, marking the edge of demand.
Refined Demand Zone : 22950 – 23050 region.
🏗 Structural Insights
A major structural failure occurred earlier near 23880, confirming supply above.
Price swept liquidity below 23050 before aggressively reclaiming the range.
Current trading sits just above POC and proximal, showing buyers defending.
A break and acceptance above 23510 (mid-range) opens the path back to VAH at 23880.
✅ Trade Scenarios
Bullish Case (Continuation to VAH)
If price sustains above 23516 and holds above the proximal/POC cluster, we can expect a continuation toward VAH (23880).
Targets: 23880 (VAH) → potential extension toward swing high.
Bearish Case (POC Magnet + Demand Retest)
Failure to hold above proximal/POC may drag price back into the POC magnet zone at 23150.
If momentum weakens further, a retest of the refined demand zone (22950 – 23050) is likely.
Below VAL (23010), imbalance could drive a deeper correction.
📌 Conclusion
The confluence of POC (fair value) and proximal demand (structural support) makes 23150 a pivotal level. Holding above it favors a continuation toward 23880 VAH , while a rejection would likely see price revert back to demand.
This setup showcases how Volume Profile levels (POC/VAH/VAL) can be combined with SMC concepts (demand zones & structural breaks) to create a high-probability framework.
💡 Trade safe, manage risk, and always wait for confirmations around these key levels before execution.
