BITCOIN NEW All Time Highs Soon!!!Value Area High of previous bullrun has officially been broken through!!
There's not too much left stopping Bitcoin from reaching ATH's!
Let The Fun Begin!
Calculate Your Risk/Reward so you don't lose more than 1% of your account per trade.
Every day the charts provide new information. You have to adjust or get REKT.
Love it or hate it, hit that thumbs up and share your thoughts below!
This is not financial advice. This is for educational purposes only.
Fixedrangevolumeprofile

BONK SUPER CONFLUENCE!! BULLISH Support Zone!Massive confluence here at support!! VAL, Weekly, Daily, Golden Pocket, HTF POC...
BULLISH IF PRICE CAN HOLD THIS LEVEL!
Calculate Your Risk/Reward so you don't lose more than 1% of your account per trade.
Every day the charts provide new information. You have to adjust or get REKT.
Love it or hate it, hit that thumbs up and share your thoughts below!
This is not financial advice. This is for educational purposes only.

GRT analysisIn the 1-hour chart, I analyze the fixed range volume profile for over 2 months. The highest trading volumes are clearly visible, which also makes the prices strong points. At the moment, it is at a support point, but if the downward trend of the last few days is followed, it is highly likely to rebound to the price of 0.1245 euros and then we may have an inflow of capital to go to the next strong level which is 0.1741 euros. If there is low volatility, and thus small trading volumes for the next few months until the halving, it is likely to consolidate at prices close to this level or even to the one below. From my experience with GRT, it will follow the latter.

Weekly Price Prediction: $78.00 (Min) and $87.50 (Max)Most of the technical analysis from last week still stands true but I have added a new Fixed Range Volume Profile from the last peak and a resistance line from there as well.
Projected Price Range
The anticipated weekly price range for Brent Crude Oil is expected to fluctuate between $78.00 (Min) and $87.50 (Max).
Contended Price Levels
$81.00 - $78.00 High Volume Node - Potential Support
$81.00 - $83.00 Resistance Lines - potential resistance
$84.50 Point of Control - potential resistance
Technical Analysis
Fibonacci Retracement Breakout:
The price is above to hit the 0.5 Fibonacci retracement level which could indicate a level of resistance.
Volume Profile Analysis:
The Fixed Range Volume Profile from last week still stands. As you can see the price went down to the bottom High Volume Node (HVM) and found support.
Point of Control (POC): Identified at $84.50, indicating a level of potential future resistance and good liquidity.
High Volume Nodes (HVM):
Bottom HVM: Signifying an area of good liquidity and a potential support region, preventing a rapid decline from the 0.5 Fibonacci breakout.
Upper HVM: Acting as both a resistance level and a zone where the price has historically stalled after the first peak.
Low Volume Node (LVM): Reflects a lack of liquidity, leading to rapid price movements. Notable price fluctuations occurred between October and November in this region, ranging from $91.00 to $87.00 and back up to $90.00.
MACD and Stochastic RSI:
Last week the stoch RSI (Bottom indicator) crossed over but the price then declined but as you can now see the RSI is showing higher lows and higher highs suggesting there is a good trend of price moving upward. This is further expressed by the MACD (top indicator) not having crossed over yet, but about to, showing a reason for bullish movement.
Additional Factors
Prior Support/Resistance (Blue Line):
Just above the Bottom HVM, a blue line represents a prior support/resistance level. This is now a potential resistance level as the price seems to be reaching there.
Above the price, there is also another resistance level shown by a blue line that's drawn from the peaks of the latest peak to the trough.
Geopolitical Events:
Given the volatile nature of the commodities market, traders are advised to stay vigilant regarding any geopolitical events in the upcoming week, as these events can significantly impact oil prices.
Conclusion
In summary, our analysis reaffirms the high volume nodes (HVN) as robust support levels, supported by the encouraging indications from the MACD and Stochastic RSI favouring a potential upward price movement, targeting the breach of the point of control (POC) towards the low volume node (LVN) level. However, prudence dictates a cautious stance due to the presence of two distinct resistance tiers and the historical resilience demonstrated at prior POCs. Consequently, we've expanded our projected price range to accommodate these intricacies. Traders are advised to exercise caution by implementing tight stops, recognising the market's potential for fluctuations within this nuanced landscape

Mastering Crypto Trading with Fixed Volume Range Profile 📊🚀Fixed Volume Range Profile (FVRP) is a powerful tool for crypto traders seeking deeper insights into market dynamics. It allows you to visualize price and volume data in a unique way, helping you make informed trading decisions. In this comprehensive guide, we'll walk you through the fundamentals of using Fixed Volume Range Profile for trading cryptocurrencies.
Understanding Fixed Volume Range Profile (FVRP):
FVRP is a graphical representation of price and volume data within specific price ranges. It divides the trading range into equal volume intervals, providing a snapshot of where most trading activity occurred. Key elements of FVRP include:
Price Range: The trading range under consideration, typically from a few hours to several days.
Volume Intervals: Equal-volume increments within the price range.
Profile Bars: Vertical bars representing the volume distribution at each price level.
How to use it ?
1. You need to open any stock/crypto/indices that you want .
2. Look at screenshot to open this tool 👇
3. Attach first point to the start of impulse (Highest point before trend change) and second to the end of impulse (Lowest point of impulse) . Or identify biggest trading volumes in a range 👇
Some more samples 👇
Using FVRP for Crypto Trading:
Now, let's explore how to utilize Fixed Volume Range Profile for crypto trading:
1. Identifying Key Levels:
Start by selecting the cryptocurrency and the specific timeframe you want to analyze.
Plot the FVRP on your chart. This will create profile bars within the specified price range.
Pay attention to areas where the profile bars are the tallest or thickest. These represent high-volume nodes and are crucial support/resistance levels.
2. Trading Signals:
High-Volume Nodes: When the price approaches a high-volume node, it often acts as strong support or resistance. Look for potential buy/sell signals near these levels.
Gaps: Gaps between profile bars indicate a lack of trading activity in that range. Breakouts from these gaps can signal strong price movements.
3. Combining with Other Indicators:
To enhance your trading strategy, consider using FVRP in conjunction with other technical indicators like Moving Averages, RSI, or MACD.
Confirm your signals with multiple indicators to reduce false alarms.
4. Risk Management:
Always use stop-loss and take-profit orders to manage risk.
Determine your position size based on your risk tolerance and the distance to your stop-loss.
5. Monitoring Market Sentiment:
FVRP can provide insights into market sentiment. For example, a concentrated volume node near a resistance level may indicate strong selling pressure.
6. Backtesting:
Before trading with real capital, practice using FVRP on historical data to refine your strategy.
Conclusion:
Fixed Volume Range Profile is a valuable tool that empowers crypto traders with a unique perspective on market data. By identifying key support/resistance levels, gauging market sentiment, and combining FVRP with other indicators, you can make more informed trading decisions.
However, remember that no single tool guarantees success in trading. Always approach the market with caution, practice risk management, and continuously educate yourself to stay ahead in the ever-evolving world of crypto trading. 📊💹🚀

XRPBTC Possibly The Most Bullish Chart In Crypto!I applied the fixed range volume profile tool to the history of XRPBTC pair on Bittrex on a weekly timeframe. It shows a very well defined clear level of support and resistance formed by the POC.
This has to be the most bullish chart out there. No doubt once XRPBTC breaks out of this zone, it will significantly outperform BTC.
This is a regular scale / nonlogarithmic chart, which I think gives you a better image of what XRP can do once it breaks out of this range.

Fixed Range Volume Profile, How do I use it?I can say that Fixed Range Volume Profile is strong tool to determine targets and stop loss, POC point of control as per my research represent a central price and bar close price is turning around it, so when you assign take profit and stop loss as per it, you reduce the risk and have a plan B to manage your trade.
as you see in above chart for BTCUSD, we have trend line on daily time frame, I cut the chart to 3 successive zones representing 3 cycle, 1 cycle is from the trend to trend and applied "Fixed Range Volume Profile" on all 3 ranges/cycles, last cycle has not finished yet, and I show POC1, POC2 and POC3 prices.
I consider this line as central price for a range and we can see how price keep moving above and down POC1 & POC2 prices.
for the last range/cycle (not completed yet because it has not reach the uptrend line yet, we see POC3 = $30,200 and the current price $29,590 so price is under POC3 and we can guess it is going to trend at approximately $27,750, this is 1st hint.
2nd hint is to take "Fixed Range Volume Profile" for the all uptrend, did you notice it? I think the price is going to POC(all range) = $28,300 (support)
Now we came to the best part of our subject, the what if question and how to set up a plan?:
what is stop loss?
we need a 1H bar close above POC3= $30,200+100= $30,300 (resistant) and we buy target $31,380 (you should know why!) and for stop loss, we need close price 1H again down $30,200
what is take profit?
we can set $28,300 for safe and $27,750 if you want to risk a little bit, this is first target, but what if bar 4h close down POC= $28,300? here we can set a 2nd take profit at $26,400 (you should know why!)
this is what I wanted to share with you and I will be glad to answer your questions.
I did go short for BTCUSD this morning, enter price $29,165 and I set a take profit at $29,322 because I am working on 15 min timeframe.

WHAT'S HAPPENING? ⚡️ SUPPLY AND DEMAND IN LOCKSTEP 😢In this video I explain the current state of the Bitcoin market as seen through the lens of the latest pattern found in the forecast model, "The Lightning Volume". The Federal Reserves interest rate policy continues to create considerable headwinds for the Bitcoin price. When could it end? Watch this video and let me know your thoughts? Thanks for watching!

BTC are within POC monthly, but there are risk for it tooFrom the chart, i've used the Fixed Range Volume Profile (FRVP) and from monthly chart it shows that Bitcoin is in Bullrun position, also at the price range of 17k to 22k are inside the Point of Control (POC) area that might explain why there are sudden bullrun recently. This area might be a rebound area for the price to continue bull run, but there are also some risk that if the market turn into another bear than i expected that Bitcoin will fall maximum at 14,5k area. Finger crossed🤞, lets hope for the best

Short DigitalBits (XDB) TO Around $0.0061My ceiling and floor prices for DigitalBits (XDB) are $0.0070 and $0.0058, respectively.
Eight Chains printed a short signal.
Our entry is $0.00677325 and our take profit targets are $0.0061 and $0.0058.
I have a stop loss at $0.00704418.
This is not financial advice. I am not your financial advisor. This is my opinion.

ETHUSDT - Bullish Volume +20% LongSETUPHi Traders, Investors and Speculators 📈📉
Ev here. Been trading crypto since 2017 and later got into stocks. I have 3 board exams on financial markets and studied economics from a top tier university for a year. Daytime job - Math Teacher. 👩🏫
I hope you had a great weekend ! We're waking up today seeing altcoins gaining ground on BTC. This is a good sign, alts like ethbtc holding their ground whilst BTCUSDT slides lower. This indicates a rotation from liquidity (money) out of Bitcoin and into altcoins.
Today's analysis is on ETHUSDT and we're taking a look at the fixed range volume profile tool. This provides us with a POC (point of control) which we can use to determine a potential short term target and a bullish long-setup that could reward 20%.
While you're here 👀 Check out other altcoins with great potential that I'm watching for the last few months of this year:
_______________________
📢Follow us here on TradingView for daily updates and trade ideas on crypto , stocks and commodities 💎Hit like & Follow
We thank you for your support !
CryptoCheck

XRP - Trading Ranges This week XRP has started to lead the way in the altcoin market. We've spend months at 30 cent price area. This is an price area at which XRP price historically spend most of the time, so it presents a good historical support.
Just like with my last idea on BCH trading ranges, it goes the same for XRP. We have started to poke through red trading range and are testing next one. FRVP (Fixed Range Volume Profile- blue bars on the left) indicator suggests that we are testing second strongest resistance level range that is from around $0.50 - $0.68 (yellow). I am positive that we will go there, maybe even run through it to the 3rd level and than fall back to the 2nd one to range and slowly move up again with an increasing speed. It is a speculation so it is impossible to really know.
I also expect that the level 6 if not before, can turn us back down a bit before continuation upwards. In my eyes we cold still fall from 6th range to the 3rd one that held us for 4 months before the start of last capitulation in April.
Given on how delaveraged altcoin market got, coupled with how XRP has moved up in the past after setting a clear bottom, it is also a possibility that we just explode upwards, should the short squeeze happen both with fiat pairs (XRP-USD) and btc pairs (XRP-BTC).
I am not a financial advisor so non of this should be taken as a financial advise.

BCH - Trading Ranges To OvercomeWe obviously fell a lot with BCH, but still price did not broke any multi year supports, set back in 2018. With such fall those yearly price gabs were closed and i am very positive that the bottom is in for BCH and other crypto.
There is gonna be plenty of resistances back to the top. Those resistances are trading ranges or price areas where larger trading volumes have occurred. It is where i expect that price can pause out and start ranging for a while. First we need to get out of the first (orange) price range and visit a second (blue) range. I expect that once we really start going we should be there really fast just because there are a ton of shorts in the market right now and shortsqueeze can happen easily.
As for the 3rd price range ...I still think that we will go to the third trading range nd even .618 fib. retracement level (green arrow), but before that, price will probably have to work out lower between 2nd and 1st trading range before continuation upwards. I can be really wrong. No one knows really. it is a speculation based on historical price behavioral.
I am not a financial advisor so non of this should be taken as a financial advise. Be well.

EURUSD : Fixed range volume profile analysis In forex the best suitable time frame is 4 hour. It gives us overall idea of trend. And if we add Fixed range volume profile gives idea of a important level in a range where we should keep our eyes.
In this chart of EURUSD (4 hour) fixed range gives the level at 1.02 means that the level of 1.02 is quite hard to break. In this zone both bear and bulls are trying to break their level.
Here are some target level for EURUSDT:
I believe that if the major level of 1.02 breaks than first target could be 1.0115. And if the market act in sideways direction them the range will be 1.028 to 1.0115.

BTC dump and what to expectRight now there is panic due to America releasing the official statistics, BUT BTC is still the most stable thing on the market to invest into as some people say. I drew some price predictions and other stuff.
The fixed volume shows the price that people most buy out BTC and I left the pivots there for you (Weekly).
There is a technical flat for the last 1000 bars, but that's due to the fact that we are gathering the power for some huge price movement at the moment.
For the indicator DM @Sadesguy

VRVP and Fixed range profiles.In this post I wanted to do a breakdown of how to combine two profiles, so we had this big fall away from the VRVP, we had declining sized bars, we had less orders in leymans terms, so we can use a fixed range profile of the fall away to get a better reading of the orders in detail in the fall, remember VRVP gives a big scope, fixed gives a narrow scope, so price entered an area of Low volume which I labelled in the chart.
So we now look at the fixed range profile we see the largest bar of the fall, which I have labelled with the green chequered line, so price is miles away from fair value on the VPVR, it naturally wants to return here as shorts close their positions, and buyers find value in the currency, so we wait for the fixed profile to break chequered line and we aim back to the volume build up, and I want you to start calling this 'fair price', see how simple and easy that was?
So when price leaves the main VRVP use a fixed range on the down move to find the POC (Point of Control) AKA green chequered line, and aim back to the fair price, this is how you find value when trading!
Now when you see these crazy moves, I want you to break them down in a sensible and logical approach, treat trading like a business! become a master of finding Value!
More to come! ZenFlo

DDOG Bat harmonic possibilityIf we can close of the month above $86.33 this would help confirm our Bat harmonic here and one can say would be bullish for cloud and tech stocks in general
- .886 retracement
- previous range POC
- 1.272 extension from the top
- Bat harmonic
- .75 speed fan

MKRUSDT market structure through Support and Resistance levels1. MKRUSDT trading pair is in a global downward price channel.
2. The violet zone is the price area where the most amount of volume was traded.
Through identification of areas of support and resistance, we identify areas in the market which will form barriers to the trading timeframe trend. We`ve defined our battlefield. Price then moves within the framework defined by these levels, back and forth between levels of support and resistance, based on the decision making of traders.

ENJUSDT levels of support and resistanceDuring the conduct of your analysis it is imperative that you remain aware of the whole area, even though your chart may show support and resistance represented by a single line. Be aware that the price may turn before the line; and that a break of that line does NOT necessarily constitute a break of the support and resistance level.
*Notice, that the violet zone is the price level where the most amount of volume was traded.

EURUSD - BEARISH MOVE 📉THE EURUSD PRICE reached a daily resistance level.
the key level has broken, so i predict a bearish move📉
TARGET: 1.12921 🎯
if you enjoyed this IDEA, please leave a LIKE, SUBSCRIBE or COMMENT!

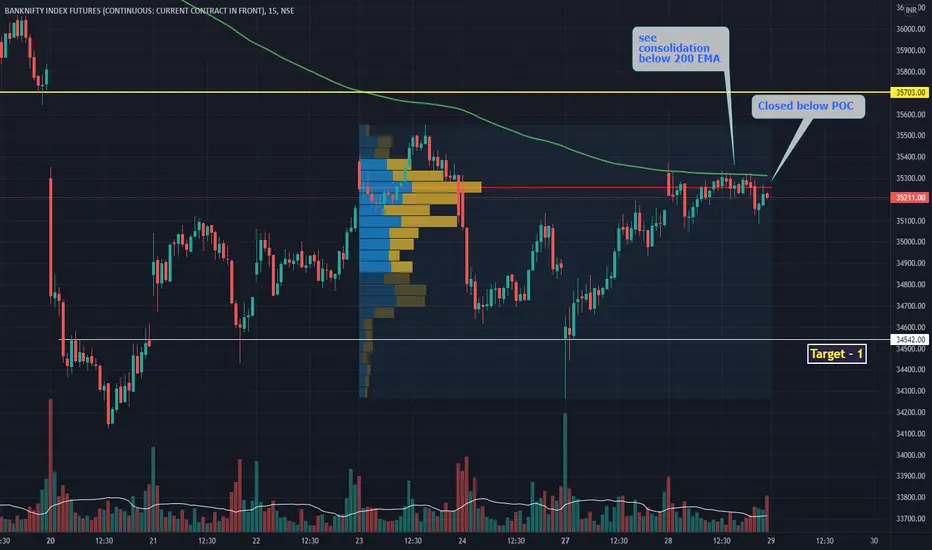
Bank nifty futureFixed range volume telling similar story. But we have to be very cautious for both of the sides. As 'Fakeouts' may come to trap retailers.
Hang Seng Index (HSI): Now or NeverAnalysis Forecast:
OANDA:HK33HKD Trading at Key Support.
Supporting Technical Observations:
1. Price trades at High Volume Node & Fibo 61.80% (Golden Ratio).
2. Volume and Fund Flow Index (FFI) displayed climactic supply.
Stop Loss
If index breaks below 24,800, expect further mark down.

USDJPY - Bullish ↗️ towards Level of High Volume Hi Traders!
The market is moving in a weak Downtrend.
A weak Trend is a Trend with valid Hs and Ls and accompanying deep Retracement Moves.
By the way: That's why Channels are almost everytime weak Trends.
At the left hand side, we have a Break of the Weekly Trendline.
After this Break we have Trending and Retracement Moves.
At the last Trending Move (towards 108.800), a descending Trendline occured.
This Trendline provides bearish Momentum, because everytime the price gets to this Trendline, it
gets pressure and moves lower.
Consequently, the Trendline could only be broken easily with high Bullish Momentum -
which we can see at the strong green candle.
This strong candle, let's call it the "Momentum Changer Candle" ,
comes with two functions:
Break of pressuring descending Trendline
Appereance of a strong Bullish Engulfing Pattern
So, as we declared that the market can easily go up, a question occurs:
Where to take Profit?
Remember, we still have a valid Downtrend.
For finding out where the market could return back, we use
the "Fixed Range Volume Profile" which shows as a so called
"Point of Control".
This tool can tell us where the market was highly volatile during a
fixed Range - we here began with the start of the Downtrend 'til now.
Imagine the Volume as a flood full of back pressure which can
push the price back.
If you have any questions, comments or feedback, leave a comment!
Thanks and successful Trading :-)
