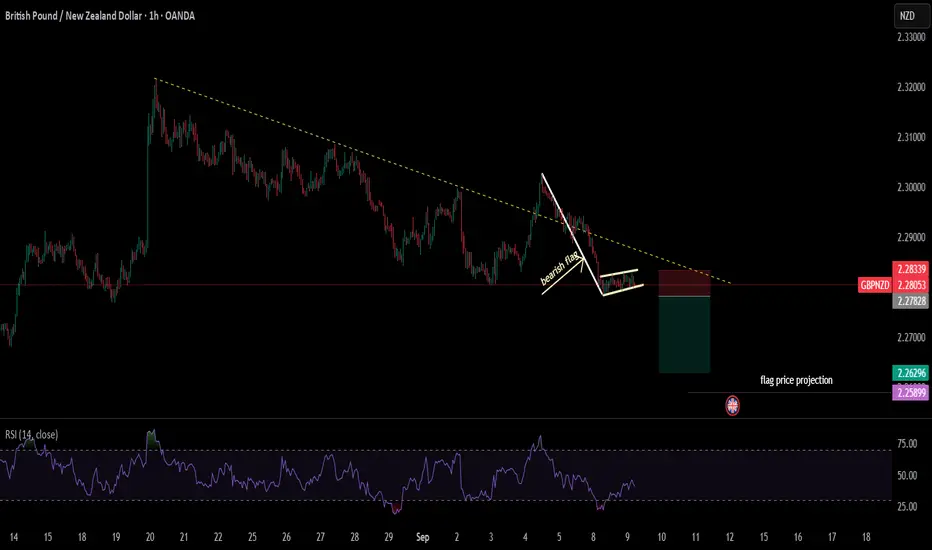
GBPNZD making bearish flag patternalthough price broke the trendline and at first that it could be a trend reversal but it was a fake breakout as price quickly recovered from that level and now trend seems bearish again
Flag
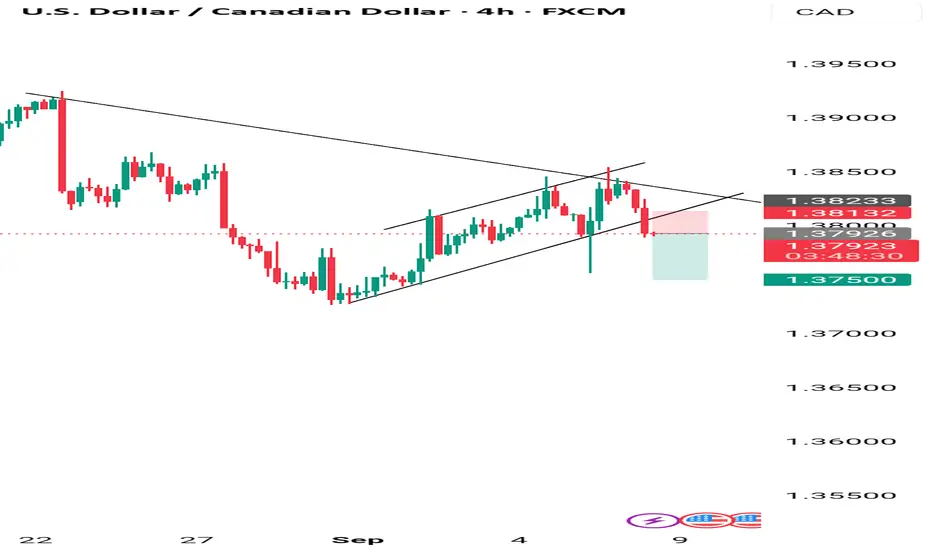
Possible SHORT on USDCADSo, there's kind of a Bearish Flag pattern break and it has broken out so I'm expecting a minor Sell. 🤞🏾
GBPCAD Strong Long ConfirmationsWait for a breakout and retest of this H1 TF bull flag and look to the left to identify current structure for TPs.
Overall bias is Bullish.

FETUSDT (D): Bullish Flag PatternFETUSDT
Daily
Bullish Flag pattern,
Current price range is forming a support zone.
Fundamentally, it has all the spices to justify the above analysis.
Enjoy the ride!

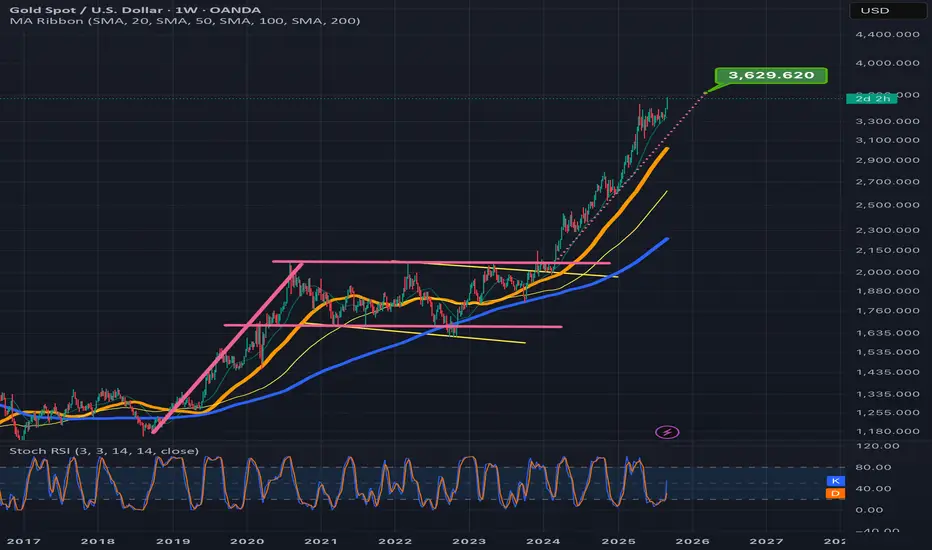
GOLD Bullish Flag and ATHsWe have a bullish flag breakout that requires a retest. However, if price does not give us any confirmations of a pullback, then we rely on Lower timeframe patterns and structure to continue to go long.
But the retest will happen - eventually.

U.S. Dollar Index (DXY) Outlook | Gold (XAU/USD) Correlation📈 U.S. Dollar Index (DXY) at Key Support | 🪙 Gold at Record Highs
🔎 Quick Summary:
• DXY holding 97.70 support inside a descending channel.
• A rebound could push it back toward 98.25 – 98.50.
• Meanwhile, Gold is sitting near $3,600/oz, at all-time highs, fueled by safe-haven demand and central bank buying.
• The DXY’s next move will help decide if Gold keeps climbing or pauses.
⸻
💵 U.S. Dollar Index (DXY) Outlook
On the 4H chart, the Dollar Index remains inside a descending channel. It has been forming lower highs and lower lows, yet the 97.70 level has repeatedly held as strong support.
• 🔹 Buyers are defending this zone, showing demand.
• 🔹 A rebound could take price back to the 98.25 – 98.50 supply zone.
• 🔹 A breakout above 98.50 would be significant, opening room toward 99.00+.
This makes the 97.70 region a critical turning point for DXY.
⸻
🪙 Gold (XAU/USD) Context
Gold is trading at record highs around $3,600/oz 🚀 — a level never seen before.
• 🌍 Central banks continue to accumulate gold aggressively.
• 🏦 Expectations of Fed rate cuts reduce the opportunity cost of holding gold.
• ⚖️ Persistent economic and geopolitical uncertainty is fueling safe-haven demand.
Correlation with DXY:
• 📉 If the Dollar rebounds, Gold could slow down or consolidate after its massive rally.
• 📈 If the Dollar breaks below support, Gold could see further upside, possibly testing higher targets near $3,700/oz and beyond.
⸻
📊 Conclusion
The Dollar Index is sitting at make-or-break support. A bounce would show Dollar strength and may cool off Gold’s rally. But if DXY weakens further, Gold could extend its surge into new record territory.
At this point, Gold remains the undisputed leader in the market, with DXY’s next move likely deciding how fast momentum continues.
⸻
⚡ Summary in one line:
💵 DXY at critical support — 🪙 Gold shining at record highs, waiting for the Dollar’s next move.


XRP - MacD selling divergenceCan you see it?
Don't forget the backtest out of the flag.
I don't think it'll be too big yet, they still want the daily pivot squeeze into Oct for the ETF's.
It also looks like coinbase isn't selling off XRP, big money are moving their XRP off coinbase itself into more secure places. Prepare yourself.

Wiki Is Ready for Next Leg UpAfter following Wiki closely and making a lot of money of the previous pump up, I feel that wiki is now ready for the next leg up. Notice the huge pump then the steep drop off, the consolidation and price is very quiet rt now. I took all my drawings and indicators off this chart view as it was cluttered. Wiki is just breaking out of the pennant flag rt now. I think we’ll see tremendous upside next few days. However, do not be surprised if it starts to move up and then drops down violently before starting the real uptrend.
Not financial advice I’m not a financial adviser. Just sharing some insights.
👊🏼👊🏼

Gold before NFP (what are the new targets?)Gold has recently reached a new all-time high at $3,578. In my view, today's NFP and Unemployment Rate generally favor the U.S. dollar, which could initially push gold lower toward the $3,500 level — a key psychological round number. However, in the bigger picture, gold still looks bullish both technically and fundamentally, especially with the Federal Reserve expected to start cutting interest rates soon. This could eventually drive prices higher, potentially toward $3,600 and beyond to new record highs.
short term targets: 3535 - 3527 - 3510
keep an eye on news...
Do not forget risk management.
good luck

XAUUSD Long- Fri, Sep 5, 2025I did open a long position on Gold yesterday hoping to get close to the ATH. Luckily it did and gave me a 1:4 rr. I guess this is it for gold so far and it is going to drop a bit for the foreseeable future.
what do you think??
-Moz
#XAUUSD #long #ATH

Silver (XAGUSD)– 15m | Descending Trendline & Demand BaseFOREXCOM:XAGUSD
Structure | Trend | Key Reaction Zones
Silver is trading under a descending trendline, with price rejecting from the 41.44 high. Multiple demand bases at 40.40–40.52 continue to act as support. Sellers are showing control after liquidity grabs at highs.
Market Overview
Price has been consolidating within a falling channel, with sellers pressing at each rally. Demand zones are still respected, but a decisive break below 40.40 could open further downside. Breakout above the descending trendline would flip sentiment bullish again.
Key Scenarios
✅ Bullish Case 🚀 → Bounce from 40.40–40.52 demand base could push Silver toward 🎯 40.87 and 🎯 41.06.
❌ Bearish Case 📉 → Break below 40.40 exposes 🎯 40.12 as the downside target.
Current Levels to Watch
Resistance 🔴: 40.87 / 41.06 / 41.23
Support 🟢: 40.52 / 40.40 / 40.12
⚠️ Disclaimer: For educational purposes only. Not financial advice.

NZD_CHF BEARISH FLAG|SHORT|
✅NZD_CHF is trading in a
Downtrend and the pair formed
A bearish flag pattern so IF we
See a bearish breakout then we
Will be expecting a further
Bearish continuation and
A move down
SHORT🔥
✅Like and subscribe to never miss a new idea!✅

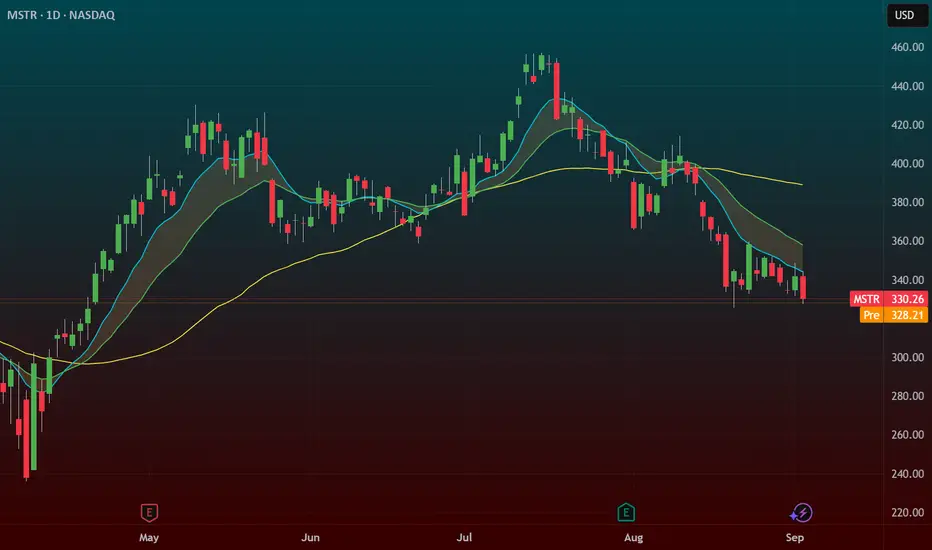
$MSTR – Bear Flag Breakdown SetupNASDAQ:MSTR – Bear Flag Triggering Despite Crypto Strength
MicroStrategy ( NASDAQ:MSTR ) has been drifting lower even as crypto has ripped the last few months — a clear sign of relative weakness. Every rally attempt has been faded, and now the chart is setting up a clean bear flag breakdown.
🔹 The Setup:
Price is pressing the $326 trigger level on a bear flag structure.
A breakdown here opens the door to $300 for the first cover zone.
Weak price action despite a strong sector = bearish divergence.
🔹 Market Context:
The NASDAQ:QQQ is flashing distribution signals — failed breakouts in momentum names and heavy selling under the surface.
If indexes continue to weaken, NASDAQ:MSTR could accelerate to the downside as speculative money comes out.
🔹 My Trade Plan:
1️⃣ Entry: Short on breakdown through $326.
2️⃣ Target: First covers into $300.
3️⃣ Stop: Above the flag highs — no need to fight if it reverses.
Why I Like This Setup:
Relative weakness vs. crypto = red flag for bulls.
Bear flag structure + clear trigger + defined target.
Broader market weakness adds conviction.
AUDNZD: Pullback From Support Confirmed 🇦🇺🇳🇿
There is a high probability that AUDNZD will rise from the underlined support.
A bullish violation of a resistance line of a bullish flag pattern on an hourly
time frame provides a reliable confirmation.
Goal - 1.1133
❤️Please, support my work with like, thank you!❤️
I am part of Trade Nation's Influencer program and receive a monthly fee for using their TradingView charts in my analysis.

Gold chart showing Technical Analysis at its bestTA doesn’t get much more exact than this. Gold beautifully displayed why TA is such a powerful manifestation device. Look how perfectly Gold broke up and then used the dotted measured move line as a staircase to climb its way to the full breakout target. Perfection. Those who’s off at TA as just imaginary or arbitrary lines, have not seen this kind of accuracy play outthe and time again as I have during my time as a technical analyst. Posting this as a prime example for posterity. *not financial advice*
Ingersoll Rand: Potential Bear FlagIngersoll Rand has struggled all year, and some traders may expect further downside.
The first pattern on today’s chart is the series of higher lows since a negative gap on August 1. The industrial stock ended Tuesday below that rising line, which could be interpreted as a bear-flag breakdown.
Second is the July 20 weekly close of $80.39. IR rebounded to that level last month but failed to stay above it. That may suggest that old support has become new resistance. (Stochastics also fell from an overbought condition.)
Speaking of resistance, you also have the February 14 high of $89.22. Prices stalled at that level twice in July.
Next, the 50-day simple moving average (SMA) had a “death cross” below the 200-day SMA in February and has remained there since. Has the long-term trend turned negative?
Finally, the 8-day exponential moving average (EMA) is below the 21-day EMA. That may be consistent with short-term bearishness.
TradeStation has, for decades, advanced the trading industry, providing access to stocks, options and futures. If you're born to trade, we could be for you. See our Overview for more.
Past performance, whether actual or indicated by historical tests of strategies, is no guarantee of future performance or success. There is a possibility that you may sustain a loss equal to or greater than your entire investment regardless of which asset class you trade (equities, options or futures); therefore, you should not invest or risk money that you cannot afford to lose. Online trading is not suitable for all investors. View the document titled Characteristics and Risks of Standardized Options at www.TradeStation.com . Before trading any asset class, customers must read the relevant risk disclosure statements on www.TradeStation.com . System access and trade placement and execution may be delayed or fail due to market volatility and volume, quote delays, system and software errors, Internet traffic, outages and other factors.
Securities and futures trading is offered to self-directed customers by TradeStation Securities, Inc., a broker-dealer registered with the Securities and Exchange Commission and a futures commission merchant licensed with the Commodity Futures Trading Commission). TradeStation Securities is a member of the Financial Industry Regulatory Authority, the National Futures Association, and a number of exchanges.
TradeStation Securities, Inc. and TradeStation Technologies, Inc. are each wholly owned subsidiaries of TradeStation Group, Inc., both operating, and providing products and services, under the TradeStation brand and trademark. When applying for, or purchasing, accounts, subscriptions, products and services, it is important that you know which company you will be dealing with. Visit www.TradeStation.com for further important information explaining what this means.

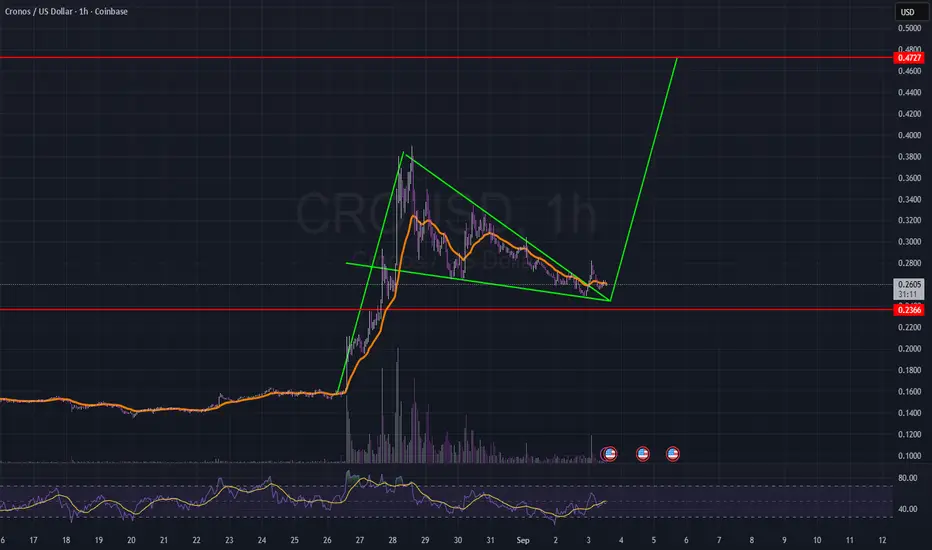
CRO Bullish pennantCRO broke out of bullish pennant. Possible to break down to last resistance. Anyway, my bags are full. Getting nice stake out of it.
EURCHF: Move Up Ahead?! 🇪🇺🇨🇭
I see a strong bullish pattern on EURCHF on a daily:
the price broke and closed above a resistance line of a bullish
flag pattern after a test of a critical demand zone.
With a high probability, growth will continue soon.
Next resistance - 0.9393
❤️Please, support my work with like, thank you!❤️
I am part of Trade Nation's Influencer program and receive a monthly fee for using their TradingView charts in my analysis.

XAUUSD (15m) – Breakout & Pullback From Supply ZoneFOREXCOM:XAUUSD
Structure | Trend | Key Reaction Zones
Gold broke out strongly above consolidation, reaching 3539 supply zone resistance, before pulling back. Price is now consolidating between 3524 – 3508 levels.
Market Overview
Momentum remains bullish overall, but short-term supply pressure near 3539 has triggered profit-taking. The 3508 support area is crucial – holding above it keeps the uptrend intact, while a breakdown could extend correction lower.
Key Scenarios
✅ Bullish Case 🚀 →
🎯 Target 1: 3539
🎯 Target 2: 3550
🎯 Extended: 3565
❌ Bearish Case 📉 →
🎯 Downside Target 1: 3508
🎯 Downside Target 2: 3491
🎯 Extended: 3475
Current Levels to Watch
Resistance 🔴: 3539 – 3550
Support 🟢: 3524 – 3508
⚠️ Disclaimer: This analysis is for educational purposes only. Not financial advice.

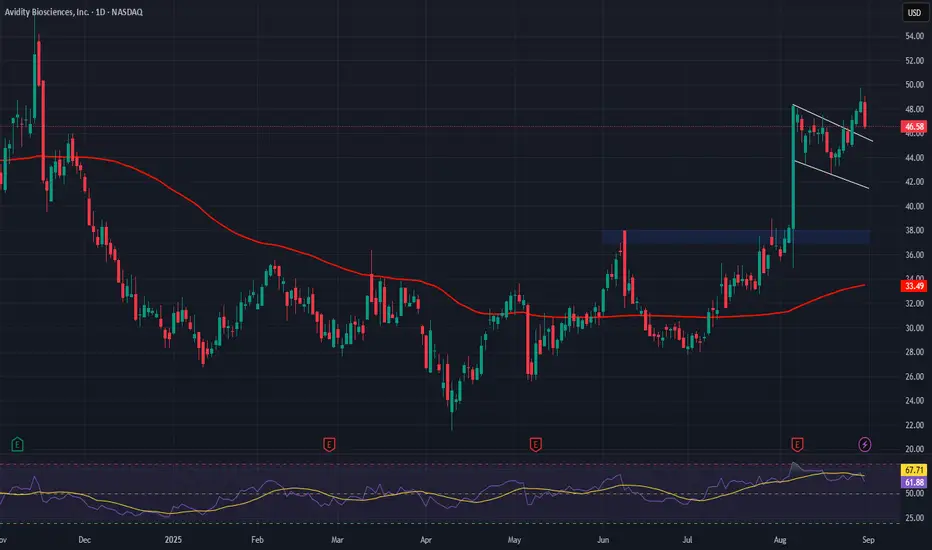
Avidity Biosciences (RNA) AnalysisCompany Overview:
Avidity Biosciences NASDAQ:RNA is pioneering RNA therapeutics with its Antibody Oligonucleotide Conjugates (AOC) platform, aiming at rare genetic diseases where no treatments exist—unlocking high unmet demand.
Financial Snapshot (Q2):
Revenue: $3.85M
Net loss: $157.31M (reflecting heavy early-stage R&D investment)
Valuation: P/S 529.67, P/B 9.27, signaling premium growth pricing by investors.
Technical View:
Stock has formed multiple bull flag patterns.
Breakout potential is strong after recent consolidation phase.
Investment Outlook:
Bullish above: $37.00–$38.00
Upside target: $70.00–$72.00, supported by pipeline innovation + bullish technical setup.
📢 RNA — premium biotech bet with rare-disease focus and breakout momentum.
#RNA #Biotech #Genomics #GrowthStocks #BullFlag #Breakout
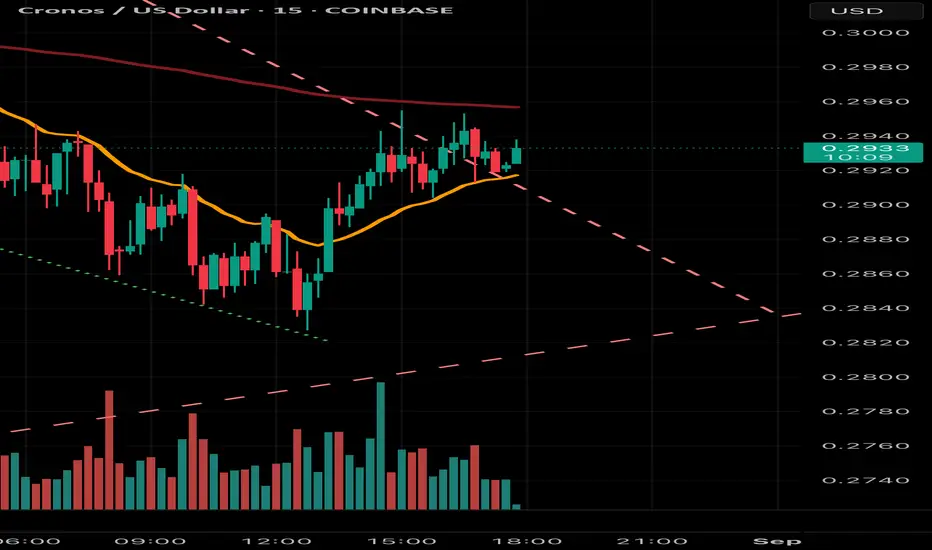
8, 15-min candle closes outside the pennant flagPrice is closing consistently outside the pennant flag on the shorter timeframes. This is a good sign that the continuation is close. Price is just creeping out sideways, at some point it’ll move up more quickly.
KC | Massive Break Out Incoming | LONGKingsoft Cloud Holdings Ltd. provides cloud storage and cloud computation services. It offers cloud platform consisting of cloud infrastructure, cutting-edge cloud products and architected industry-specific solutions across public cloud, enterprise cloud and AIoT cloud services. The firm's products include computing, networking, storage & CDN, database, data analysis and security. It offers medical & healthcare solutions, supply chain finance solutions, e-government solutions, internet of vehicles solutions, media cloud solutions, big data education & training solutions, cloud integrated service and cloud gaming service. The company was founded in 2012 and is headquartered in Beijing, China.
