SUDARSHANCHEMSUDARSHANCHEM showing very good strength and consolidating since a month near ATH. Result is expected tomorrow on 25-Aug. If it declares bumper result then we may see next leg of steep rally. In recent time accumulation has been observed. Provided that if it closes above 1380 level then one may get very good risk-reward trade from hereon. Keep a stock in watch list. Just a small volume may push it above resistance line.
Flag

Bullish Flag Pattern Zora has formed a bullish flag pattern and can climb as high as the flag's length.


UNI UPDATE (4H)After completing a five-wave impulsive move to the upside, UNI now appears to have entered a corrective A–B–C pattern.
Additionally, a head and shoulders formation has already broken down and been retested, further confirming bearish momentum. All signals currently point toward a downward continuation.
On the 15-minute timeframe, a mini bear flag has also formed, which strengthens this bearish outlook.
Good Luck.

PSX: Haleon - Weekly TF - Long positionContinuation pattern for Haleon
Long position.
Important note:
If the medicine prices are regulated by the government again, this could have -ve impact and hamper the continuation.

XAUUSD (Gold) – 4H Outlook | CAN BE BULLISH?Structure | Trend | Key Reaction Zones
Price broke out of a falling wedge pattern 🔻➡️🚀.
Retested the 3330 support zone ✅ and surged strongly.
Now hovering around 3375, testing previous breakdown structure.
Market Overview
📈 Bullish Case → If 3375 holds, momentum could extend higher:
🎯 Target 1: 3385
🎯 Target 2: 3409
📉 Bearish Case → If rejected near 3375/3380, possible pullback:
🎯 Target 1: 3358
🎯 Target 2: 3351
Current Levels to Watch
Resistance: 3375 – 3409 ❌
Support: 3358 – 3351 ✅
Disclaimer
This analysis is for educational and informational purposes only. It is not financial advice. Please conduct your own research before trading.

EURGBPBairish momentum Changed into bullsih trend, Bullish Flag pattern found in EURGBP chart, which looks like bullish, expected entry point and stop loss mention with TP.

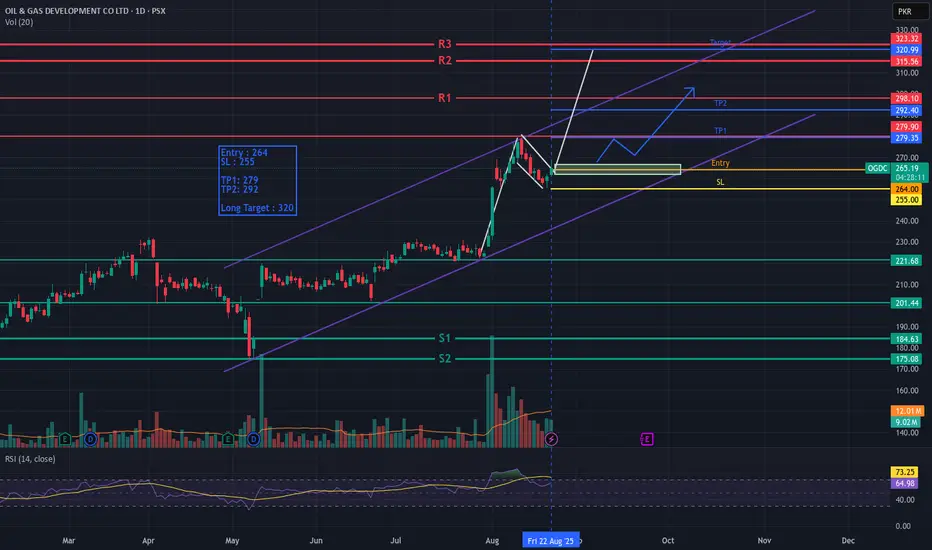
OGDC – Bullish Flag Breakout SetupOGDC has formed a Bullish Flag pattern, indicating potential continuation of the uptrend. The stock is showing strength and is likely to resume its upward momentum.
📌 Trade Setup:
Entry: 264
Stop Loss: 255
Target 1: 279
Target 2: 292
Long-term Target: 320
Risk management is key – position sizing should be adjusted according to individual risk appetite.
This setup is based on technical analysis and is not financial advice. Please do your own research before making trading decisions.
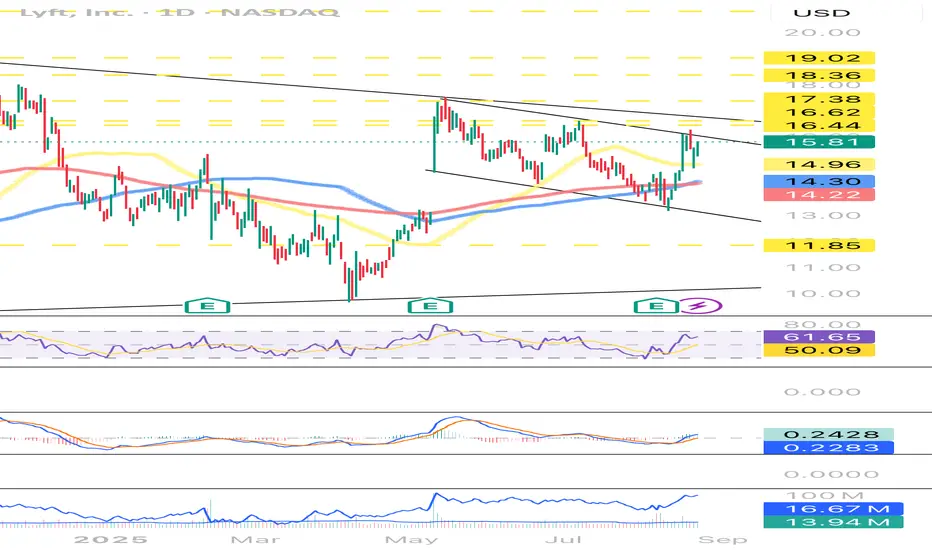
LYFT May Be Ready for a Bullish Breakout
Lift is currently sitting above the 50, 100, and 200 moving averages.
It just filled the gap it left from May earnings and since then it’s been consolidating while forming a bull flag pattern.
RSI is also trending higher but just crossed 60 leaving it room to run and MACD line has also crossed the signal line.
OBV has returned to its May levels and average volume has begun to rise a bit over the last couple of weeks potentially due to to the founders announcing they’re stepping away in Feb2025.
Until there’s a major change in buying sentiment for Lyft it’ll probably keep consolidating. Just needs some good news. Maybe those two founders stepping away could be the start.
XAUUSD | 1H Outlook | FALLINGWEDGE FAKEOUT BEARISH MOMENTUM🔍 Structure | Trend | Key Reaction Zones
Gold is respecting the bearish structure with a series of Lower Highs (LH) and Lower Lows (LL). The recent pullback towards $3348–$3350 is showing rejection from a key supply zone while still following the falling wedge structure.
🧠 Market Overview:
Previous accumulation attempt failed, keeping the bearish bias intact.
Price is retesting a strong supply zone ($3348–$3358) while sitting below the major LH trendline.
A breakdown from current levels could push gold deeper into the pending demand zone.
🎯 Key Scenarios:
🔻 Bearish Continuation (Primary Bias):
Rejection under $3350–$3358 could trigger a drop towards:
Target 1: $3330
Target 2: $3314
Target 3: $3300 – $3296 (Major Demand Zone)
🔼 Bullish Invalidation:
A sustained break and hold above $3358 would shift momentum, potentially targeting $3380–$3400 again.
📌 Current Levels to Watch:
Resistance: $3348 → $3358
Support: $3330 → $3314 → $3300
⚠️ Disclaimer: This analysis is for educational and informational purposes only. It is not financial advice. Please conduct your own research before trading.

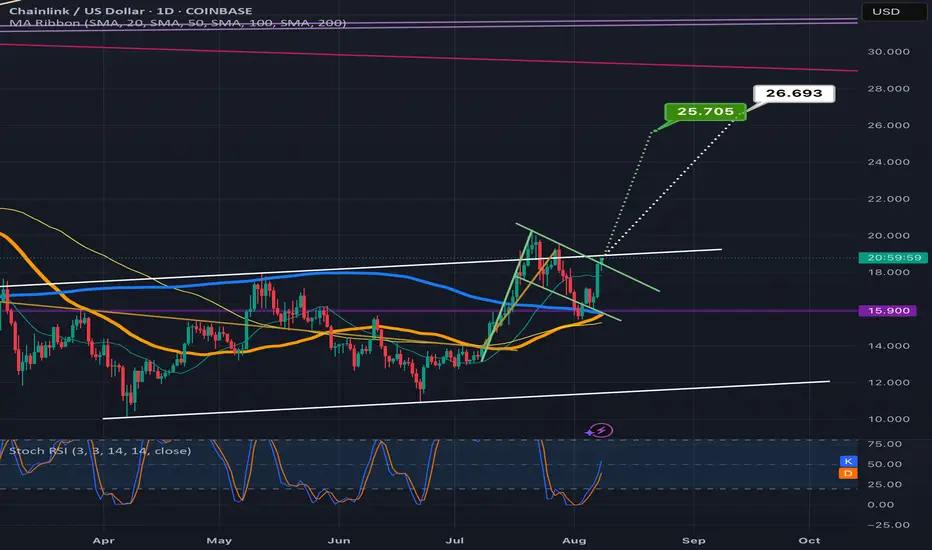
Chainlink looks ready 2 break up from bullflag & a double bottomGreen target is the bullflag white target is the double bottom. *not financial advice*
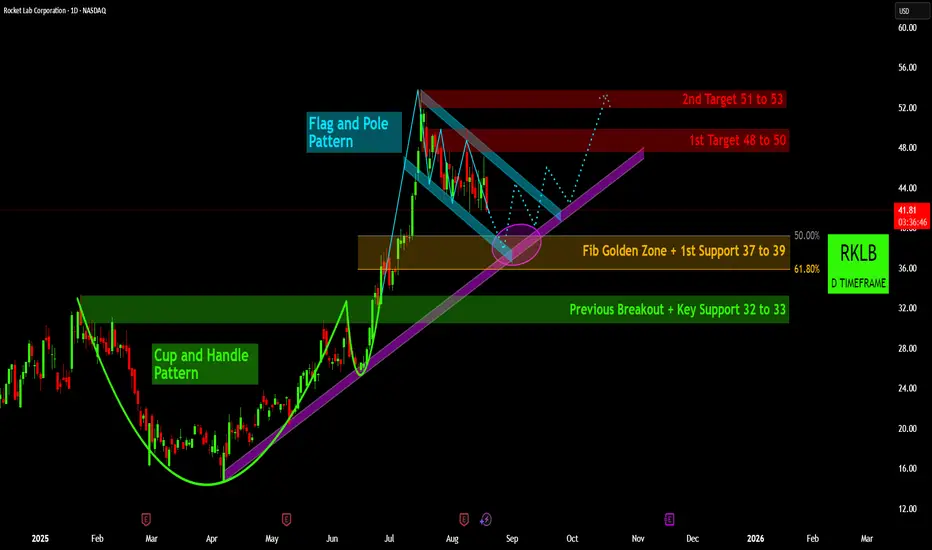
RKLB's Technical Blueprint: Is a Power-Up Imminent?🎯 RKLB's Technical Blueprint: Is a Power-Up Imminent? 🪐
Rocket Lab (RKLB) has presented a fascinating technical picture, displaying classical chart patterns that suggest a potential bullish continuation after a period of consolidation. My analysis points to key levels to monitor for future price action.
Foundation for Growth:The Cup and Handle Breakout: Earlier in the year, RKLB successfully formed and broke out of a well-defined Cup and Handle Pattern 📈, a classic bullish continuation signal. This robust formation propelled the stock into a strong rally, establishing significant upward momentum and highlighting investor conviction following its previous consolidation. This breakout set the stage for the subsequent price discovery at higher levels.
in.tradingview.com
Current Consolidation: The Flag and Pole Pattern: Following the sharp upward move, RKLB has entered a Flag and Pole Pattern 📉. Price action is currently consolidating within a descending channel, typical of a healthy correction after a strong run. This pattern often serves as a pause before the next leg up, allowing the market to absorb gains and gather energy for another significant move. Traders are keenly observing this phase for a decisive breakout.
in.tradingview.com
Critical Confluence Zone for Reversal: The stock is currently approaching a highly significant confluence zone 🟣. This area around $37 to $39 (identified as the "1st Support") aligns perfectly with the Fibonacci Golden Zone (50%-61.8%) and the lower boundary of the descending flag channel. Furthermore, a long-term ascending trendline provides additional underlying support in this same region. This convergence of multiple support indicators makes this zone a high-probability area for a potential bullish reversal and rebound. Below this, Key Support at $32 to $33 (the "Previous Breakout" level) stands as a crucial backup.
in.tradingview.com
Upside Potential and Price Targets: Should RKLB successfully find support within this identified confluence zone and break out of the descending flag pattern, significant upside targets come into play. Our analysis identifies an initial 1st Target range of $48 to $50 🎯, followed by a 2nd Target range of $51 to $53 🎯. The projected trajectory from a successful bounce within the confluence zone supports a move towards these higher price levels, confirming the continuation of the underlying bullish trend.
In summary, Rocket Lab's price went high due to the initial SPAC-driven excitement, coupled with a solid operational track record, a strategic pivot to vertical integration (beyond just launch), significant customer wins, and ambitious future plans (like Neutron) that promise to unlock larger market opportunities. It is crucial for investors to understand that Rocket Lab (RKLB) is a high-risk, high-reward long-term investment, and while the technical setup appears promising for a bullish continuation, market dynamics and company-specific developments will ultimately dictate its future trajectory. Monitor the identified support levels closely for confirmation of a potential move higher.
Disclaimer:
The information provided in this chart is for educational and informational purposes only and should not be considered as investment advice. Trading and investing involve substantial risk and are not suitable for every investor. You should carefully consider your financial situation and consult with a financial advisor before making any investment decisions. The creator of this chart does not guarantee any specific outcome or profit and is not responsible for any losses incurred as a result of using this information. Past performance is not indicative of future results. Use this information at your own risk. This chart has been created for my own improvement in Trading and Investment Analysis. Please do your own analysis before any investments.
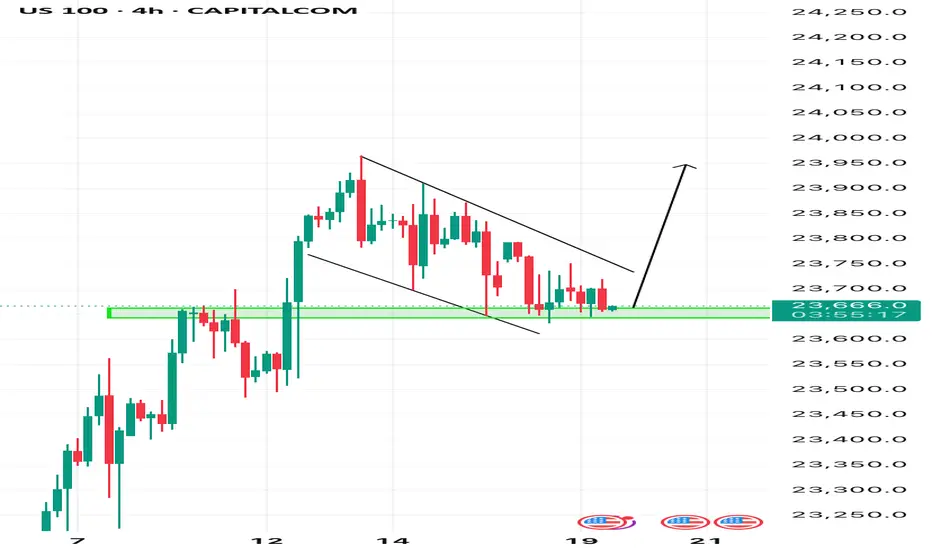
US100 - Bullish Flag setup US100 pulled back to the previous resistance looking to turn it into a support, the pullback comes in a correction manner forming a bullish flag pattern.
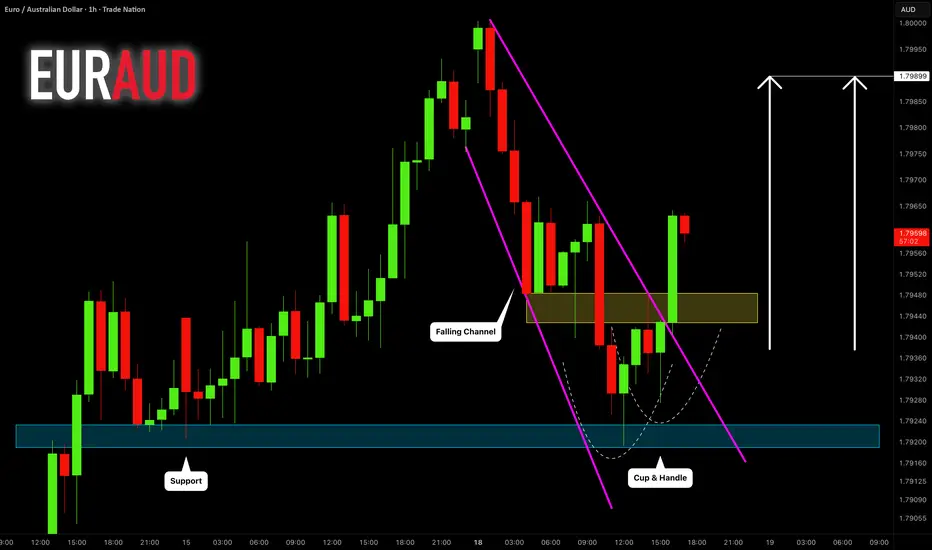
EURAUD: Trend Following Trading 🇪🇺 🇦🇺
EURAUD completed a correctional movement after a strong bullish wave.
The price nicely respected a key intraday horizontal support
and formed a cup and handle pattern on that.
Its neckline breakout with an imbalance candle provides
a strong bullish confirmation.
I expect a rise to 1.799
❤️Please, support my work with like, thank you!❤️
I am part of Trade Nation's Influencer program and receive a monthly fee for using their TradingView charts in my analysis.
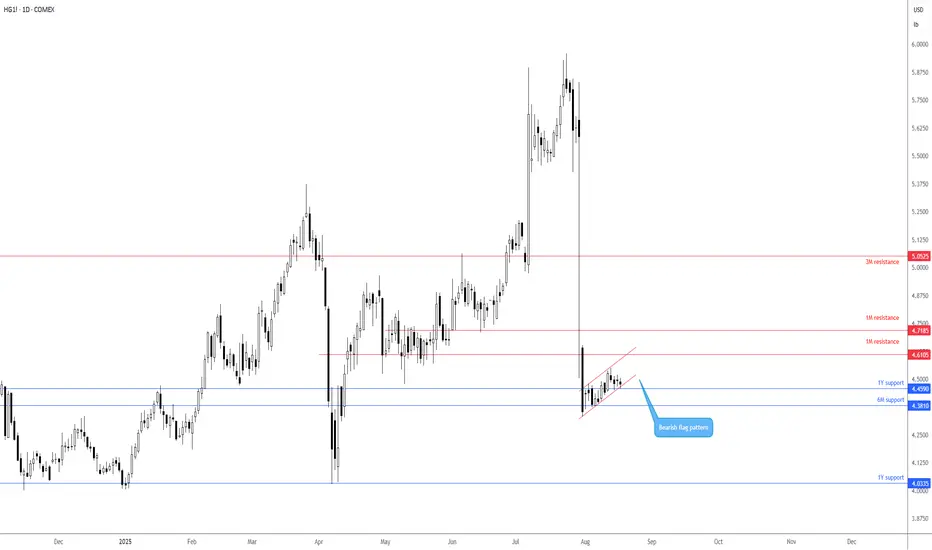
Potential bearish flag pattern on Copper futuresPrice action on Copper Futures shows that buyers and sellers have been confined between two ascending lines since the beginning of August, taken from the low of US$4.3325 and a high of US$4.4800. While this offers a potential bearish flag pattern to work with, the base metal is seen rebounding from support between US$4.3810 (6M) and US$4.4590 (1Y), with room for price to continue pushing higher until reaching resistance between US$4.7185 and US$4.6105 (1M levels).
As a result, price could continue to grind higher within the confines of the bearish flag until reaching resistance at US$4.7185-US$4.6105 before sellers attempt to push things lower.
Written by the FP Markets Research Team
RAY : razor edgeHello friends
Given the price growth we had, the price is now in a triangle, which is now in an important area in the triangle. If the price is supported and our triangle is broken, it can move to the identified resistance areas, which are price pivots.
But if the support breaks and the price falls, the identified important supports can be the next price targets.
*Trade safely with us*

Btc Dominance Ready to Collapse = ALTSEASONAs you can see, this is the Bitcoin dominance chart on the 1-hour timeframe. A bearish flag is forming, and inside it we can also spot a head and shoulders pattern—both bearish setups. Once the flag breaks down, we can expect a strong altcoin rally that could last 2–3 weeks. So, keep your bags ready, secure profits along the way, and make sure to take some gains before the expected rate cut in September.

BTCUSD: Will the Bulls Defend Key Support Zones?The Bitcoin chart reveals a significant technical pattern that traders should be watching closely. After a strong run-up, we are seeing the asset face considerable resistance, forming what appears to be a double-top structure near the $124,000 level. 📈 This price action suggests a potential reversal or a substantial pullback before any further upward continuation.
Bitcoin is currently trading within a short-term Fib Golden Zone , a critical area for bulls to defend. 🛡️ This zone spans between the 61.8% ($116,730) and 78.6% ($114,500) Fibonacci retracement levels. A decisive break below this range could signal a deeper correction.
Beneath the short-term support, there is a key "Order Block" that could act as the next line of defense for the bulls. 🧱 This area, typically marked by institutional buying interest, is a high-probability reversal zone.
A more significant test for Bitcoin's strength lies in the "Major Fib Golden Zone" and the "Fair Value Gap" below the current price. 🎯 This area, roughly between $108,000 and $103,000, represents a confluence of strong technical support. A drop into this zone would be a healthy retracement to re-test prior support levels before attempting a new leg up.
Failure to hold the key support levels and a breakdown below the Major Fib Golden Zone could see the price seeking a deeper floor towards the "Ext Support" level, near the $96,000 mark. 📉 This would invalidate the recent bullish structure and open the door for a more prolonged bear market.
Disclaimer
The information provided in this chart is for educational and informational purposes only and should not be considered as investment advice. Trading and investing involve substantial risk and are not suitable for every investor. You should carefully consider your financial situation and consult with a financial advisor before making any investment decisions. The creator of this chart does not guarantee any specific outcome or profit and is not responsible for any losses incurred as a result of using this information. Past performance is not indicative of future results. Use this information at your own risk. This chart has been created for my own improvement in Trading and Investment Analysis. Please do your own analysis before any investments.

CVNA – Coiling for the Next Launch?After a monster run from ~$148 to ~$413, CVNA is cooling off inside a tight range ($323–$376). This looks like a classic bull flag — a pause before the next leg higher. A breakout above $376 could send price first to $413 and then toward $450 (+37%). A drop below $323, however, may open the door for a deeper pullback. Watching for volume confirmation on any breakout.

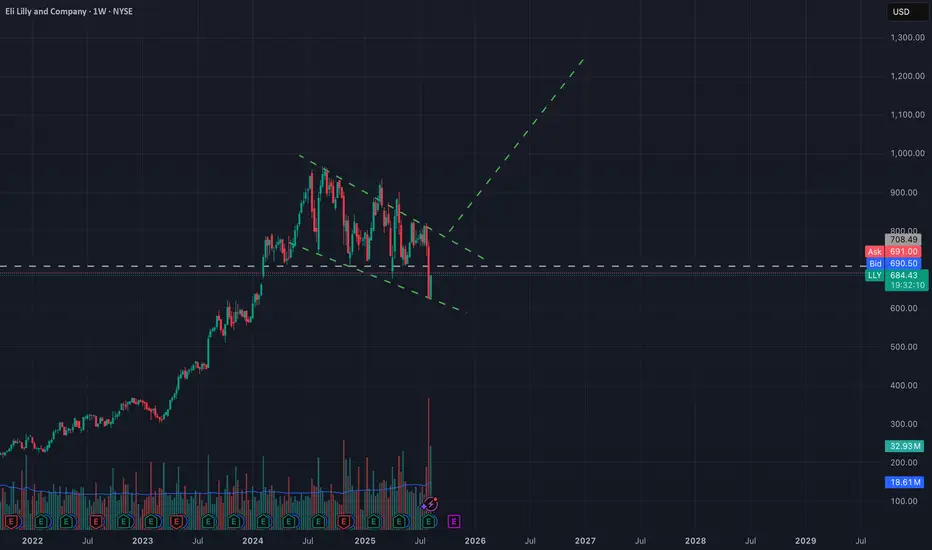
LLY - Clean LevelsBull flag patten on the LLY weekly Chart. The base of the flag/channel has been reactive so far although with low volume (See previously boxed LLY chart) off the top of the recent boxed range.
If you look at the previous chart, you will see that LLY is currently floating up through a low volume node on the anchored volume profile. Unless sellers step in here, 708.49/709 - 711.44 is the next target.
Volume will be in that area, if buyers step in, could be great for calls. Otherwise we could see a look above and fail of the top boxed range(again see previous chart under related publications to the right of this post).
~The Villain
META daily updade(swing) Meta after break out is going retest the flag.
have 2 important point to get in.
ready to entry and watch out could fake break out.
