XAUUSD FORECAST | 6th Jan. 2026 | Bull$eye UdayGold trend is bearish but there is 15min. order block is unmitigated.
Entry - 4487
SL - 4463
TP - 4535
Flag


BTCUSD – Observing a Bullish Flag Structure on the 4H ChartBitcoin’s 4-hour chart is showing a period of consolidation following a strong upward movement. The recent rally created a steep impulse leg, and price is now moving within a compact range that resembles a bullish flag–type structure. This type of structure often appears when the market is taking a pause after increased momentum.
Several moving averages (EMA 7/21/50) are positioned below the current price, indicating that short-term trend conditions continue to lean on the supportive side. Price is holding above these EMAs while staying inside the consolidation zone.
If price continues to maintain support near this range, traders will often watch for a potential continuation scenario. On the other hand, if the market slips below the lower boundary, it may signal that the consolidation phase is extending or losing momentum.
This idea focuses on illustrating the pattern and highlighting how price is interacting with the EMAs, without suggesting any specific trading action.

CVX | Buy above $165.10 | SL below $154.50 on closing basisCVX | Buy above $165.10 | SL below $154.50 on closing basis | 1st Target $197, 2nd $251
**************************************************************************
Disclaimer (Please Read Carefully):
This is not investment advice. The stocks shared here are purely for educational and informational purposes. Please do your own research or consult with a financial advisor before making any investment decisions.
******************************************************************************************************************
Stock market में सिर्फ risk ही risk होता है। Market में survive करने का एक ही तरीका है, stop loss को पूरी discipline के साथ accept करना। अपनी capital को protect करने का इससे बेहतर कोई तरीका नहीं है।
मैं जो भी stock यहाँ शेयर करता हूँ, वो या तो मेरी existing holding में होता है, या फिर मैं उसी level पर fresh buying या add on करता हूँ जिसे मैं mention करता हूँ।
मैं हमेशा buy करते समय अपने system में stop loss ज़रूर लगा देता हूँ, और मेरे लिए stop loss, target से भी ज़्यादा important होता है।
Target achieve होने के बाद मैं पहले profit book करता हूँ और फिर retest या fresh breakout का इंतज़ार करता हूँ।
मैं सिर्फ breakouts पर buy करता हूँ, कभी भी support पर नहीं। और मैं resistance पर sell भी नहीं करता।
******************************************************************************************************************
The stock market involves risk, risk, and only risk. To survive in the market, accepting stop-loss with discipline and without hesitation. There is no other way to protect you capital.
Any stock I share is either already part of my existing holding or I take a fresh entry at the same level I mention. I always place the stop-loss in my system at the time of buying, and I give the highest importance to stop-loss more than the target. Once the target is achieved, I usually book profit once and then wait for either a retest or a fresh breakout.
I buy only on breakouts, never on supports. I also do not sell at resistance levels.
That is simply my trading style.

GBPJPY: Classic Bullish Pattern 🇬🇧🇯🇵
GBPJPY violated a horizontal resistance of a narrow
accumulation range on a daily time frame.
It provides a strong bullish signal.
Expect a rise to 212.5 level.
❤️Please, support my work with like, thank you!❤️
I am part of Trade Nation's Influencer program and receive a monthly fee for using their TradingView charts in my analysis.


DOW JONES INDEX (US30): Bullish Setup Explained
Dow Jones broke and closed above a resistance line of an
expanding wedge pattern.
An occurrence of a consequent change of character suggests
a highly probable bullish continuation.
The market will most likely reach 48527 soon.
❤️Please, support my work with like, thank you!❤️
I am part of Trade Nation's Influencer program and receive a monthly fee for using their TradingView charts in my analysis.

XLMUSDT Bullish Flag Setup for Accumulation opportunityXLMUSDT is currently forming a potential bullish flag pattern. Price is approaching the lower boundary of the flag, presenting a potential accumulation zone. The main plan is to accumulate near this support level, with a target aligned to the projected bullish flag target indicated on the chart. A stop-loss is provided to manage risk in case the support fails to hold.

DLTR | Something is Brewing for Dollar Tree | LONGDollar Tree, Inc. owns and operates discount variety stores offering merchandise at fixed prices. It operates through the Dollar Tree business segment. The Dollar Tree segment includes operations under Dollar Tree and Dollar Tree Canada brands, with its distribution centers in the United States and Canada. The company was founded by J. Douglas Perry and Macon F. Brock, Jr. in 1953 and is headquartered in Chesapeake, VA.

Morning Forecast 02.01.2026Todays Market Forecast and breakdown of which pairs and setups will be on watch today.

OKTA Bearish Inside BarOKTA has been forming a bearish inside bar pattern for multiple years. There's no guarantee it will actually break down, but it's worth keeping an eye on in the coming months. Examining the shorter-term pattern would help with the long-term analysis.

Next bullish pattern target for gold is at $8,195After my smaller timeframe gold chart played out to an exact T with absolute precision, I decided I woud zoom out to try and find the enxt possible pattern and breakout target. I am on the log chart here and we can see how on the long timeframes on log chart, the gold chart is just a series of bullflags. Of which the one with the longest flag pole we have just recently broken up from, when taking a measured move of that flagpole shown here with the tan trendline, and placing it at the breakout point of the flag, we can see there is a measured move target that goes all the way to $8,195. Impressive if this one plays out with anywhere close to the same precision as my last gold chart did. *not financial advice*

AVAX is smokinghot and ready to catch on FIRE! lol
Bull flag with RSI bullish divergence on the day/year chart!
In at $12.55 with TP target around $14.50 around a 16% move!
:)

EURJPY: Bullish Continuation Ahead?! 🇪🇺🇯🇵
There is a high probability that EURJPY will continue
rising after the market opening, following a confirmed
breakout of a resistance line of a bullish flag pattern
on a 4h time frame,
Expect a movement up at least to 184.83 level,
❤️Please, support my work with like, thank you!❤️
I am part of Trade Nation's Influencer program and receive a monthly fee for using their TradingView charts in my analysis.

Prebreakout buildup at an 18-Year range resistance on KTKBANKMy approach to this setup follows a 3-step top-down filter. I use Stan Weinstein’s "Forest to the Trees" framework to check for macro tailwinds, Stage Analysis of the stock for big-picture placement, and look at price action for near-term structure - is it primed for a breakout?
Step 1: The "Forest to the Trees" Filter (Are there tailwinds?)
Before looking at the stock, we must verify that the "Forest" is healthy.
The Forest - NSE:NIFTY : The index is coiling just under record highs (~26,300). Stage Analysis-wise, it appears on the cusp of a Stage 1 to Stage 2 breakout.
The Trees - NSE:NIFTYPVTBANK : A clear relative strength leader. The index is in a confirmed Stage 2 uptrend and is consolidating tightly at its range highs.
Conclusion: The macro environment is providing a green light for long positions.
Step 2: Big Picture Placement (Weinstein Stage Analysis)
We zoom out to see the stock's multi-year lifecycle (monthly timeframe in this case gives the cleanest view)
The Multi-Decade Base: KTKBANK has been in a massive Stage 1 accumulation base since roughly 2006 - never pushing above its 195-200 resistance till 2023
The 2023 Attempt: The stock rallied into the 18-year range highs but was rejected. Crucially, it lacked the "buildup" necessary to overcome nearly two decades of overhead supply.
Current State: After coiling at resistance for all of 2024 and 2025, the stock finally looks ready to break out of this roughly 2-decade long range transition into a Stage 2 Advance.
Step 3: Near-Term Structure & Signal
Finally, we analyze the price action to see if conditions are ripe for a breakout sooner rather than later.
The Buildup: We have a high-quality 2-year tight flag right under the ₹195-200 ceiling. This "buildup" indicates that institutional buying is absorbing the remaining supply.
The Correction End: The double bottom formed in March and September 2025 signaled that sellers are probably exhausted.
The Momentum Signal: November 2025 delivered a major bullish candle, breaking above the 20-Month EMA and the key ₹195 level on the highest monthly volume of the year. This is an important signal!
And then...a pause: December has remained tight, holding above the 20M EMA and the key 195 level. This kind of a quiet pause after a green month is usually bullish.
The Fundamental "Rerating" Thesis
I believe technicals usually lead the fundamentals in most cases. Here, we see a massive Value Gap:
Deep Discount: The bank's Book Value is ~₹333, yet it still trades at a lowly 0.65x P/B.
Asset Quality: This is a clean bank now. Net NPAs have fallen to 1.35%, and the bank maintains a very strong CAR of ~20.8%.
Target: A conservative rerate to a 1.0x Price-to-Book puts the target naturally at ₹330+.
The Gist: A market entering a Stage 2 uptrend, a leading sector, and an 18-year breakout with a perfect prebreakout buildup. This is a prime candidate for a multi-month advance.
Timeframe: Monthly. Patience is required!

F | Possible 3 Year Long Consolidation Over | LONGFord Motor Co. engages in the manufacture, distribution, and sale of automobiles. It operates through the following segments: Ford Blue, Ford Model E, Ford Pro, Ford Next, Ford Credit, and Corporate Other. The Ford Blue, Ford Model E, and Ford Pro segment includes the sale of Ford and Lincoln vehicles, service parts, and accessories, together with the associated costs to develop, manufacture, distribute, and service the vehicles, parts, and accessories. The Ford Next segment is involved in the expenses and investments for emerging business initiatives aimed at creating value for Ford in vehicle-adjacent market segments. The Ford Credit segment consists of the Ford Credit business on a consolidated basis, which is primarily vehicle-related financing and leasing activities. The Corporate Other segment refers to corporate governance expenses, past service pension and OPEB income and expense, interest income and gains and losses from cash, cash equivalents, and marketable securities, and foreign exchange derivatives gains, and losses associated with intercompany lending. The company was founded by Henry Ford on June 16, 1903 and is headquartered in Dearborn, MI.

Is a Pullback Coming Within the Ascending Channel?After analysing the chart, price is trading within an ascending channel and has respected this structure for a considerable period. Based on price action, a pullback may occur, with a potential downside target at 69.7000.
SpicyPips
Happy Trading

This is the year for SilverGood god, I got to start shining up the silverware’s. This conjunction 21.12.20 presents a one in a life time opportunity.

Elite | XAUUSD | 30M – Break & Retest Continuation SetupOANDA:XAUUSD
Price consolidated for an extended period before delivering a strong impulsive move through resistance. Such breakouts typically invite a pullback or consolidation above the broken level before continuation. As long as price holds above the former resistance zone, bullish continuation remains valid.
Key Scenarios
✅ Bullish Case 🚀
A successful hold above the broken structure zone (≈4375–4385) opens the door for continuation toward higher highs.
🎯 Target 1: 4420
🎯 Target 2: 4450
❌ Bearish Case 📉
Failure to hold above the broken level could lead to a deeper retracement toward institutional demand.
🎯 Downside Target: 4320–4300
Current Levels to Watch
Resistance 🔴: 4420 – 4450
Support 🟢: 4385 – 4300
⚠️ Disclaimer: This analysis is for educational purposes only. It is not financial advice.

$PLATINUM: BEAST MODE ACTIVATED!TVC:PLATINUM likes to COIL for decades, storing up immense amounts of energy, then it blasts off. We are witnessing TVC:PLATINUM accelerate into a new price regime. This chart shows a potential scenario where it will reach the stratosphere and then coil up again. Historically, TVC:PLATINUM has traded at a premium to gold—looks like the white metal is trying to play catch up.
DO YOUR OWN RESEARCH; THIS IS NOT INVESTMENT ADVICE.

NZDJPY: Bullish Trend Continuation 🇳🇿🇯🇵
NZDJPY will likely continue rising after the news,
following a confirmed breakout of a resistance line
of a bullish flag pattern on an hourly time frame.
With a high probability, the price will reach 91.4 level soon.
❤️Please, support my work with like, thank you!❤️
I am part of Trade Nation's Influencer program and receive a monthly fee for using their TradingView charts in my analysis.

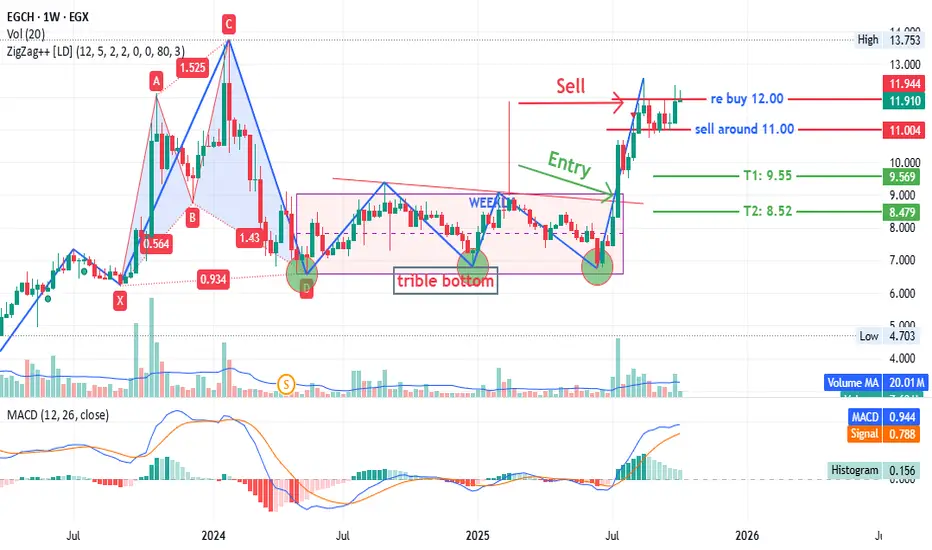
EGCH - is that a game ?! - its stocks market .EGX:EGCH - 1-week timeframe
Multiple patterns and indicators show conflicting results.
Prices often closed daily above 12.00 but failed to do so weekly.
My recommendation from two months ago:
Sell around 11.00 and rebuy if prices close weekly above 12.00.
So far, prices haven't closed weekly above 12.00.
However, this approach may reduce readability for investors.