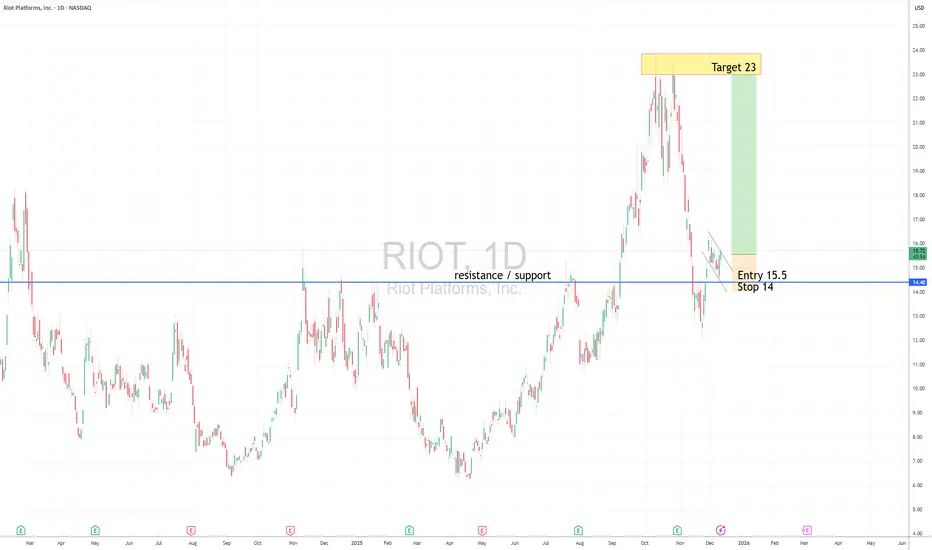
RIOT LongFlag pattern in Uptrend, Near support line
Long entry 15.5
Stop 14
Target 23
Risk management is much more important than a good entry point.
I am not a PRO trader.
In my trading plan, the Max Risk of each short term trade should be less than 1% of an account.
Flag
DXY | Bearish Flag Breakdown Below ChannelDXY spent the past few weeks grinding higher inside a rising channel, forming what looked like a classic bear flag within a broader downtrend. That structure has now resolved lower, with price slipping decisively below channel support and momentum accelerating on the downside.
Scenarios:
If the breakdown holds: downside continuation opens toward the prior demand zone, with the 97.00 area emerging as the next major point of interest.
If price reclaims the broken channel: this move risks turning into a false break, shifting focus back toward the 99.30–99.60 region.

NEE Cup & Handle on Weekly + Bull Flag on Daily: Breakout Setup NextEra Energy ( NYSE:NEE ) is lining up a high-probability bullish combo:
Weekly timeframe: Classic Cup and Handle forming over a year....beginning at the 2024 highs and rounded cup base from mid-2025 lows (~$65-70), followed by a tight handle consolidation. Price is currently in the handle, coiling right below key resistance ~$87 (recent highs / prior breakout level).
Daily timeframe: Overlay Bull Flag pattern emerging — sharp impulse up, followed by a downward-sloping flag channel with contracting volume.
Breakout trigger: Decisive close above $87 on volume — classic continuation signal in this clean energy powerhouse.
Measured move targets:
Initial: $93–$100 (ATH zone)
Extended: $110–$120+ (adding full cup depth to breakout)
Support to watch: $78–$80 (flag lower boundary / recent base).
AI/data-center power demand tailwinds + renewables exposure make this a strong thematic play. A breakk of $87 and a Pullback to $85-$86 could be ideal entry if it holds.
Bullish bias — eyes on that $87 break! Who's positioned? Share stops/targets below! 📈 #NEE #CupAndHandle #BullFlag #Breakout #TechnicalAnalysis #TradingView

SLIGHT PULLBACK BTCUSD-BTC respected an OB on the weekly timeframe; gave a displacement that sweep the internal high but didnt hold above.
-Currently selling to the internal OB which i see as an inducement.
-Im looking for the market to respect the highlighted OB which is where the push started to sweep the internal high.
-This is my entry point.

XAUUSD - GOLD FORECAST | 15MIN. TF. | BULLSEYE UDAYGold has finally grabbed the liquidity with fake out. It is about to rise again.
Buy Limit - $4600
SL - 4576 (240pips)
TP1- 4772 (1720pips)
TP2 - 4845 (2450pips)
TP3 - 4920 (3200pips)
TP4 - 5035 (4350pips)

EU Bears Flag Lower PricesAs last week came to a close, FX:EURUSD delivered a Bearish Breakout of the Ascending Channel after price made a 50% Retracement of the High to Low, signaling the end of the Consolidation Phase, where we can recognize this as a Bearish Continuation pattern, the Bear Flag!
Now the Breakout last week was followed by:
1) Massive increase in Volume
2) RSI Below 50
3) MACD Crossover Event and Red Histogram Bars (Suggesting Selling Pressure entering)
Now all that is left is for a Retest of the Breakout of the Support to verify it is a good Resistance now to generate Short opportunities!
If the Retest is Successful, we could see price fall to the next area of Support made clear in late November last year from 1.15525 - 1.15351.
The Flagpole Extension being the Price Target after the Flag is formed also puts our expectation of price to fall here strengthening the case.
Fundamentally EUR and USD have a busy news filled week so stay vigilant!

NBIS | A.I. Centric Cloud Platform | LONGNebius Group NV is a technology company that provides infrastructure and services to AI builders worldwide. It offers Nebius AI, an AI-centric cloud platform provides full-stack infrastructure, including large-scale GPU clusters, cloud services, and developer tools. The company also operates through specialized brands: Toloka AI, which partners in data for generative AI development; TripleTen, an edtech platform focused on re-skilling individuals for tech careers; and Avride, which develops autonomous driving technology. Nebius Group was founded by Elena Kolmanovskaya, Ilya Segalovich, Mikhail Fadeev, and Arkady Volozh in 1989 and is headquartered in Amsterdam, the Netherlands.

$DXY bullish from 96-98, massive bull flagDespite everyone calling for the death of the dollar, I think the dollar is in the process of bottoming and then will head higher.
Macron called for the Euro to replace the dollar (which is laughable) and likely marks a bottom.
Either we bounce here, or I could see the possibility of one more spike low down to the ~96 support level, but should we see a reaction there, it sets up a massive move higher in the dollar.
As you can see on the chart, we've been correcting inside of a bull flag, if we can form a low around $96-98, we will reverse and head higher to break the flag to the upside. Upside targets on the chart.
I think the bull market in the dollar is just starting, don't let the news scare you out of accumulating dollars over other fiat currencies.

Bitcoin Cash BCH Breaking Out Of A Sym Triangle With A Bull FlagHello Traders,
Here is my chart for Bitcoin Cash BCH. As you can see it looks like the price has broken out of a symmetrical triangle and has bounced on top of the top trendline of the symmetrical triangle which is a bullish sign.
Also the price looks to have formed a bull flag as the price has broken the top trendline of the symmetrical triangle and the price looks to be pushing up from the bull flag. Momentum looks good on the RSI as well with the monthly reading 61.5 (middle ground) , weekly 55.5 (middle) and the daily RSI at 47 (below middle). The 4hr RSI is at 44. The reason I am saying this is when I have watched the price break out of something before and the RSI is already into overbought territory so +70 on any timeframe its likely the price has topped and its a false breakout.
Anyway, it looks like the price wants to go up from here. If the price goes up and breaks the previous LH with conviction then my target is the other LH at $1642.
Lets see what happens.

Apple: Potential Topping PatternsApple hit a record high last month, but it may be struggling in the new year.
The first pattern on today’s chart is the late-October peak around $275, followed by a push above $285 and another high around $275. Some traders may view that as a potentially bearish head-and-shoulders reversal pattern on the tech giant.
Second, AAPL broke the apparent neckline at $265. It then stabilized for five sessions, forming a potentially bearish flag.
Third, prices have broken the 50-day simple moving average (SMA) and could be at risk of breaking the 100-day SMA. Those points may reflect weakness in the intermediate and long terms.
Next, the 8-day exponential moving average (EMA) is below the 21-day EMA and MACD is falling. Have short-term trends turned negative as well?
Finally, AAPL is an active underlier in the options market. That could help traders take positions with calls and puts.
TradeStation has, for decades, advanced the trading industry, providing access to stocks, options and futures. If you're born to trade, we could be for you. See our Overview for more.
Past performance, whether actual or indicated by historical tests of strategies, is no guarantee of future performance or success. There is a possibility that you may sustain a loss equal to or greater than your entire investment regardless of which asset class you trade (equities, options or futures); therefore, you should not invest or risk money that you cannot afford to lose. Online trading is not suitable for all investors. View the document titled Characteristics and Risks of Standardized Options at www.TradeStation.com . Before trading any asset class, customers must read the relevant risk disclosure statements on www.TradeStation.com . System access and trade placement and execution may be delayed or fail due to market volatility and volume, quote delays, system and software errors, Internet traffic, outages and other factors.
Securities and futures trading is offered to self-directed customers by TradeStation Securities, Inc., a broker-dealer registered with the Securities and Exchange Commission and a futures commission merchant licensed with the Commodity Futures Trading Commission). TradeStation Securities is a member of the Financial Industry Regulatory Authority, the National Futures Association, and a number of exchanges.
Options trading is not suitable for all investors. Your TradeStation Securities’ account application to trade options will be considered and approved or disapproved based on all relevant factors, including your trading experience. See www.TradeStation.com . Visit www.TradeStation.com for full details on the costs and fees associated with options.
Margin trading involves risks, and it is important that you fully understand those risks before trading on margin. The Margin Disclosure Statement outlines many of those risks, including that you can lose more funds than you deposit in your margin account; your brokerage firm can force the sale of securities in your account; your brokerage firm can sell your securities without contacting you; and you are not entitled to an extension of time on a margin call. Review the Margin Disclosure Statement at www.TradeStation.com .
TradeStation Securities, Inc. and TradeStation Technologies, Inc. are each wholly owned subsidiaries of TradeStation Group, Inc., both operating, and providing products and services, under the TradeStation brand and trademark. When applying for, or purchasing, accounts, subscriptions, products and services, it is important that you know which company you will be dealing with. Visit www.TradeStation.com for further important information explaining what this means.

MUGHAL, 1D - Bullish flag breakoutMUGHAL, 1D
Bullish flag breakout done
No Divergence
HH HL Intact
Entry at CMP
TPs: 113, 135
SL: 93.5
Arsalan Anwer
STAGS

NZDJPY short: intraday
Price has formed a nice structure below the resistance, this could the driving momentum price needs to get to the low. My entry is below the 15min structure and I'm waiting to be tagged into on this one.

MarketBreakdown | GBPAUD, NZDUSD, US500, EURGBP
Here are the updates & outlook for multiple instruments in my watch list.
1️⃣ #GBPAUD 4h time frame 🇬🇧🇦🇺
The pair is trading in a long-term bearish trend.
After the last bearish wave, the price started a correctional
movement within a bearish flag pattern.
A breakout of its support will confirm a start of a new bearish wave.
2️⃣ #NZDUSD daily time frame 🇪🇺🇺🇸
The market is strongly bullish from November,
After the price updated the last local higher high,
it started to correct within a falling wedge.
Your strong signal to buy will a breakout of its resistance.
3️⃣ #US500 daily time frame
The market retraced to a major rising trend line.
Being a strong vertical support, it was respected.
Probabilities are high that the market will continue rising now.
4️⃣ #EURGBP 4h time frame 🇪🇺🇬🇧
EURGBP has been strongly bearish since November.
The price is currently breaking a support line of a symmetrical
triangle pattern.
It indicates a highly probable bearish continuation.
Do you agree with my market breakdown?
❤️Please, support my work with like, thank you!❤️
I am part of Trade Nation's Influencer program and receive a monthly fee for using their TradingView charts in my analysis.

BTCUSD Breakout - 106,000 targetBTCUSD bitcoin broke an important resistance line with high buying volume , clear bullish candle.
seeing the depth of the are before the break can help us determine target.
Disclaimer: this is not a financial advice, its my technical analysis only. trade at your own risk.

Tron continuing to climb the measured move lineUsually when you see a measured move line treated like a staircase by price action and by this many consecutive daily candles probability is good that the breakout will be validated. If so, the target for this one is around 43-44 cents. *not financial advice*

GOLD (XAUUSD): Another BoS
I see another bullish setup on Gold.
There is a confirmed break of structure BoS on a 4H time frame
and a violation of a resistance of a local consolidation.
The market may rise more and reach 4700 level soon.
❤️Please, support my work with like, thank you!❤️
I am part of Trade Nation's Influencer program and receive a monthly fee for using their TradingView charts in my analysis.

USDCAD longs
If this support holds we could be expecting more up side in this pair. It depends on how the dollar index holds up. In the meantime, I'm open minded about this, as price can created something else.

Bearish Flag in stable coin dominanceStable coin bearish flag pattern in USDT and USDC dominance combination. Do you agree or not?

Bearish Flag in stable coin dominanceStable coin bearish flag pattern in USDT and USDC combination. Do you agree or not?

Brutal Reveral candleThat reversal candle perfectly hit the top of my bear flag channel yesterday. This stock is going down. 3.20s first stop but a break there and the lows of the past 12 months come into play.

AAPL – Bullish Flag If the Catalysts Show UpApple is pulling back into a descending flag after a strong multi-month rally. This still looks like a healthy consolidation if the next move higher is backed by fundamentals. The bullish case needs catalysts to trigger: iPhone 17 supply catching up to demand, Services growth holding in the mid-teens (high-margin EPS leverage), and gross margins staying resilient despite higher AI spend.
If these start to confirm and price pushes higher, the flag can resolve to the upside. If not, a failure could lead to a minor correction toward the anchored VWAP, which would still be consistent with the broader bullish structure. The oversold RSI suggests downside may be limited near-term, supporting the idea of consolidation rather than a full trend break.

Chart Patterns ranked by reliability (1-8)Chart Patterns as a Strategy (Not a System)
In the world of technical analysis, chart patterns are often marketed as stand-alone trading systems. In reality, their real edge comes from probabilistic structure recognition, not prediction.
The key insight from my large-sample testing (10 years, 200,000+ patterns (Futures, FX)) is this:
Patterns don’t predict direction — they quantify structural bias once price has already revealed intent.
That distinction is what separates profitable traders from pattern collectors.
How These Patterns Were Tested (Why the Stats Matter)
All patterns discussed below were:
Only counted once fully completed
Required confirmed breaks of structure (trendline, neckline, or support/resistance)
Measured using objective projection rules, not discretionary targets
TP Rule: Full Head and Shoulder Height, using the Head distance and the right shoulder as the SL.
Full Height of triangles, and a full height for flags as well.
Twice the height of the Channel as TP, and Time TP for Channels, for half of the duration of the it.
Rectangles were Full Box Width as TP, and a time-based TP of 1/4 the Length.
It could be trailed further, but some such as Rectangle TP made great mean-reversion trade.
This removes hindsight bias — a major flaw in most pattern discussions.
Continuation Patterns (Trend Context Is Mandatory).
#8. Bull & Bear Flags (~67%) (Alt. Name: Cups, Volatility Contraction Pattern)
Occur after near-vertical impulse moves, typically the 50 EMA can filter the direction.
Represent temporary pauses, not reversals.
Best when:
Flag is tight
Forms near the extreme of the impulse
Volume contracts during consolidation
Professional takeaway:
Flags are trend health checks, not entries. If a flag fails, momentum is likely exhausted.
#7. Ascending & Descending Triangles (~73%)
Market compresses against a hard level
One side shows aggression, the other absorption
Breakout confirms institutional imbalance
Use them to answer:
“Is price being accumulated or distributed?”
#6. Ascending & Descending Channels (~73%) (Alt. Name: Cups & Handle)
Wide consolidations between parallel trendlines
Stronger than flags due to time + participation
Breakouts often lead to measured trend continuation
Key insight:
Channels are delayed continuation, not indecision.
Reversal Patterns (Confirmation Is Everything)
The Joker: Double Tops & Bottoms (75–79%)
Require structural failure
Completion only occurs after neckline break
Bottoms outperform tops statistically (markets rise faster than they fall)
⚠️ Common mistake:
Anticipating the second top/bottom instead of waiting for confirmation.
The Queen: Triple Tops & Bottoms (77–79%)
Stronger due to repeated rejection
Represent exhaustion of dominant participants
Interpretation:
The market tried three times — and failed.
The King: Rectangle Patterns (~78–80%)
Flat consolidation after a trend, more than 3 touches top and bottom.
Essentially failed reversal attempts.
Breakouts often trap traders positioned against the trend, it's best to enter on retest of breakout or earlier at the Bear-Bull Midline of the Box.
Critical lesson:
Most “double tops” fail — and turn into rectangles.
The Ace: Head & Shoulders (~83%)
Why it works so well:
Clear distribution → failure → confirmation
Captures institutional exit mechanics
Neckline break aligns with order-flow imbalance
Both regular and inverted versions are the most reliable classical patterns when properly confirmed.
⚠️ Common mistake: It's easy to mistake a Head and Shoulders with another pattern like a Double or Triple Bottom if it's neckline is not broken well.
The Trap Pattern: Pennants (~55%)
Despite being taught alongside flags:
Pennants break against trend too often
Over-compression increases randomness
Lack clear structural dominance, Pivot HL are spots where trader's should sell.
Professional rule:
If it looks too tight, it’s probably a coin flip.
It's better to target Equal High and Lows to the left as TP.
How Professionals Actually Use Chart Patterns
We don’t trade patterns — we trade what they imply.
Patterns help answer:
Is the market accepting or rejecting price?
Are participants trapped or in control?
Is this continuation, transition, or reversal?
They work best when combined with:
Market structure (HH/HL, LH/LL)
Time-of-day context
Volume or order-flow
Higher-timeframe bias
Final Truth About Pattern Accuracy
Pattern Type Role Best Use
Flags / Channels Continuation Trend validation
Triangles Pressure build Breakout bias
Double / Triple Reversal Failure detection
Rectangles Continuation Trap identification
Head & Shoulders Reversal Distribution confirmation
Pennants ❌ Avoid

Evening Forecast 09.01.Final forcast of my watchlist this week although I'm not entertaining a trade right now.
It's just a casual walk through the pairs to spot opportunities that week and stay in rhythm.
