GBPUSD Institutional Levels: Sell 1.3490 → Buy 1.3360🔱 GBPUSD WEEKLY SNAPSHOT — EXECUTIVE SUMMARY
✨ GBPUSD trading inside a liquidity-driven range with expansion risk
🔄 Current environment: balanced → reactive, awaiting liquidity taps
🧱 Fresh sell-side liquidity / sell zones (premium):
• 1.3460
• 1.3490 upper premium / stop-rich zone
🟢 Fresh buy-side liquidity / buy zones (discount):
• 1.3390
• 1.3360 deeper draw / max pain zone
📉 Price currently oscillating between fresh liquidity pools, not trending
🧠 Both sides are unmitigated → clean reactions likely on first touch
⚖️ Market favors mean-reversion trades until a liquidity sweep occurs
🎯 Expect sharp reactions, not chop, at marked levels
⚠️ Bias is conditional, not directional:
• Above mid-range → sellers gain control
• Below mid-range → buyers gain control
🎯 Recommended strategy:
👉 Buy from fresh buy-side liquidity
👉 Sell from fresh sell-side liquidity
🗳️ GBPUSD WEEKLY SCENARIOS — WHAT’S YOUR PLAY?
Which path do you expect for GBPUSD this week?
🅰️ Tap 1.3460–1.3490 → sharp rejection → move back into range
🅱️ Sweep 1.3360 → strong bounce → rotation higher
🅲 Full range sweep (both sides) → expansion next
🅳 Your level: drop ONE price you’re watching most 👇
________________________________________
🧠 GBPUSD MARKET LOGIC — Institutional Read
• Liquidity is stacked symmetrically above and below current price
• No strong acceptance yet → algos farming both sides
• First touch of fresh liquidity = highest R:R
• Repeated taps weaken the zone → wait for displacement
• Expansion likely after one side is fully swept
________________________________________
⏳ EXPECTATIONS GOING INTO THE WEEK
⬆️ Rallies into 1.3460–1.3490
→ Watch for rejection, displacement, or failure to accept
→ Favor sell-side reactions
⬇️ Drops into 1.3390–1.3360
→ Watch for absorption, divergence, or strong wicks
→ Favor buy-side reactions
🧨 A clean sweep + acceptance beyond either extreme
→ Signals range resolution & new directional leg
Forex

EURUSDHello Traders! 👋
What are your thoughts on EURUSD?
EURUSD was rejected from the resistance zone as expected after reaching the highlighted area.
Price is now moving toward a key support zone, where a rising trendline is also present. This confluence increases the probability of a bullish reaction from this area.
As long as price holds above the support zone and respects the ascending trendline, a bullish reaction is expected from this area.
The preferred scenario is a bullish move from the support zone, with price advancing at least toward the specified target zone.
A clear and sustained break below the support zone and the ascending trendline would weaken or invalidate the bullish scenario.
Don’t forget to like and share your thoughts in the comments! ❤️

XAUUSD: Descending After Fake Breakout - Bears in ControlHello everyone, here is my breakdown of the current XAUUSD setup.
Market Analysis
XAUUSD initially spent a prolonged period trading inside a well-defined range, where price respected clear support and resistance boundaries. This range reflected market indecision, with neither buyers nor sellers able to gain sustained control. Eventually, price broke out to the upside, confirming bullish intent and triggering a strong impulsive rally.
Currently, after the rejection, price broke back below short-term structure and started forming a descending triangular structure, defined by a clearly respected descending resistance line. Each bullish attempt toward this trendline has been rejected, signaling that sellers remain in control. At the same time, price is gradually rotating lower toward the 4,350 Support Zone, which previously acted as a key demand and breakout area.
My Scenario & Strategy
My primary scenario: as long as XAUUSD remains below the 4,490 Resistance Zone and continues to respect the descending resistance line, the bearish bias remains valid. Rejections from this trendline favor further downside continuation toward the 4,350 Support Zone, which is the first major downside target. If price breaks and accepts below the 4,350 Support Zone, this would confirm bearish continuation and open the door for a deeper corrective move toward lower support levels.
However, if buyers manage to reclaim the descending resistance line and achieve a clean breakout and acceptance above the 4,500 resistance area, the short bias would be invalidated and the market could transition back into bullish continuation. For now, structure favors sellers, momentum is weakening near resistance, and price remains capped below key supply.
That's the setup I'm tracking. Thank you for your attention, and always manage your risk.

Gold Testing a Key EMA, the Pullback Remains TechnicalOn the OANDA:XAUUSD H1 chart, gold is entering a short-term corrective phase following the previous strong rally. The key point to emphasize is that the bullish structure remains intact, and current price action is mainly about how the market reacts around the major EMA levels.
From a technical perspective, price is hovering around the EMA 89, corresponding to the 4,435–4,440 zone. Meanwhile, the EMA 34 sits higher near 4,455 and has temporarily turned into a short-term dynamic resistance. Price failing to hold the faster EMA and pulling back toward the slower one is a familiar scenario within a healthy uptrend, where larger players closely observe price reactions to assess whether the trend continues to be defended.
The constructive sign so far is that gold has not printed a clear H1 close below the EMA 89 . The corrective candles remain relatively small and show lower wicks, suggesting that selling pressure is still limited. Although volume has ticked up slightly during some of the pullback legs, there is no evidence of aggressive distribution or heavy unloading.
Overall, this decline is better interpreted as a pullback toward a balance zone after price had extended significantly away from the EMAs during the prior advance. Given gold’s volatility characteristics, such corrections often serve to relieve pressure and rebuild a base before the market decides on its next directional move.

GBPUSD Could Push Higher? | Rate-Cut Risk Pressures the Dollar!Hey Traders,
In today’s trading session, we are closely monitoring GBPUSD for a potential buying opportunity around the 1.33800 zone. GBPUSD remains in a well-established uptrend and is currently undergoing a healthy corrective pullback, approaching a key trendline confluence and the 1.33800 support-turned-resistance area, which may act as a strong demand zone for bullish continuation.
From a fundamental perspective, growing expectations of a potential interest rate cut by the Federal Reserve in the coming months continue to weigh on the US Dollar. A softer USD environment typically supports upside momentum in GBPUSD, reinforcing the bullish technical outlook.
As always, wait for confirmation and manage risk responsibly.
Trade safe,
Joe.

USD/JPY | What's next? (READ THE CAPTION)As you can see in the hourly chart of USDJPY, in the early hours of today, it managed to break through the NWOG and the FVG, going as high as 156.955, before dropping to the low of the FVG at 156.460. Currently it's being traded at 156.680 and it's retesting the NWOG. I expect it to continue working the NWOG and FVG. Bullish targets are: 156.780, 156.860, 156.940 and 157.020.

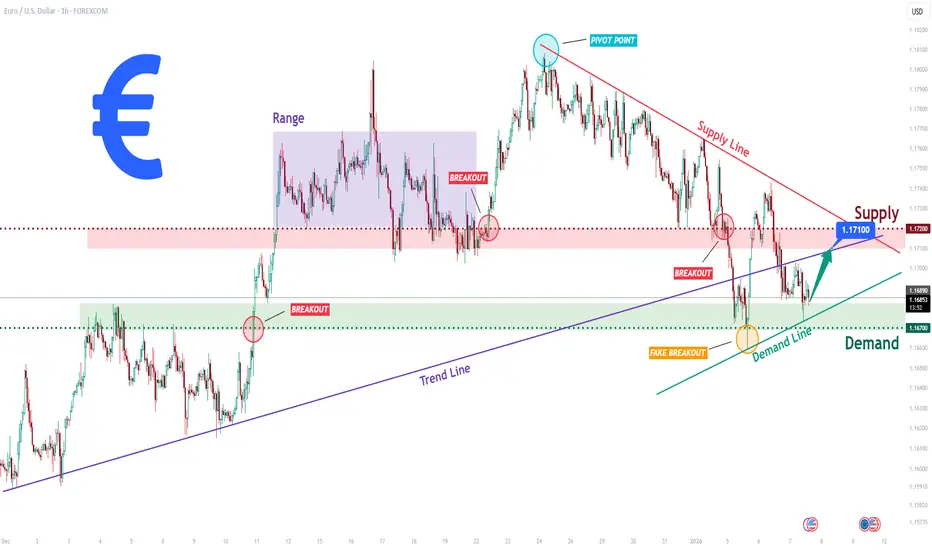
EURUSD Long: Compression Near Key Zones Signals Upcoming MoveHello traders! Here’s a clear technical breakdown of EURUSD (1H) based on the current chart structure. EURUSD previously traded within a well-defined ascending structure, respecting a rising trend line that acted as dynamic support during multiple pullbacks. This bullish phase showed consistent higher lows, confirming buyer control. After the impulsive upside move, price entered a consolidation range, highlighted on the chart, where buyers and sellers temporarily reached equilibrium. From this range, EURUSD executed a bullish breakout, confirming continuation and pushing price toward the upper structure. However, as price approached the Supply Zone around 1.1720–1.1750, bullish momentum started to fade. Multiple reactions, including fake breakouts and rejections near the pivot point, clearly signal strong selling pressure in this area. A descending Supply Line now caps price, reinforcing bearish pressure from above.
Currently, on the downside, price recently swept below short-term support, forming a fake breakout into the Demand Zone around 1.1670, which aligns with an ascending Demand Line. The quick recovery from this area suggests active buyers defending demand and preventing deeper downside for now. Currently, EURUSD is compressing between demand support and descending supply resistance, indicating a tightening structure and an upcoming directional move.
My scenario: as long as EURUSD holds above the 1.1670 Demand Zone and respects the rising demand line, a corrective bounce toward the 1.1710–1.1720 Supply Zone is possible. This area remains a key decision point. A strong rejection there would favor renewed bearish continuation, while a clean breakout and acceptance above supply would invalidate the bearish pressure and open the door for bullish continuation. Manage your risk!
XAUUSD – Bullish Wave Structure Still Intact, Waiting for Wave 4Gold is moving within a clear 5-wave bullish structure, where:
Wave 1 → Wave 3 have already completed with strong impulsive momentum.
Price is currently in the corrective phase of Wave 4, which is technical in nature and not a trend reversal.
Wave 5 to the upside is still expected once downside liquidity absorption is completed.
Key Structure & Technical Context
The H1 trend remains bullish as long as the key swing low below is not broken.
The current pullback is corrective; no bearish CHoCH has been confirmed.
The lower Demand zone aligns with the rising trendline + Fibonacci levels + GAP, creating a high-probability reaction area.
Preferred Trading Plan (MMF Style)
🔵Primary Scenario – Trend-Following BUY
BUY zone: 4,398 – 4,350
This is a strong confluence area (Demand + trendline + GAP).
Only execute buys after clear price reaction and structure holding.
Avoid FOMO entries in the middle of the range.
Targets:
TP1: 4,444
TP2: 4,496
TP3: 4,534
Alternative Scenario:
If price does not pull back to the lower zone and instead breaks and holds above 4,496, wait for a retest to continue buying with the trend.
🔵Invalidation
If an H1 candle closes below 4,350, invalidate the BUY bias and wait for a new structure to form.
🔵Summary: The broader bullish wave structure remains valid. The current decline is a Wave 4 correction, and patience is key to positioning for a potential Wave 5 continuation from discounted levels.

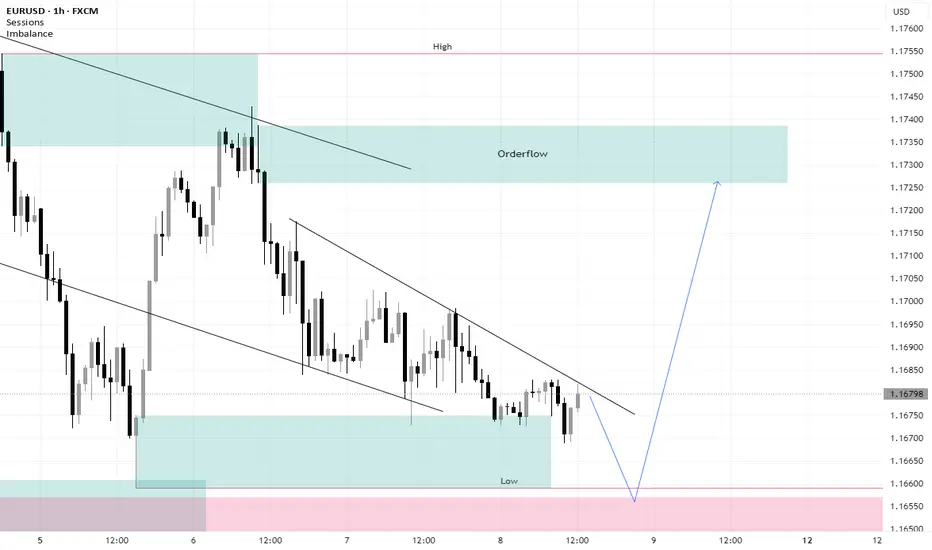
EURUSD Liquidity Driven ScenarioQuick Summary
EURUSD left trendline liquidity during the early week selloff, Price is expected to first target the low at 1.16580
After that a move higher toward an orderflow zone is possible
From that area continuation to the downside will be considered only with a clear reversal signal
Full Analysis
During the strong bearish move at the beginning of the week EURUSD left behind clear trendline liquidity
This type of liquidity is often revisited later as price seeks to rebalance and collect resting orders
Before any move higher price is expected to continue its decline and target the low at 1.16580
This level represents a logical downside objective and a liquidity area that has not yet been fully addressed
Once that low is swept EURUSD may start moving higher to sweep the trendline liquidity
This upward move is expected to lead price into an orderflow zone.
From that area I will look closely at price behavior If a clear reversal signal appears inside the orderflow zone I will look to rejoin the bearish move
Without a strong reversal signal there will be no sell entry as confirmation remains essential
XAUUSD Rising Support Holds - Next Target 4,500 ResistanceHello traders! Here’s a clear technical breakdown of XAUUSD (4H) based on the current chart structure. After a prolonged consolidation phase, Gold was trading inside a well-defined range, indicating balance between buyers and sellers. This range acted as an accumulation zone before price initiated a bullish expansion. Following the breakout from the range, XAUUSD entered an ascending channel, confirming a shift toward buyer control with a sequence of higher highs and higher lows. During this phase, price respected both the channel support and resistance lines, using them as dynamic structure levels. As price approached the upper boundary of the channel and the Resistance / Seller Zone around 4,500–4,510, bullish momentum started to weaken. Multiple fake breakouts above resistance signaled strong selling pressure at the highs. This led to a sharp corrective move lower, where price broke below short-term structure before finding support. Currently, XAUUSD is holding above the Buyer Zone around 4,400, which aligns with a key Support Level and a prior breakout area. Price has already shown a reaction from this zone and is now forming higher lows along a newly respected rising support line, suggesting buyers are attempting to regain control. The recent breakout back above local resistance reinforces the idea of a corrective pullback rather than a full trend reversal. My scenario: as long as XAUUSD holds above the 4,400 Buyer Zone and respects the rising support line, the bullish bias remains valid. I expect buyers to defend this area and attempt another push toward the 4,500 Resistance / Seller Zone (TP1). A clean breakout and acceptance above this level would confirm bullish continuation and open the path for further upside. However, a decisive breakdown below the buyer zone would weaken the structure and increase the risk of a deeper correction back toward lower support levels. Please share this idea with your friends and click Boost 🚀

Scaling a small account is not a strategy problem It is a sequencing and behavior problem. Most traders assume that growth comes from new methods or more trades. The data shows that small accounts grow fastest when they remove the hidden tax that drains them: emotional sizing, poor invalidation placement, and trading inside volatility expansion instead of liquidity alignment.
The most common failure point is position size volatility. When volatility expands, candle ranges widen, liquidity thins, and invalidation distance increases. This is the worst moment to increase size, yet this is when most traders do it—after a streak of wins or boredom-induced impulsive entries. A small account does not fail because the market moved against it. It fails because it increased exposure when the market removed fuel.
Professionals scale differently. They anchor size when volatility expands and only scale when volatility compresses, liquidity is swept cleanly, and structure transitions. This shift protects capital durability first so compounding becomes mathematically possible second.
The framework begins with a volatility budget. Every asset has a typical invalidation distance on each timeframe. BTCUSDT and SOLUSDT behave with wider ranges than mid-cap pairs, and their liquidity pockets are tested more aggressively during overlap sessions. Your account must size exposure based on what the market historically allows a setup to absorb without forcing premature liquidation.
Liquidity mapping is the next step. Equal highs, equal lows, and inefficient consolidation clusters are not entry signals. They are incentives. Price moves there to transact, collect stops, and reposition larger capital. The first proof of intention is the sweep. Price breaches liquidity and reclaims back inside the swing. This tells you that breakout traders provided the orders, not continuation. A small account compounds faster when it waits for the sweep to finish rather than entering into it.
From there, structure must transition. In an uptrend, the market protects higher lows. In a downtrend, it protects lower highs. When price violates the last defended point after liquidity is taken, you have a control handover. This is not a guess. It is a behavioral change in price organization. But structure alone is still incomplete. It requires displacement.
Displacement is momentum proving participation. A structural break followed by thin, drifting candles is not authority. A structural break followed by clean directional movement is participation. This shows urgency from the opposing side. This is where narratives change and capital begins positioning for the next impulse.
The retest becomes the execution filter. Price returns to the broken or swept zone, interacts without hesitation, and respects the new bias built from liquidity and structure. The retest reduces invalidation distance, tightens risk, and improves reward asymmetry naturally without needing to increase leverage or complexity. The best retest is not the fastest one. It is the one that proved permission through sequence.
Micro-scaling compounds edge without compounding risk. Extracting 1–3% per trade on confirmed retests with 2.5:1 or better R:R compounds a small account more efficiently than trying to extract 10% during unconfirmed expansion phases. High-quality trades reduce mistake frequency, which matters more than win rate when capital is small and feedback is fast.
Time is also a filter. Crypto liquidity behaves differently by session. The most stable participation for BTC and SOL historically occurs during London–NY overlap, where bid depth is higher, sweeps are cleaner, and structural transitions show more authority. Dead-zone hours widen noise and compress clarity. Scaling requires knowing when participation is probable, not forcing participation when it is absent.
The final rule is process-first validation. A trade that works without a reason is not scale permission. A trade that works because it followed the sequence is. The market does not reward perfection. It rewards traders who stay calibrated to structure, volatility, and liquidity long enough to compound the value of participation when conditions finally agree.
Scaling is not about catching the entire move.
It is about surviving long enough to participate in the right side of the next move with defined risk and conditional exposure. Small accounts grow when traders stop scaling emotion and start scaling conditions.

XAU/USD – Corrective pressure returns as the market awaits NFPAfter a strong rally earlier this week, gold is showing clear signs of cooling during the Asian session. A rebound in the U.S. dollar has created noticeable headwinds, while market sentiment has turned cautious ahead of the U.S. Non-Farm Payrolls (NFP) report —a key catalyst that could shape short-term expectations for Fed interest rate policy .
From a technical perspective , on the H4 timeframe, price failed to sustain bullish momentum as it approached the 4,500 resistance zone. Subsequent rebounds have been largely technical in nature and quickly faded, highlighting a lack of conviction from buyers. A move below the short-term balance area opens the door for a corrective pullback toward 4,400 (TP1), with a deeper extension toward 4,330 (TP2)—a confluence of support and the medium-term ascending trendline. Only a decisive breakout above 4,500 would meaningfully ease the current downside pressure.
In summary , with USD strength persisting and markets staying on the sidelines ahead of NFP, the short-term corrective scenario remains favored. The ongoing pullback can be seen as a necessary reset, allowing the market to rebalance before gold establishes a clearer directional bias in the sessions ahead.

Market Slows Down: GBPUSD Enters a Balance ZoneThe GBPUSD market is entering a phase of slowing momentum after its previous bullish move. As key economic news from both the US and the UK unfolds this week, capital flows have turned more cautious, causing price to lose its clear bullish drive .
From a fundamental perspective, the US dollar remains supported by expectations around upcoming US economic data, especially labor-market indicators. Meanwhile, the GBP lacks strong supportive catalysts, leaving the pair stuck in a tug-of-war, with downside pressure becoming increasingly visible.
On the chart, GBPUSD is moving sideways within a tight rang e and has been repeatedly rejected near the 1.3470 resistance zone. Price structure suggests that buying momentum is gradually weakening , with recent rebounds appearing more technical than impulsive. The 1.3380 area below is acting as short-term support and remains a likely downside target if price fails to break above resistance.
At this stage, GBPUSD aligns best with a sideways market biased to the downside . The focus should be on monitoring price reactions near resistance for potential short-term sell opportunities, rather than anticipating a fresh bullish trend.
In a market that is waiting for news and lacking strong momentum, patience and discipline remain a trader’s greatest edge.
Wishing you successful and disciplined trading.

GOLD TODAY Slowing Down to Move FurtherHello, I’m Camila.
Looking closely at the current H8 chart, I see gold entering a very typical phase after a strong rally. The previous sequence of bullish candles pushed price close to the upper resistance zone, but at this point the market has started to slow down and move sideways. This does not surprise me. When price advances too quickly relative to the underlying support, the market usually needs a pause to reassess the strength of buyers.
From a structural standpoint, the uptrend remains intact. Price is still trading above the key moving averages, and the series of higher lows has not been broken. This indicates that buying pressure has not left the market, but is simply decelerating. In gold, this phase often represents a period of compression before the next expansion.
From a fundamental perspective, the recent rally has not been random. Based on Forex Factory and major mainstream news sources, the market continues to react to ongoing geopolitical and global economic risks. Geopolitical tensions have not eased, while the Federal Reserve maintains a data dependent stance without signaling any new tightening. These factors continue to provide a supportive backdrop for gold, while also making it difficult for price to move higher in a straight line without short term corrections.
The price zone I am watching most closely at the moment lies between 4,360 and 4,330. In strong momentum driven uptrends like this, the market often repeats a familiar pattern: a sharp push higher that creates a breakout narrative, followed by a pullback to test the base and support, and only then does the market decide whether it has enough strength to continue higher. If gold corrects into this zone and shows a clear buying reaction, the bullish structure will remain clean and healthy.
On the upside, once the consolidation process is complete, I expect price to rotate back toward the upper resistance area around 4,500 to 4,550. A decisive breakout above this zone would open the door for a higher price range to be established in the next phase.
For me, gold today is not weakening. It is simply slowing down to prepare for its next move. I wish you successful trading and the patience to stay focused while the market is “catching its breath.”

WTIUSD: Bearish Drop to 54.66?As the previous analysis worked exactly as predicted, CFI:WTI is eyeing a bearish continuation on the 4-hour chart , with price testing resistance after lower highs in a downward channel, converging with a potential entry zone that could spark downside momentum if sellers defend amid recent volatility. This setup suggests a pullback opportunity in the downtrend, targeting lower support levels with approximately 1:4 risk-reward .🔥
Entry between 56.94–57.22 for a short position (entry from current price with proper risk management is recommended). Target at 54.66 . Set a stop loss at a daily close above 57.5 , yielding a risk-reward ratio of approximately 1:4 . Monitor for confirmation via a bearish candle close below entry with rising volume, leveraging oil's volatility in the channel.🌟
📝 Trade Setup
🎯 Entry (Short):
56.94 – 57.22
(Entry from current price is valid with proper risk & position sizing.)
🎯 Target:
• 54.66
❌ Stop Loss:
• Daily close above 57.50
⚖️ Risk-to-Reward:
• ~ 1:4
⚠️ This analysis is the request of one of my followers .
💡 Your view?
Does WTI roll over toward 54.66, or do buyers attempt another squeeze above channel resistance? 👇

XAUUSD 30M – Bullish Trend Continuation SetupPrice is in a strong bullish structure, respecting the ascending trendline and holding above the key support zone near 4,395–4,410.
A healthy pullback into 4,450–4,460 can offer continuation entries, with first target at 4,495–4,500.
A confirmed breakout above 4,500 opens the path toward the main target zone at 4,520–4,530, while a break below support would invalidate the bullish setup.

Why Comparison Feels Productive — And Quietly Destroys YouHello, I’m Camila.
If I’m honest, comparison once felt like a necessary part of growth. It made me feel alert, ambitious, and aware of where I stood. Looking at people ahead of me felt like pressure in the right direction. What I didn’t realize then was that comparison wasn’t pushing me forward — it was slowly pulling my attention away from my own work.
Comparison keeps the mind busy. I would analyze other people’s progress, their speed, their outcomes. It felt productive, almost responsible. But nothing was actually being built. I was thinking about progress instead of creating it, and my brain rewarded me for observation rather than execution.
Over time, comparison changed how I made decisions. Instead of focusing on what I needed to improve today, I started measuring myself against someone else’s timeline. That shift led to rushed moves, unnecessary doubt, and a growing impatience with my own pace. Not because I was doing poorly — but because I was constantly looking elsewhere.
The real cost wasn’t a loss of confidence. It was a loss of trust in my process. Once that trust faded, hesitation took over. And hesitation, more than failure, is what quietly slows everything down.
If there’s one thing I’ve learned, it’s this: real progress is quiet. It doesn’t demand comparison to feel valid. When I focus on my own work and my own pace, growth takes care of itself — without the noise.
Traders, If you liked this educational post, give it a boost and drop a comment.

XAUUSD Long: Demand Defended - Bulls Prepare for Push To $4,530Hello traders! Here’s a clear technical breakdown of XAUUSD (3H) based on the current chart structure. Gold is trading within a well-defined ascending channel, confirming sustained bullish control and a strong trending environment. Price has consistently respected both the channel support and resistance, forming higher highs and higher lows. This structure highlights healthy momentum rather than an exhausted move.
Earlier, XAUUSD pushed into the Supply Zone around 4,500–4,530, where selling pressure appeared and price experienced a sharp rejection. This rejection led to a corrective pullback, during which price briefly broke below short-term structure before finding support at the Demand Zone near 4,400. This area aligns with the channel support and acted as a key reaction level. Within the pullback, price formed a Head and Shoulders–type corrective pattern, which completed near demand. Instead of continuation lower, sellers failed to follow through, and buyers stepped in aggressively. Price reclaimed structure with a clean breakout back above local resistance and the rising Demand Line, signaling that the move lower was corrective rather than a trend reversal. Currently, XAUUSD is holding above the 4,400 Demand Zone and continues to respect the ascending channel. Price is consolidating and building higher lows, suggesting accumulation before the next impulse.
My scenario: as long as Gold holds above the demand zone and the rising demand line, the bullish structure remains intact. I expect buyers to defend this area and push price toward the 4,530 Supply Zone (TP1). A clean breakout and acceptance above supply would confirm bullish continuation and open the door for further upside expansion. However, a decisive breakdown below the demand zone would weaken the structure and increase the risk of a deeper correction. For now, the trend favors the bulls, with demand holding and momentum gradually rebuilding. Manage your risk!

NZDUSD Will Go Higher From Support! Buy!
Here is our detailed technical review for NZDUSD.
Time Frame: 4h
Current Trend: Bullish
Sentiment: Oversold (based on 7-period RSI)
Forecast: Bullish
The market is trading around a solid horizontal structure 0.574.
The above observations make me that the market will inevitably achieve 0.578 level.
P.S
We determine oversold/overbought condition with RSI indicator.
When it drops below 30 - the market is considered to be oversold.
When it bounces above 70 - the market is considered to be overbought.
Like and subscribe and comment my ideas if you enjoy them!

EURUSD Bearish Bias After Channel BreakQuick Summary
EURUSD is moving very slowly after breaking the bullish price channel, The bearish view remains valid and a retest of 1.17220 is possible before continuation lower
This level aligns with orderflow and a filled liquidity void which supports further downside
Full Analysis
EURUSD is currently showing very slow price action especially after breaking the ascending price channel
Despite this slow movement the bearish outlook remains intact and has not changed
Price may attempt a corrective move higher to retest the 1.17220 level
This area represents a strong reaction zone where price can respond after filling the liquidity void
After this level there are no major levels left for price to retest which increases the probability of bearish continuation
The 1.17220 zone also aligns with a strong orderflow area which can act as a strong supply zone for further downside movement
As long as price remains below the broken channel the expectation stays bearish

Why You Should NOT Go All-In When Trading GOLDGold is one of the most attractive markets, but it is also where many traders pay the highest price because of a single decision: going all-in. Not because their analysis is wrong, but because they underestimate gold’s volatility.
1. Gold Has Strong Trends, But It Rarely Moves in a Straight Line
Gold can trend beautifully, but along the way there are always:
Deep pullbacks
Sudden news-driven spikes
Liquidity sweeps before the next continuation
When you go all-in, there is no room to absorb volatility. A single short liquidity sweep is enough to knock you out of the trade, even if the final direction is exactly what you anticipated.
2. All-In Turns Small Risk Into “Fatal” Risk
A normal losing trade is simply a trading cost.
But a losing all-in trade can cost you the ability to trade at all.
Trading is not about winning or losing a single position.
It is a game of survival.
3. All-In Damages Your Psychology More Than You Think
When all your margin is tied to one trade:
You fear the stop loss more than you respect market structure
You move your SL emotionally
You hope instead of acting correctly
And in the gold market, hope never pays traders.
4. Gold Is a Liquidity Market, Not an Emotional One
Gold frequently sweeps levels that everyone can clearly see on the chart.
All-in traders who place tight, “perfect-looking” stop losses unintentionally become ideal liquidity for the market.
🎯 Conclusion
All-in is not confidence — it is a gamble.
To trade gold sustainably, you need to:
Split your position size
Keep margin flexibility
Prioritize survival before profits

Gold at a Liquidity Crossroads — Expansion or Breakdown IncomingGold (XAUUSD) on H1 is currently trading inside a well defined liquidity price range, following a strong bullish expansion earlier in the week. That impulsive rally confirmed buyer dominance, but recent price action shows momentum has slowed, with the market now entering a distribution and decision phase.
Price is consolidating around the mid range near 4,460, closely aligned with the short-term moving average. This area acts as equilibrium not an ideal zone for aggressive entries as liquidity is building on both sides of the range.
The lower boundary of the structure sits around 4,408, marking a critical support and liquidity sweep zone. A clean break below this level would signal a range failure and open the door for a deeper bearish expansion toward 4,350.
On the upside, the upper boundary and key target remain near 4,545–4,550, where previous highs and resting liquidity are located. Acceptance above this area would confirm bullish continuation and trend resumption.
Bullish scenario: As long as price holds above the 4,408 support, buyers may attempt a push higher. A clean break and acceptance above 4,500, followed by continuation, would open upside targets toward 4,545–4,550.
Bearish scenario: A confirmed breakdown below 4,408, with follow-through and failed pullback, would validate a bearish expansion toward 4,350, signaling that liquidity below the range is being targeted.
For now, Gold is compressing inside a liquidity box. Patience is key the highest-probability trades will come after the range resolves, not while price remains trapped in the middle.

EURUSD: Fake Breakout at Resistance Targets 1.1600 SupportHello everyone, here is my breakdown of the current EURUSD setup.
Market Analysis
EURUSD previously traded within a well-defined upward channel, respecting both the rising support and resistance lines, which confirmed a short-term bullish structure. During this phase, price produced a series of higher highs and higher lows, showing steady buyer control. This bullish move eventually led to a breakout into a broader range, where price action shifted into consolidation, reflecting temporary balance between buyers and sellers.
Currently, EURUSD is trading below the key Resistance Zone and is moving toward the Support Zone near 1.1600, which aligns with prior demand and a structural reaction area. The sharp rejection from resistance suggests that the recent bullish move was corrective rather than impulsive, and momentum has now shifted in favor of sellers.
My Scenario & Strategy
My primary scenario: as long as EURUSD remains below the 1.1690 Resistance Zone, the bearish bias remains valid. I expect price to continue its downside move toward the 1.1600 Support Zone, which acts as the first key downside target. Acceptance below this support would open the door for further bearish continuation toward lower levels.
However, a strong bullish reclaim and acceptance back above the resistance zone would invalidate the short scenario and signal a potential return into the range. For now, sellers are in control after the fake breakout, and price action favors further downside as long as resistance holds.
That’s the setup I’m tracking. Thank you for your attention, and always manage your risk.
