Trading Secrets in the World Market1. Understanding Market Structure and Participants
One of the most important trading secrets is understanding who participates in the global market and why. Markets are driven by different players such as central banks, governments, institutional investors, hedge funds, commercial hedgers, proprietary traders, and retail traders. Each participant has different objectives. For example, central banks focus on inflation, interest rates, and currency stability, while institutions seek long-term returns and liquidity. Retail traders often chase short-term price movements.
Price movements are largely influenced by large institutions because of their capital size. Successful traders align themselves with institutional flows rather than trading against them. Recognizing accumulation, distribution, and liquidity zones allows traders to understand where big money is entering or exiting the market.
2. Trend Is the Core of Profitable Trading
A powerful secret in world markets is that trends exist across all time frames and asset classes. “The trend is your friend” is not a cliché; it is a survival principle. Most losing traders attempt to predict tops and bottoms, while successful traders follow trends and ride them as long as momentum remains intact.
Trends are driven by macroeconomic forces such as economic growth, interest rate cycles, inflation, geopolitical developments, and technological innovation. Identifying higher highs and higher lows in uptrends, or lower highs and lower lows in downtrends, provides a structural framework for decision-making. Trading in the direction of the dominant trend significantly increases probability and reduces emotional stress.
3. Risk Management Is More Important Than Strategy
Many traders search endlessly for the “perfect strategy,” but experienced professionals know that risk management is the true secret to longevity. No strategy wins all the time. What separates successful traders from failed ones is how they manage losses.
Professional traders define risk before entering a trade. They use stop-losses, position sizing, and predefined risk-to-reward ratios. A common rule followed globally is risking only 1–2% of trading capital on a single trade. This approach ensures that even a series of losses does not destroy the account. Capital preservation is the first objective; profits come second.
4. Psychology Drives Market Behavior
Markets are a reflection of human emotions such as fear, greed, hope, and panic. One of the deepest trading secrets is mastering trading psychology. Even with the best analysis, emotional decision-making can lead to failure.
Fear causes traders to exit profitable trades too early, while greed makes them overtrade or ignore risk limits. Professional traders develop discipline through rules, routines, and trading journals. They understand that losses are part of the game and do not seek revenge trades. Emotional neutrality allows traders to execute their plans consistently, regardless of market noise.
5. Importance of Macro and Fundamental Analysis
Global markets are interconnected. A change in interest rates in the United States can impact currencies, commodities, equities, and emerging markets worldwide. Successful traders pay close attention to macroeconomic indicators such as GDP growth, inflation data, employment reports, trade balances, and central bank policies.
Fundamental analysis helps traders understand the “why” behind price movements. For example, rising interest rates typically strengthen a currency but may pressure equity markets. Commodity prices often reflect supply-demand imbalances and geopolitical risks. By combining fundamentals with technical timing, traders gain a strategic edge.
6. Technical Analysis as a Timing Tool
While fundamentals explain long-term direction, technical analysis provides precise entry and exit points. Charts reveal price patterns, support and resistance levels, trendlines, and momentum indicators. These tools work because they represent collective market psychology.
Professional traders keep their charts simple. Instead of using too many indicators, they focus on price action, volume, and key levels. Repeated reactions at certain price zones indicate areas of high interest where decisions should be made carefully. Technical discipline helps traders avoid impulsive trades.
7. Liquidity and Volatility Awareness
Another key trading secret is understanding liquidity and volatility. Markets behave differently during high-liquidity periods compared to low-liquidity sessions. For example, forex markets are most liquid during London and New York overlaps, while commodities react strongly during major economic releases.
Volatility creates opportunity but also increases risk. Smart traders adjust position size and stop-loss levels based on market volatility. They avoid trading during unpredictable events unless they have a clear strategy. Adapting to market conditions is essential for consistent performance.
8. Patience and Selectivity
Overtrading is one of the biggest mistakes made by traders worldwide. Successful traders know that not trading is also a decision. They wait for high-probability setups that align with their strategy, trend, and risk parameters.
Patience allows traders to preserve capital and mental energy. Markets offer endless opportunities, but only a few are worth taking. Selectivity improves win rates and reduces emotional exhaustion.
9. Continuous Learning and Adaptability
Global markets evolve constantly due to technology, regulation, and changing economic dynamics. Strategies that worked in the past may stop working. One of the most valuable trading secrets is adaptability.
Professional traders continuously review their performance, study new market developments, and refine their methods. They understand that learning never ends. Flexibility ensures survival in changing market environments.
10. Long-Term Perspective and Discipline
Finally, the ultimate trading secret is thinking in probabilities and long-term outcomes. Individual trades do not matter; consistency over hundreds of trades does. Successful traders focus on process rather than short-term results.
Discipline, patience, and humility keep traders grounded. Markets reward those who respect risk, follow rules, and accept uncertainty.
Conclusion
Trading secrets in the world market are not hidden formulas or insider information. They are timeless principles practiced by professionals across generations. Understanding market structure, following trends, managing risk, controlling emotions, analyzing macro factors, timing trades effectively, and maintaining discipline form the foundation of successful trading. Those who internalize these secrets do not chase markets—they align with them. Over time, this approach transforms trading from speculation into a structured and sustainable profession.
Forex-trade

Trading Strategies and Index InvestingA Comprehensive Guide for Modern Investors
Financial markets offer a wide spectrum of opportunities for wealth creation, broadly divided into active trading strategies and passive index investing. While both aim to generate returns, they differ significantly in philosophy, risk management, time horizon, and skill requirements. Understanding how these two approaches work—and how they can complement each other—is essential for investors navigating today’s fast-changing global markets.
Understanding Trading Strategies
Trading strategies are active investment approaches that seek to profit from short- to medium-term price movements in financial instruments such as stocks, indices, commodities, currencies, and derivatives. Traders rely on timing, analysis, and discipline rather than long-term economic growth alone.
1. Types of Trading Strategies
a. Day Trading
Day trading involves opening and closing positions within the same trading session. The objective is to capture intraday volatility. Traders use technical indicators like moving averages, RSI, MACD, and volume profiles. This strategy requires constant monitoring, quick decision-making, and strict risk controls.
b. Swing Trading
Swing traders hold positions for a few days to weeks, aiming to profit from price “swings” within a broader trend. This strategy blends technical analysis with basic fundamentals, such as earnings announcements or macro news. Swing trading is less stressful than day trading but still demands precision.
c. Position Trading
Position trading focuses on medium- to long-term trends, often lasting months. Traders base decisions on macroeconomic cycles, sector trends, and strong technical structures. This approach resembles investing but with more active entry and exit points.
d. Momentum Trading
Momentum traders buy assets showing strong upward movement and sell those in decline. The strategy is based on the belief that trends persist longer than expected. News, earnings surprises, and breakout levels play a crucial role.
e. Derivatives and Options Strategies
Advanced traders use futures and options for hedging, leverage, or income generation. Strategies like covered calls, spreads, and straddles allow traders to express views on volatility, direction, or time decay.
2. Advantages and Risks of Trading
Advantages
Potential for high returns in a short period
Flexibility across market conditions (bull, bear, sideways)
Ability to use leverage and hedging
Risks
High emotional and psychological pressure
Transaction costs and slippage
Risk of capital erosion without discipline
Successful trading requires a defined plan, risk management rules, position sizing, and continuous learning.
What Is Index Investing?
Index investing is a passive investment strategy that involves investing in a basket of securities that track a market index such as the Nifty 50, Sensex, S&P 500, or MSCI World Index. Instead of trying to beat the market, index investors aim to match market returns over the long term.
1. How Index Investing Works
Index funds and ETFs replicate the composition of an index by holding the same stocks in the same proportion. As the index grows with economic expansion and corporate earnings, investors benefit from compounding and long-term growth.
For example, investing regularly in a broad-market index captures:
Economic growth
Productivity improvements
Inflation-adjusted wealth creation
2. Benefits of Index Investing
a. Diversification
Index funds provide exposure to multiple companies across sectors, reducing company-specific risk.
b. Low Cost
Passive funds have lower expense ratios compared to actively managed funds, which significantly boosts long-term returns.
c. Simplicity and Discipline
Index investing eliminates emotional decision-making and market timing errors. Regular investments through SIPs encourage financial discipline.
d. Long-Term Wealth Creation
Historically, equity indices have delivered consistent real returns over long periods, making them ideal for retirement and long-term goals.
3. Risks and Limitations
No downside protection during market crashes
Returns are limited to market performance
Requires patience and long investment horizons
Despite short-term volatility, index investing rewards investors who stay invested and reinvest dividends.
Trading vs Index Investing: A Strategic Comparison
Aspect Trading Strategies Index Investing
Approach Active Passive
Time Horizon Short to medium term Long term
Skill Requirement High Low to moderate
Cost High (brokerage, taxes) Low
Risk High Moderate
Emotional Stress High Low
Trading seeks to extract alpha, while index investing focuses on capturing beta, the return of the overall market.
Combining Trading Strategies with Index Investing
A modern and balanced approach is to combine both methods:
Use index investing as the core portfolio for long-term wealth creation.
Allocate a smaller portion of capital to trading strategies for active income and skill development.
Profits from trading can be periodically invested into index funds, accelerating compounding.
Index investments provide stability during periods when trading performance fluctuates.
This “core–satellite” approach balances growth, stability, and opportunity.
Role of Market Cycles and Discipline
Markets move in cycles of expansion, contraction, and consolidation. Trading strategies often perform better in volatile or trending markets, while index investing shines during long-term economic growth phases. Understanding where the market stands in its cycle helps investors adjust expectations and capital allocation.
Regardless of the approach, discipline is the common foundation:
Clear goals
Defined risk limits
Consistent execution
Long-term perspective
Conclusion
Trading strategies and index investing represent two distinct yet complementary paths in financial markets. Trading offers the excitement of active participation and the possibility of higher short-term returns but demands skill, time, and emotional resilience. Index investing, on the other hand, offers simplicity, diversification, and reliable long-term wealth creation through the power of compounding.
For most investors, the optimal solution is not choosing one over the other but strategically combining both based on risk tolerance, time availability, and financial goals. In an increasingly complex global market environment, mastering this balance can lead to sustainable success and financial independence.

Global Equity TrendsNavigating Growth, Volatility, and Structural Shifts in World Markets
Global equity markets represent the collective pulse of the world economy. They reflect not only corporate earnings and economic growth but also investor sentiment, geopolitical realities, technological disruption, and policy decisions taken by governments and central banks. Over the past few decades—and especially in recent years—global equity trends have undergone significant transformation. Understanding these trends is essential for investors, policymakers, and analysts seeking to navigate an increasingly interconnected and dynamic financial landscape.
1. Evolution of Global Equity Markets
Historically, global equity markets were dominated by developed economies such as the United States, Western Europe, and Japan. These markets benefited from stable institutions, deep capital pools, and mature corporate sectors. Over time, globalization, liberalization of capital flows, and technological advances enabled capital to move more freely across borders. This laid the foundation for the rise of emerging markets, which now play a crucial role in global equity performance.
Today, global equities are no longer driven by a single region. Instead, market leadership rotates across geographies depending on economic cycles, interest rate regimes, and structural reforms. This diversification has increased opportunities but has also introduced new layers of complexity and risk.
2. Dominance of the United States in Global Equities
The United States remains the most influential equity market globally. US equities account for more than half of global market capitalization, driven largely by innovation-led companies in technology, healthcare, and consumer sectors. The rise of mega-cap technology firms has reshaped global indices, making US market performance a key determinant of worldwide equity returns.
Strong corporate governance, deep liquidity, and a culture of innovation have allowed US companies to consistently attract global capital. However, this dominance has also raised concerns about valuation concentration and overreliance on a narrow set of stocks to drive global performance.
3. Shifting Role of Europe and Japan
European equity markets have shown moderate but uneven growth. Structural challenges such as aging populations, slower productivity growth, and political fragmentation have limited long-term returns compared to the US. However, Europe continues to offer opportunities in industrials, luxury goods, renewable energy, and financials, especially during cyclical recoveries.
Japan’s equity market has experienced a renaissance after decades of stagnation. Corporate governance reforms, shareholder-friendly policies, and improving profitability have attracted renewed foreign interest. While demographic challenges persist, Japan’s focus on efficiency, automation, and export competitiveness continues to support equity growth.
4. Rise of Emerging Markets
Emerging markets (EMs) have become a central theme in global equity trends. Countries across Asia, Latin America, Eastern Europe, and Africa have seen expanding equity markets driven by urbanization, rising incomes, and industrialization. China and India, in particular, have emerged as major equity market powerhouses.
EM equities often outperform during periods of global growth and weaker US dollar cycles. However, they are also more sensitive to external shocks, capital flow reversals, and domestic policy risks. As a result, global investors increasingly adopt selective and thematic approaches rather than broad EM exposure.
5. Sectoral Shifts and Thematic Investing
One of the most important global equity trends is the shift from traditional sectors to new-economy themes. Technology, artificial intelligence, renewable energy, electric vehicles, biotechnology, and digital finance are now major drivers of equity returns worldwide.
At the same time, traditional sectors such as energy, materials, and financials continue to play a cyclical role, often outperforming during inflationary or recovery phases. This has led to a growing emphasis on sector rotation strategies, where investors shift capital based on macroeconomic conditions.
Thematic investing has gained prominence, allowing investors to capture long-term structural trends that transcend geographic boundaries.
6. Impact of Monetary Policy and Interest Rates
Global equity trends are deeply influenced by central bank policies. Periods of low interest rates and abundant liquidity have historically supported higher equity valuations. Conversely, tightening monetary conditions often lead to market corrections, increased volatility, and a shift toward defensive stocks.
In recent years, the global fight against inflation has reintroduced interest rate sensitivity into equity markets. Growth stocks, which rely heavily on future earnings, have become more volatile, while value and dividend-paying stocks have regained relevance.
7. Geopolitics and Fragmentation of Globalization
Geopolitical tensions have become a defining feature of modern global equity trends. Trade disputes, sanctions, military conflicts, and strategic competition between major powers have increased uncertainty and market volatility.
As globalization evolves into a more fragmented system, companies are rethinking supply chains, production hubs, and market exposure. This has implications for equity markets, favoring regions and companies aligned with domestic manufacturing, energy security, and strategic independence.
8. Role of Technology and Digital Transformation
Technology has fundamentally transformed global equity markets, not just in terms of listed companies but also market structure. Algorithmic trading, digital exchanges, real-time data, and increased retail participation have changed how markets function.
Global equity performance is increasingly linked to innovation cycles. Companies that adapt quickly to digital transformation tend to attract premium valuations, while laggards face declining relevance.
9. Sustainability and ESG Influence
Environmental, Social, and Governance (ESG) considerations have become an integral part of global equity trends. Investors are increasingly factoring sustainability, climate risk, and corporate ethics into valuation and capital allocation decisions.
While ESG investing has faced periods of skepticism, the long-term shift toward sustainable business models continues to influence equity markets, particularly in developed economies and large institutional portfolios.
10. Volatility, Cycles, and Long-Term Outlook
Global equity markets move in cycles influenced by economic growth, earnings trends, and investor psychology. Short-term volatility is inevitable, especially in a world marked by rapid information flow and policy shifts. However, over the long term, equities remain one of the most effective tools for wealth creation.
Looking ahead, global equity trends are likely to be shaped by demographic changes, technological innovation, climate transition, and evolving global power dynamics. Investors who understand these structural forces—and diversify across regions, sectors, and themes—are better positioned to navigate uncertainty and capture long-term growth.
Conclusion
Global equity trends reflect a world in transition. From the dominance of US markets to the rising influence of emerging economies, from traditional industries to disruptive technologies, equities continue to adapt to changing realities. While risks such as volatility, geopolitical tension, and policy uncertainty persist, global equity markets remain a powerful engine of growth. A disciplined, informed, and long-term perspective is essential to successfully navigate the evolving global equity landscape.

CHFJPY Bullish Scenario Mapped With Precision and Discipline🔥 CHF/JPY Bullish Expansion Play | Smart Money Accumulation Setup 🔥
📌 Asset Overview
CHF/JPY – “SWISS vs YEN”
Market: Forex
Trade Type: Swing / Day Trade
Directional Bias: 🟢 BULLISH CONTINUATION
🧠 Trade Thesis (Professional Outlook)
CHF/JPY is positioned within a bullish market structure, supported by higher highs & higher lows, indicating trend continuation. Price behavior suggests institutional accumulation, favoring long exposure on pullbacks rather than chasing breakouts.
📈 Trade Plan
🔹 Plan: Bullish Plan Active
🔹 Entry Method:
✅ Any Price Level Entry via Layered Execution
Layered Buy Structure (Scaling-In Model):
🟢 Buy Limit 1: 197.000
🟢 Buy Limit 2: 197.500
🟢 Buy Limit 3: 198.000
(Additional layers can be added based on personal risk & exposure rules)
📌 Why Layering?
This method allows average price optimization, reduces emotional execution, and aligns with smart money positioning during retracements.
🛑 Risk Management
❌ Stop Loss: 196.500
⚠️ Dear Ladies & Gentlemen (Thief OG’s)
This SL is not mandatory. Adjust risk according to your capital, leverage, and strategy discipline. Capital protection > profits.
🎯 Profit Objective
🎯 Target: 200.000
🚨 Exit Logic:
Strong overbought conditions
Major resistance zone (“Police Barricade”)
Potential liquidity trap & correction risk
📌 Rule: Escape with profits when price reaches resistance. Do not marry trades.
⚠️ Dear Ladies & Gentlemen (Thief OG’s)
TP is guidance only. Partial profits and trailing logic are encouraged.
🔗 RELATED PAIRS TO WATCH (Correlation Insight)
💵 USD/JPY
Acts as a risk sentiment leader
JPY weakness across USD/JPY strengthens CHF/JPY upside bias
Sharp USD/JPY reversals may signal temporary CHF/JPY pullbacks
💵 CHF/USD
CHF strength vs USD supports bullish CHF flows
CHF demand from safe-haven inflows boosts CHF/JPY continuation
💵 EUR/JPY
Confirms overall JPY weakness
Strong EUR/JPY momentum = supportive environment for CHF/JPY longs
📊 Correlation Summary:
Weak JPY + Stable/Strong CHF = Bullish CHF/JPY Structure
🌍 Fundamental & Economic Drivers (Trade Context)
🏦 Swiss Franc (CHF) Factors
CHF remains supported by financial stability & capital inflows
SNB policy remains measured, avoiding aggressive easing
CHF benefits during risk-off to neutral market regimes
🏯 Japanese Yen (JPY) Factors
JPY pressured by ultra-loose monetary stance
Yield differentials continue to weaken JPY
BoJ maintains accommodative bias → structural JPY weakness
🗞️ Key Upcoming Catalysts to Monitor
⚠️ These can increase volatility:
Central bank speeches (SNB / BoJ)
Inflation & CPI releases (Switzerland / Japan)
Risk sentiment shifts (equity volatility, bond yields)
Unexpected safe-haven flows
📌 Rule: Reduce exposure or protect profits before high-impact events.
✅ Final Trading Notes
✔ Trade with structure, not emotion
✔ Layer entries, don’t chase price
✔ Protect capital first
✔ Take profits near resistance
✔ Discipline > Prediction
🚀 If this setup adds value, support with a 👍 LIKE & 📌 SAVE
Let smart money lead — retail follows structure.
Happy Trading 📊🔥

Managing Currency Pegs1. Introduction to Currency Pegs
A currency peg is an exchange rate policy in which a country fixes the value of its domestic currency to another major currency (such as the US dollar or euro), a basket of currencies, or a commodity like gold. The primary objective of a currency peg is to maintain exchange rate stability, reduce volatility in international trade, and enhance investor confidence. Many developing and emerging economies adopt currency pegs to anchor inflation expectations and stabilize their macroeconomic environment.
However, managing a currency peg is complex and requires strong institutional capacity, sufficient foreign exchange reserves, and disciplined economic policies. Failure to manage a peg effectively can lead to severe financial crises, as seen in historical episodes such as the Asian Financial Crisis (1997) and Argentina’s currency collapse (2001).
2. Types of Currency Peg Systems
a) Fixed Peg
Under a fixed peg, the currency is tied at a constant rate to another currency. The central bank intervenes actively to maintain this rate.
b) Crawling Peg
A crawling peg allows gradual, pre-announced adjustments to the exchange rate, usually to offset inflation differentials.
c) Peg to a Basket of Currencies
Instead of a single currency, some countries peg to a basket, reducing dependence on one economy and smoothing external shocks.
d) Currency Board Arrangement
A currency board is a strict form of peg where domestic currency issuance is fully backed by foreign reserves, leaving little room for monetary discretion.
3. Objectives of Managing Currency Pegs
The management of currency pegs is driven by several economic objectives:
Exchange rate stability to promote trade and investment
Inflation control, especially in high-inflation economies
Policy credibility by anchoring monetary expectations
Reduction of currency risk for exporters and importers
Macroeconomic discipline, forcing governments to limit excessive deficits
For small open economies, these benefits can significantly outweigh the costs, provided the peg is managed prudently.
4. Role of Central Banks in Maintaining a Peg
a) Foreign Exchange Market Intervention
Central banks buy or sell foreign currency to maintain the pegged rate. When domestic currency weakens, reserves are sold; when it strengthens, reserves are accumulated.
b) Interest Rate Adjustments
Interest rates are aligned with the anchor currency to discourage speculative capital flows that could destabilize the peg.
c) Capital Controls
Some countries use capital controls to limit sudden inflows or outflows that may pressure the exchange rate.
d) Reserve Management
Adequate foreign exchange reserves are essential. A commonly used benchmark is reserves sufficient to cover at least 3–6 months of imports.
5. Fiscal Discipline and Policy Coordination
Effective management of a currency peg requires tight coordination between monetary and fiscal policy.
Large fiscal deficits undermine confidence in the peg
Excessive government borrowing can trigger speculative attacks
Structural reforms are often necessary to improve productivity
Without fiscal discipline, central banks may be forced to defend the peg through reserve depletion, eventually leading to collapse.
6. Challenges in Managing Currency Pegs
a) Loss of Monetary Policy Independence
Countries with a peg cannot freely adjust interest rates to respond to domestic economic conditions.
b) Speculative Attacks
If markets believe the peg is unsustainable, large capital outflows can rapidly drain reserves.
c) External Shocks
Global interest rate changes, commodity price swings, or geopolitical tensions can put pressure on pegged currencies.
d) Misalignment Risk
If the pegged rate does not reflect economic fundamentals, exports become uncompetitive and current account deficits widen.
7. Currency Pegs and Emerging Market Economies
Many emerging economies use currency pegs to stabilize volatile financial systems. However, success depends on:
Export competitiveness
Sound banking systems
Political stability
Transparent policy communication
For example, Gulf countries peg their currencies to the US dollar to stabilize oil revenues, while Hong Kong maintains a currency board to ensure financial stability as an international financial hub.
8. Crisis Management and Exit Strategies
Managing a currency peg also involves planning for orderly exit strategies. Abrupt de-pegging can trigger inflation, capital flight, and banking crises.
Common exit approaches:
Gradual shift to a crawling peg
Transition to a managed float
Pre-announced revaluation or devaluation
Clear communication and credibility are essential during transitions to prevent panic.
9. Advantages and Disadvantages of Currency Pegs
Advantages:
Predictable exchange rates
Lower transaction costs
Reduced inflation volatility
Improved trade planning
Disadvantages:
Vulnerability to external shocks
Reserve depletion risks
Reduced policy flexibility
Potential for financial crises
The trade-off between stability and flexibility is the central challenge in managing currency pegs.
10. Conclusion
Managing currency pegs is a delicate balancing act that requires strong institutions, disciplined fiscal policy, and sufficient foreign exchange reserves. While currency pegs can provide stability and credibility—especially for developing economies—they also impose significant constraints on monetary policy and expose countries to external shocks.
Successful peg management depends not only on central bank intervention but also on broader economic fundamentals, transparency, and market confidence. In a globalized financial system with high capital mobility, poorly managed pegs can quickly become unsustainable. Therefore, countries adopting currency pegs must remain vigilant, adaptable, and prepared with clear exit strategies to safeguard long-term economic stability.

Can AUD/NZD Extend Its Bullish Structure From Here?AUD/NZD Bullish Continuation | Swing & Day Trade Opportunity
📊 TRADINGVIEW IDEA DESCRIPTION
🏦 Asset Overview
AUD/NZD – “AUSSIE VS KIWI DOLLAR”
Forex Market Trade Opportunity Guide
⏳ Timeframe: Swing / Day Trade
📈 Market Bias
🟢 Bullish Plan Active
Trend structure remains supportive of upside continuation while pullbacks offer participation zones.
🎯 Entry Strategy
🟢 Entry: YOU CAN ANY PRICE LEVEL ENTRY
➡️ Suitable for both scaling-in and momentum-based traders depending on individual execution style.
🛑 Risk Management
🔴 Stop Loss: This is thief SL @ 194.000
⚠️ Dear Ladies & Gentlemen (Thief OG’s),
Adjust your SL based on your own strategy & risk profile.
I am not recommending using only my SL. Risk control remains your responsibility.
🎯 Profit Objective
🟡 Target Zone: 200.000
📌 Rationale:
Strong resistance zone ahead
Overbought conditions likely near highs
Trap + correction probability increases
➡️ Escape with profits, not greed
⚠️ Note:
I am not recommending using only my TP. You decide when and how to secure profits.
🔗 RELATED PAIRS TO WATCH (CORRELATION MAP)
💱 AUD-Driven Pairs
AUD/USD 💵 → Strength supports AUD/NZD upside
AUD/JPY 💵 → Risk-on sentiment confirmation
AUD/CAD 💵 → Commodity-linked AUD momentum check
💱 NZD-Driven Pairs
NZD/USD 💵 → NZD weakness strengthens AUD/NZD bullish bias
NZD/JPY 💵 → Risk sentiment + carry trade flow insight
📌 Key Correlation Insight
AUD/NZD is a relative strength battle
AUD strength + NZD weakness = bullish acceleration
Divergence between AUD/USD and NZD/USD often leads AUD/NZD moves
🧠 Pro Trading Notes
✔️ Ideal for trend continuation traders
✔️ Works best with price action + structure confirmation
✔️ Always align execution with your risk rules
💬 If this idea adds value, support with a 👍 Like & 💾 Save
📡 Follow for consistent market structure & clean setups
Trade smart. Manage risk. Stay disciplined.

USDCAD BUY | Day Trading AnalysisHello Traders, here is the full analysis.
Price reversal going up, levels for BUY .. GOOD LUCK! Great BUY opportunity USDCAD
I still did my best and this is the most likely count for me at the moment.
Support the idea with like and follow my profile TO SEE MORE.
Traders, if you liked this idea or if you have your own opinion about it, write in the comments. I will be glad 🤝
Patience is the If You Have Any Question, Feel Free To Ask 🤗
Just follow chart with idea and analysis and when you are ready come in THE GROVE | VIP GROUP, earn more and safe, wait for the signal at the right moment and make money with us💰

A Strategic Approach to Profiting from Market InformationNews Trading Without Noise
In modern financial markets, news travels faster than ever. Economic data releases, central bank statements, corporate earnings, geopolitical developments, and even social media posts can move prices within seconds. While news creates opportunities, it also creates noise—misleading signals, emotional reactions, rumors, and short-term volatility that can trap unprepared traders. News trading without noise is the disciplined practice of extracting high-quality, actionable information from news while filtering out distractions, overreactions, and irrelevant data. This approach allows traders to participate in major market moves with clarity, confidence, and consistency.
Understanding the Difference Between News and Noise
Not all news is equal. Markets react strongly only to information that changes expectations. Noise, on the other hand, consists of repetitive commentary, speculative opinions, exaggerated headlines, and minor developments that do not materially alter fundamentals. For example, a central bank interest rate decision that deviates from expectations is meaningful news, while repeated media debates about possible outcomes before the announcement are often noise. Successful news traders focus on what is new, unexpected, and impactful, rather than what is loud or popular.
Noise is dangerous because it triggers emotional trading—fear of missing out (FOMO), panic selling, or impulsive entries. News trading without noise requires emotional detachment and a rules-based mindset, where decisions are driven by predefined criteria rather than instant reactions.
Focusing on High-Impact News Events
A noise-free news trading strategy begins with selectivity. Traders should focus only on high-impact, scheduled, and well-defined events such as:
Central bank interest rate decisions and policy statements
Inflation data (CPI, PPI), employment reports, and GDP figures
Corporate earnings from market leaders
Major geopolitical events that affect global risk sentiment
Low-impact data releases and speculative breaking news should be ignored unless they directly affect market expectations. By limiting attention to a small set of powerful events, traders reduce cognitive overload and improve decision quality.
Trading Expectations, Not Headlines
Markets move based on the gap between expectations and reality. A positive news headline does not always lead to rising prices if the market had already priced in better outcomes. News trading without noise means understanding consensus forecasts, market positioning, and sentiment before the event.
For instance, if inflation data comes in high but slightly below expectations, markets may rally despite inflation remaining elevated. Traders who focus only on the headline number may misinterpret the move, while those who analyze expectations understand the true driver. This expectation-based approach helps traders align with institutional flows rather than fighting them.
Using Price Action as the Final Filter
Price action is the most reliable filter against noise. Before acting on news, traders should observe how the market reacts in the first few minutes or hours. Strong, sustained moves with high volume often indicate genuine institutional participation, while sharp spikes followed by quick reversals usually signal noise-driven volatility.
News trading without noise does not mean reacting instantly. Instead, it means waiting for confirmation. Breakouts above key resistance levels, breakdowns below support, or continuation patterns after news provide clearer, lower-risk entry points. Letting price validate the news helps traders avoid false signals.
Timeframe Alignment and Patience
Many traders lose money by trading news on timeframes that do not match the event’s significance. Short-term scalping during major news releases is extremely risky due to slippage and whipsaws. Noise-free news traders often prefer higher timeframes—15-minute, 1-hour, or even daily charts—where the true impact of news becomes clearer.
Patience is critical. Not every news event needs to be traded immediately. Sometimes the best opportunity emerges hours or days later, once the market digests the information and establishes a clear trend.
Risk Management Over Prediction
A core principle of news trading without noise is accepting uncertainty. News outcomes are unpredictable, and even correct analysis can result in losses due to unexpected market reactions. Therefore, risk management is more important than prediction.
Traders should use predefined stop-loss levels, conservative position sizing, and avoid overexposure during high-volatility periods. Protecting capital ensures longevity and reduces emotional pressure, making it easier to stay disciplined and ignore noise.
Avoiding Media and Social Media Traps
Financial media and social platforms often amplify noise. Sensational headlines, conflicting expert opinions, and real-time commentary can distort perception and push traders into impulsive decisions. Noise-free traders limit exposure to such inputs, relying instead on primary data sources, official releases, and their own analysis frameworks.
Developing a personal trading plan and sticking to it is the best defense against external influence. When traders know exactly what they are looking for, irrelevant information naturally fades into the background.
Building a Structured News Trading Framework
To trade news without noise, traders should create a structured framework that includes:
A predefined list of tradable news events
Clear rules for pre-news preparation and post-news execution
Specific technical levels for confirmation
Strict risk management guidelines
This structure transforms news trading from reactive gambling into a professional, repeatable process.
Conclusion
News trading without noise is not about being the fastest or reacting to every headline. It is about clarity, selectivity, and discipline. By focusing on high-impact information, understanding expectations, waiting for price confirmation, and managing risk carefully, traders can turn news from a source of confusion into a powerful trading edge. In an age of information overload, the ability to filter noise is not just an advantage—it is a necessity for consistent success in financial markets.

USD/JPY Trading Below SMA Signals Downside RiskUSD/JPY "THE NINJA" - BEARISH PROFIT PATHWAY SETUP 📉💰
📊 MARKET STATUS (REAL-TIME VERIFIED)
Current Price: ~154.79 - 155.14 ✅
Timeframe: 4H Chart Analysis
Market Sentiment: BEARISH with Strong Technical Confirmation
🎯 TRADE SETUP BREAKDOWN
🔴 ENTRY STRATEGY
Wait for Confirmation: Simple Moving Average BREAKOUT & RETEST
Entry Zone: Near @154.700
⚠️ IMPORTANT: Do NOT enter blindly! Wait for proper SMA breakout and retest confirmation in 4H timeframe.
🛑 STOP LOSS MANAGEMENT
Recommended SL: @155.500 (Thief's SL)
⚡ CRITICAL NOTES FOR OG TRADERS:
Place your SL AFTER breakout & retest confirmation
Adjust based on YOUR strategy and risk tolerance
This is NOT financial advice - trade at your own risk
Ladies & Gentlemen (Thief OG's): YOU control your risk management!
🎯 PROFIT TARGET
Primary TP: @153.500
Why This Target? 🔍
✅ Strong Support Zone
✅ Oversold Conditions
✅ Liquidity Trap Area
✅ Multi-pair Correlation Confluence
💎 SMART EXIT STRATEGY:
Scale out profits at psychological levels
Trail your SL as price moves in your favor
Ladies & Gentlemen (Thief OG's): Take money at YOUR discretion!
NOT a recommendation - YOUR money, YOUR rules!
💹 CORRELATED PAIRS TO WATCH (USD DOLLAR PAIRS)
🔗 POSITIVE CORRELATION (Move Together with USD/JPY)
USD/CHF - Swiss Franc pair (Strong USD correlation)
USD/CAD - Canadian Dollar pair (Commodity-linked)
🔄 NEGATIVE CORRELATION (Move Opposite to USD/JPY)
EUR/USD (~-1.1765) - Euro inverse relationship
GBP/USD (~1.3387) - Pound inverse movement
AUD/USD (~0.6650) - Aussie inverse correlation
YEN CROSS PAIRS TO MONITOR
EUR/JPY (~182.05) - Euro-Yen correlation check
GBP/JPY (~207.39) - Pound-Yen higher volatility
AUD/JPY (~102.77) - Commodity currency correlation
🧠 KEY TECHNICAL POINTS & CORRELATION INSIGHTS
📌 WHY THIS SETUP WORKS:
1. USD Strength Dynamics
When USD/JPY moves down, we typically see:
EUR/USD and GBP/USD move UP (negative correlation)
JPY strength across all yen crosses (EUR/JPY, GBP/JPY, AUD/JPY decline)
2. Multi-Pair Confirmation
Watch these for bearish confirmation:
If EUR/JPY and GBP/JPY show weakness = Strong JPY buying
If AUD/JPY breaks support = Risk-off sentiment (JPY gains)
If USD/CHF weakens = General USD weakness
3. Risk Sentiment Indicator
JPY is a SAFE-HAVEN currency:
Risk-off = JPY strengthens (USD/JPY drops)
Risk-on = JPY weakens (USD/JPY rises)
4. Central Bank Watch 🏦
Federal Reserve: Rate decisions impact USD strength
Bank of Japan: Potential policy shifts affect JPY direction
Interest rate differential = KEY driver for this pair
⚠️ RISK DISCLAIMER
🚨 READ CAREFULLY:
This is a trade idea, NOT financial advice
Past performance ≠ future results
Forex trading carries significant risk
Only risk capital you can afford to lose
Always use proper risk management (1-2% per trade max)
Adjust position sizing based on YOUR account size
NO guarantees of profit - markets are unpredictable
👥 Dear Ladies & Gentlemen (Thief OG's):
I am NOT recommending you blindly follow this setup. This is MY analysis based on technical confluence. YOU make your own decisions. YOU manage your own risk. YOU take responsibility for YOUR trades.
📈 TRADE MANAGEMENT CHECKLIST
✅ Wait for SMA breakout confirmation
✅ Confirm retest at @154.700 zone
✅ Check correlated pairs for confluence
✅ Set SL at @155.500 (or based on YOUR strategy)
✅ Monitor EUR/JPY, GBP/JPY for JPY strength
✅ Watch USD/CHF for USD weakness confirmation
✅ Scale out at @153.500 or your target
✅ Trail SL as trade progresses
🎯 FINAL WORD
This setup combines:
Technical breakout strategy
Multi-timeframe analysis
Correlation confluence
Risk management principles
Smart money concepts
Remember: The market doesn't owe you anything. Trade smart, manage risk, and protect your capital FIRST, profits SECOND.
💬 ENGAGE WITH THIS IDEA
👍 If you found this analysis helpful!
💭 Comment your thoughts and strategy
📊 Share your USD/JPY setups
🔔 Follow for more professional trade ideas
Stay Sharp. Trade Smart. "THE NINJA" Way! 🥷
Disclaimer: Trading involves substantial risk. This is educational content only. Always do your own research and consult with financial professionals before trading.
#USDJPY #ForexTrading #TechnicalAnalysis #DayTrading #PriceAction #TheNinja #BearishSetup #ForexStrategy #CurrencyCorrelation #RiskManagement #ForexEducation #TradingIdeas #JPY #USD #ForexSignals

NZD/CHF Price Action Supports Upside Continuation Scenario🔥 NZD/CHF Bullish Breakout After Kijun Retest — Upside in Play? 🔥
📊 Asset
NZD/CHF – “KIWI DOLLAR vs SWISSY”
Forex Market Trade Opportunity Guide (Swing / Day Trade)
🧭 Market Bias
🟢 Bullish Structure Confirmed
Price has successfully broken above the KIJUN Moving Average and completed a clean breakout + retest, signaling a shift in momentum from sellers to buyers. This type of Kijun behavior often acts as a trend continuation trigger when aligned with broader risk sentiment.
🎯 Trade Plan
📈 Bullish Plan – Active
✅ Confirmation: Kijun MA Breakout & Retest
🔓 Entry: You can enter at ANY price level
(Position sizing and timing should match your own execution model)
🛑 Stop Loss
🚫 Thief SL: 0.45600
Dear Ladies & Gentlemen (Thief OG’s),
Adjust your stop-loss based on your own risk management, volatility tolerance, and account size. This SL is not mandatory—it’s a reference level only.
⚠️ Note: I do not recommend blindly following my SL. You make money, you manage risk — your responsibility, your choice.
🎯 Target Zone
🎯 Primary Target: 0.46700
🚧 Police Barricade Resistance Zone
📊 Overbought conditions building
Potential liquidity trap near highs
Kindly escape with profits as price approaches this zone. Momentum may stall or reverse once supply steps in.
⚠️ Note: I do not recommend blindly following my TP. Scale out or exit based on your own system.
👀 Related Pairs to Watch (Correlation & Confirmation)
💱 NZD-Related (Risk Currency)
$NZD/USD 💵
🔹 Strong positive correlation with NZD/CHF
🔹 Kiwi strength vs USD supports upside continuation in NZD crosses
$AUD/NZD 💵
🔹 Acts as a regional sentiment gauge
🔹 AUD weakness vs NZD adds confidence to NZD bullish flows
💱 CHF-Related (Safe Haven)
OANDA:USDCHF 💵
🔹 CHF weakness vs USD often aligns with CHF weakness across the board
🔹 Rising USD/CHF = supportive for NZD/CHF upside
OANDA:EURCHF 💵
🔹 CHF selling pressure here confirms broader Swiss franc softness
🔹 Sustained EUR/CHF bids favor NZD/CHF bullish continuation
📌 Key Correlation Insight
📈 Risk-ON environment = NZD strength
📉 Risk-OFF environment = CHF strength
If equities and risk assets remain supported, NZD/CHF bullish structure stays valid.
🧠 Final Thought
This setup favors trend continuation traders following Ichimoku Kijun dynamics. Manage risk smartly, respect resistance zones, and don’t marry the trade.
💬 If this breakdown helps you, drop a LIKE ❤️, COMMENT 🗨️, and FOLLOW 🔔 for more clean market structures.
Trade safe. Trade disciplined. 💼📊

GBP/CHF Buyers Defend SMA – Bullish Structure Holds Strong📊 GBP/CHF – Pound Sterling vs Swissy
Forex Market Trade Opportunity Guide (Day / Swing Trade)
🧭 Market Bias
🟢 BULLISH
The bullish structure remains intact and technically confirmed after a clean Simple Moving Average (SMA) pullback, indicating that buyers are defending value zones and stepping back into the trend with strength.
🔍 Trade Plan – Technical Confirmation
✅ Primary Trend: Bullish
✅ Key Confirmation: Simple Moving Average Pullback
✅ Market Behavior: Healthy retracement, no structural breakdown
✅ Momentum: Buyers absorbing pullbacks → continuation favored
This setup favors trend continuation traders rather than counter-trend positions.
🎯 Entry Strategy – Thief Layer System
📌 Flexible Entry Allowed – Any Price Level
🕵️♂️ Thief Strategy (Layered Limit Orders)
Layering helps reduce emotional entries, improves average pricing, and allows smoother position building during pullbacks.
📥 Buy Limit Layers
1.05800
1.06000
1.06200
1.06400
(You may increase or reduce layers based on volatility & position sizing.)
🛑 Risk Management – Stop Loss
🔻 Thief SL: 1.05600
Dear Ladies & Gentlemen (Thief OG’s),
This stop loss is not mandatory. Adjust your SL based on:
Account size
Volatility conditions
Personal risk model
Capital protection always comes before profit.
🎯 Profit Objective
📈 Target Zone: 1.07500
⚠️ Triangular Moving Average acting as dynamic resistance
📊 Market showing overbought conditions
Possible liquidity trap near highs
👉 Smart money rule: Escape with profits near resistance, don’t wait for perfection.
Dear Ladies & Gentlemen (Thief OG’s),
This TP is a guideline, not a command. Scale out or trail profits based on your system.
🔗 Related Pairs to Watch (Correlation Insight)
💷 SPREADEX:GBP Strength Confirmation
FX:GBPUSD – If GBPUSD continues higher, it confirms Sterling strength, supporting upside in GBP/CHF.
OANDA:EURGBP – A bearish EURGBP indicates GBP outperformance, bullish for GBP/CHF.
🇨🇭 LSE:CHF Risk Sentiment Gauge
OANDA:USDCHF – A bullish USDCHF often signals CHF weakness, which supports GBP/CHF upside.
OANDA:EURCHF – Rising EURCHF also confirms Swiss Franc softness.
📌 Key Insight:
👉 Strong GBP + Weak CHF = Clean Fuel for GBP/CHF Continuation
🧠 Why This Setup Matters
Trend-aligned strategy (higher probability)
SMA pullback = institutional participation zone
Layering reduces emotional execution
Clear invalidation & profit zone defined
⚠️ Final Note
This idea is shared for educational and technical analysis purposes only.
You are fully responsible for your own risk, execution, and trade management.
📌 If this analysis adds value, boost it with a 👍 Like, 💬 Comment, and ⭐ Follow for more clean market blueprints.
Trade smart. Protect capital. Let structure do the work. 💼📈

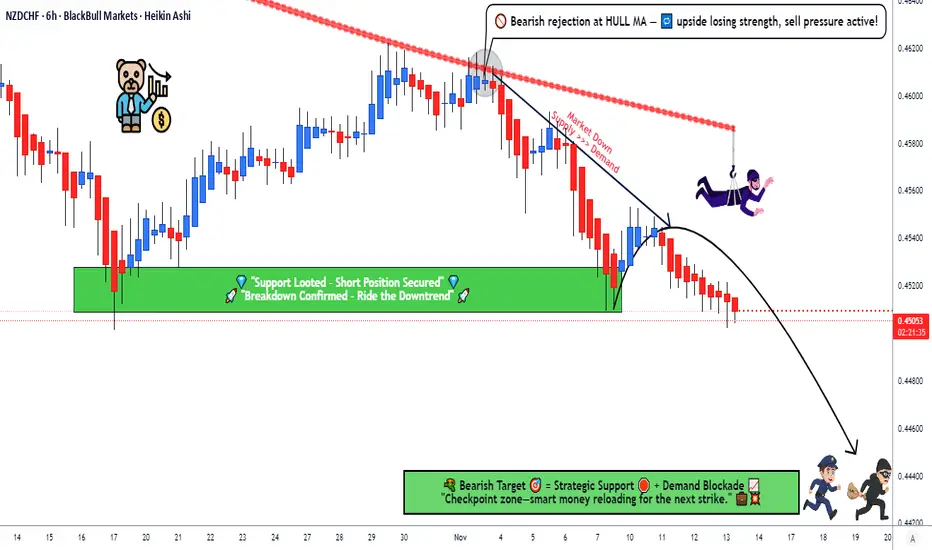
Will the Kiwi Fall Against the Swissy? Bearish Trend in MotionNZD/CHF Swing Trade Setup 🐻 | HULL MA Reversal & Support Breakout Confirmation! 🚨
🎯 Welcome, Traders! 🎯
Get ready for a high-probability swing trade opportunity on the NZD/CHF (Kiwi vs. Swissy)! This bearish plan is confirmed by a powerful technical confluence. Let's dive in! 👇
⚡ Trade Thesis: BEARISH ⚡
The pair is showing a classic trend reversal signature. We have a confirmed breakdown of a strong support level, coupled with a decisive pullback from the HULL Moving Average, signaling a shift in momentum to the downside.
📊 The Technical Edge (Why This Works):
HULL MA Rejection: Price has been rejected at the dynamic resistance of the HULL Moving Average, confirming the loss of bullish momentum. 📉
Support Turned Resistance: The previous strong support zone has now broken, and we expect it to act as a new resistance barrier.
Market Trap Identification: The structure suggests an overbought trap, where late bulls are likely getting squeezed. It's time to escape with the bears! 🐻➡️💰
🎯 Detailed Trading Plan (The "Thief" Strategy)
This plan uses a layered entry method to optimize your average entry price and manage risk effectively.
📍 Asset: NZDCHF | #Forex | #SwingTrade
🛑 Entry Strategy (Layer Method):
We are deploying multiple SELL LIMIT orders at the following key levels:
Layer 1: 0.45500
Layer 2: 0.45400
Layer 3: 0.45300
Layer 4: 0.45200
💡 Pro Tip: You can increase or decrease the number of layers based on your capital and risk appetite. The goal is to scale into the position.
🚨 Stop Loss (RISK MANAGEMENT):
A collective Stop Loss can be placed above the last layer and the recent swing high at 0.45600.
⚠️ Disclaimer: This is MY strategy. You MUST adjust your SL based on your personal risk tolerance and trading rules. Protect your capital first! 🙏
🎯 Take Profit Target:
Our primary profit target is set at 0.44400, a key support zone where we anticipate the next significant pullback or consolidation.
💰 Reminder: You are free to take partial profits along the way! Trail your stop or secure gains at your own discretion. The market is yours to conquer!
🔍 Related Pairs & Market Context
To strengthen your market view, keep an eye on these correlated assets:
OANDA:AUDCHF : The Australian Dollar often moves in correlation with the NZD (both are risk-sensitive, commodity-linked currencies). A bearish NZD/CHF is often confirmed by a weak AUD/CHF.
OANDA:NZDUSD & OANDA:AUDUSD : Watch the broader "Kiwi" and "Aussie" strength against the USD. If they are also showing weakness, it confirms a broader risk-off sentiment, strengthening our bearish NZD/CHF thesis.
OANDA:USDCHF : The Swiss Franc (CHF) is a traditional safe-haven. A strengthening CHF (weak NZD/CHF) might coincide with a weaker USD/CHF if the USD is also weak, or it could show pure CHF strength. Monitor this for clues on CHF flows.
Key Correlation Point: A strong bearish move in NZDUSD often amplifies the bearish move in NZDCHF.
💬 Let's Engage!
What do you think of this setup? 💭
Like & Follow if you found this analysis valuable!
Share your chart in the comments below!
🔔 Don't forget to follow my profile for more high-quality trade ideas and educational content!
#TradingView #ForexTrade #NZDCHF #SwingTrading #TechnicalAnalysis #Bearish #HULLMA #TradingStrategy #RiskManagement
EUR/AUD: Is the Euro Losing Ground Against the Aussie Dollar?💶 EUR/AUD – Euro vs Aussie Dollar | “Profit Pathway Setup” 💰
Market Type: Forex
Trade Bias: Bearish (Day Trade Setup)
🧠 Trade Plan
📉 Bearish outlook confirmed after a solid support-level breakout — showing potential continuation if momentum sustains.
The moving averages are acting as dynamic resistance, suggesting sellers remain in control while buyers hesitate to commit.
🎯 Setup Details
Entry: Any price level as per your trading style or confirmation signal.
Stop-Loss: @ 1.77000 (Thief SL – personal choice only!)
Take-Profit: @ 1.74700 — The moving average acts as a strong dynamic support, with oversold conditions and a possible liquidity trap. Be smart — escape with profits before the market flips!
💬 Note to all Ladies & Gentlemen (Thief OGs): I’m not recommending you use only my SL or TP. Manage your own trade wisely — make money, take money, and always trade at your own risk.
🧩 Key Technical Insights
📊 Price structure confirms a bearish momentum after a key support break.
🧭 Dynamic resistance is forming near the moving averages, maintaining downward pressure.
💫 RSI and short-term momentum indicators show oversold conditions — a caution zone for late sellers.
💥 Trap formation below 1.7500 could trigger quick liquidity reversals; secure profits before it snaps back.
🌍 Correlated Pairs to Watch
Watch these related pairs for directional clues and sentiment confirmation:
FX:EURUSD : If EUR weakens further, it strengthens the bearish outlook on EUR/AUD.
OANDA:AUDUSD : Strong Aussie performance supports downside continuation in EUR/AUD.
OANDA:EURNZD : Often moves similarly — watch for bearish extensions or reversal traps.
OANDA:GBPAUD : A bullish move here could hint at upcoming AUD weakness or exhaustion.
⚡ Summary
EUR/AUD is moving with a clear bearish rhythm — the “Profit Pathway” is open for those who play smart and stay alert.
As long as the resistance near 1.77000 holds, sellers maintain control with a potential drop toward 1.74700.
Remember, every thief knows when to take the cash and dash before the cops (buyers) show up! 🏃♂️💰
✨ “If you find value in my analysis, a 👍 and 🚀 boost is much appreciated — it helps me share more setups with the community!”
#EURAUD #Forex #DayTrade #TradingView #TechnicalAnalysis #ThiefTrader #FXStrategy #BearishSetup #PriceAction #ForexCommunity #EUR #AUD #MarketAnalysis

GBP/JPY Traders, Don’t Miss This 200 SMA Bullish Setup!🎯 GBP/JPY "Guppy" Bullish Momentum Play | SMA-200 Pullback Setup 🚀
📊 Market Overview
Asset: GBP/JPY (Cable vs Yen Cross)
Nickname: "The Guppy" 🐟
Trade Type: Swing/Day Trade Hybrid
Bias: BULLISH 📈
🧠 Technical Analysis
The Setup 🎯
We're eyeing a textbook pullback to the 200 SMA — the institutional magnet that's been holding the bullish structure intact. Price is showing respect at this dynamic support level, and we're positioning for the next leg up.
Key Technical Confirmations:
✅ 200 Simple Moving Average acting as dynamic support
✅ Bullish market structure intact on higher timeframes
✅ Momentum favoring upside continuation
✅ Risk-to-reward setup looking juicy
💰 The "Thief Strategy" Entry Method 🎭
Entry Philosophy: Multiple limit orders (layering style) to scale into position like a pro. Think of it as "catching the falling knife" but with style and risk management!
🎯 Entry Zones (Pick Your Poison):
Layer 1: 201.000
Layer 2: 201.500
Layer 3: 202.000
Layer 4: 202.500
You can add more layers based on your risk appetite and account size. The goal? Average in as price tests support!
🛡️ Stop Loss:
Thief's SL: 200.500
⚠️ Risk Disclaimer: This is MY stop level based on my strategy. You're the captain of your ship — set your own stops based on YOUR risk tolerance. Don't blindly follow; adapt to your own trading plan!
🎯 Take Profit Target:
TP Zone: 206.500
Why this level?
Strong resistance confluence ⛔
Potential overbought conditions 📊
Bull trap zone identified
💡 Smart Exit Strategy: Lock in profits progressively! Consider taking partials along the way. Remember, "you can make money, then TAKE money" — don't get greedy!
🔗 Correlated Pairs to Watch
Keep an eye on these for confirmation:
Direct Correlations:
OANDA:EURJPY 💶💴 — Sister pair, similar yen exposure
OANDA:AUDJPY 🦘💴 — Risk-on sentiment gauge
FX:GBPUSD 💷💵 — Cable strength indicator
Inverse Correlations:
FX:USDJPY 💵💴 — Yen strength/weakness
TVC:DXY (US Dollar Index) 💵 — Overall dollar sentiment
Pro Tip: If EUR/JPY and AUD/JPY are also bouncing from support, it confirms broad yen weakness = stronger Guppy setup! 🐟📈
🎓 Key Points to Remember
SMA-200 Respect: This ain't just any moving average — institutions watch this level religiously
Layering = Risk Management: Don't YOLO your entire position at one price
Yen Pairs Move Together: Watch the JPY crosses for confirmation
Patience Pays: Let price come to YOUR levels, don't chase
Profit Taking is a Skill: Nobody went broke taking profits! 💰
⚖️ Risk Management Reminder
Position size according to your account (1-2% risk max recommended)
Each layer should be smaller portions of your total planned position
Adjust stops to breakeven after Layer 1 fills and price moves in your favor
Trail your stop as price approaches target
🎬 Final Thoughts
The Guppy is setting up nicely for a bounce play off the SMA-200. This is a patience game — let the market come to you, execute the plan, and manage risk like a professional thief (the good kind 😉).
Remember: This is swing/day trade hybrid, so don't expect instant gratification. Give the setup room to breathe!
✨ If you find value in my analysis, a 👍 and 🚀 boost is much appreciated — it helps me share more setups with the community!
#GBPJPY #Guppy #ForexTrading #SwingTrading #DayTrading #TechnicalAnalysis #SMA200 #PullbackStrategy #ThiefStyle #ForexSignals #TradingSetup #PriceAction #RiskManagement #ForexCommunity #TradingIdeas #JPYCross #BullishSetup #ForexStrategy #TradingView #ChartAnalysis

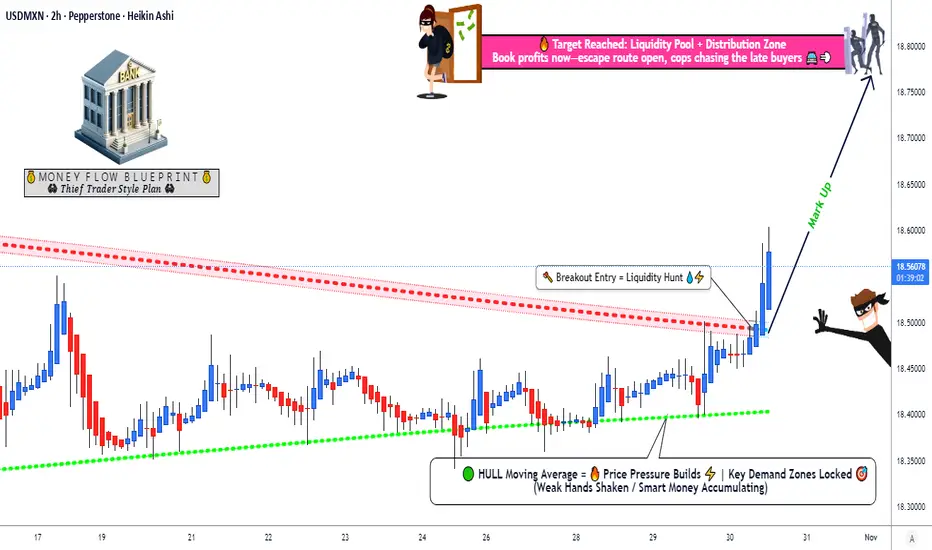
USD/MXN Bulls Prepare for Breakout as Momentum Rebuilds🕵️♂️💰 Thief Trader’s Heist on USD/MXN! 💹💎
“US Dollar vs Mexican Peso – Profit Pathway Setup (Swing / Day Trade)”
🧭 Plan Overview
We’re going BULLISH 🟢 on USD/MXN — quiet before the breakout 💥
✅ Confirmation comes from HULL Moving Average pullback
✅ + Triangular Moving Average breakout 🔺
Once that combo fires, it’s game on! 🏁
Our thief-style blueprint? Layered limit buys to catch every dip like a pro sniper 🎯
💸 Entry Plan – “Thief Strategy” (Layering Style)
We don’t chase — we set traps for price!
Multi-layer buy limits ready to ambush the market 👇
💰 18.45000
💰 18.50000
💰 18.55000
(Add more layers if you feel spicy 🌶️)
🧠 Logic: Price respects your zone → Layers get filled → Ride the breakout!
🛑 Stop Loss (SL)
📍 Thief’s defensive wall: 18.40000
💬 Note: Dear Ladies & Gentleman (Thief OG’s) — this SL is my version of the escape hatch. Manage risk your own way — you’re the final boss of your account! 👑
🎯 Take Profit (TP)
🎯 Primary Target: 18.85000 (🚔 Police Barricade Resistance)
⚡ Quick Escape Zone: 18.80000
💬 Reason: Strong resistance + overbought trap ahead — grab the loot and vanish 🏃♂️💨
📢 Note: Dear Ladies & Gentleman (Thief OG’s) — my TP is just my play. Take your own prize at your own pace! 💼
🌍 Correlated Pairs to Watch
$USD/JPY – Check USD momentum 💪
💶 FOREXCOM:EURMXN – Confirms MXN weakness 🔻
💵 OANDA:USDCAD – USD trend + oil link 👀
💂 CAPITALCOM:GBPMXN – MXN risk sentiment barometer 📊
INDEX:ME / IPC Mexico (Mexican Stock Index): A strong Mexican economy can strengthen the MXN.
TVC:DXY (US Dollar Index): The USD side of the pair. A strong DXY generally boosts USD/MXN.
EUR/USD: The world's most popular pair often has an inverse correlation with USD pairs.
📈 If USD flexes strength across majors or EM currencies get shaky, USD/MXN could rally harder.
🧠 Market Key Points
✨ USD strength → Supports bullish thesis
✨ EM risk-off → Peso weakness tailwind
✨ MXN reacts to oil + domestic news
✨ HULL MA + Triangular MA = breakout clarity ⚙️
Simple formula:
📉 Pullback → 📈 Breakout → 💰 Profit potential
⚡ Final Words
Trade smart, layer smarter.
Don’t chase candles — let candles chase your layers 🔥
✨ “If you find value in my analysis, a 👍 and 🚀 boost is much appreciated — it helps me share more setups with the community!”
🧩 Disclaimer: This is Thief-style trading strategy just for fun — educational purpose only!
#Forex #USDMXN #SwingTrade #DayTrade #ThiefTrader #LayeringStrategy #HULLMA #TriangularMA #Breakout #USDStrength #ForexAnalysis #TradingViewIdeas #MarketHeist #ProfitPathway
EUR/USD – Price Action Triggers Bearish Opportunity🚀 EUR/USD “FIBRE” Metals Market Profit Playbook 🪓 (Day-Trade Setup)
🧠 Market Overview
Rob the Market here — diving into EUR/USD (“FIBRE”) with a bearish day-trade plan.
The 200 SMA is rejecting bull riders, and a SMA 786 breakout just slashed through dynamic support — giving us the green light for a downside play.
This setup runs on my signature “Thief Layered Strategy” — a professional-style, multi-entry approach that adds precision, reduces exposure, and keeps emotions cool.
💣 Trade Plan
Bias: Bearish ✅
Technical Confirmation:
• 200 SMA acting as key resistance — bulls got denied hard.
• SMA 786 breakout confirms bearish pressure.
• Dynamic support line flipped to resistance — trend favoring shorts.
🎯 Thief Layered Entry Strategy 💼
Instead of dumping one big order, this method spreads multiple sell-limit entries to scale in smartly as price develops.
💡 Why Layered Entries?
• Avoids premature entries in volatile moves.
• Smooths your average entry price for better R:R.
• Lets you add positions only when the market confirms your bias.
• Keeps the mind calm and the account safe — stealth moves only 😎
🔥 Example Layer Levels (Sell Limits):
First layer ➤ 1.16400 — initial resistance test zone.
Second layer ➤ 1.16200 — confirms rejection from 200 SMA.
Third layer ➤ 1.16000 — mid-zone entry, balanced risk.
Fourth layer ➤ 1.15800 — deep retrace trap entry, sniper fill zone.
🧠 Pro Tip: Adjust or add more layers depending on volatility and position size comfort. The Thief never rushes — he scales with patience.
🛡️ Stop Loss (Thief SL)
🔒 1.16800
Dear Ladies & Gentlemen (Thief OG’s): This is my thief-style stop, not a fixed rule.
Trade at your own risk — protect your loot before you rob the market! 🏦💨
💰 Target Zone (Thief TP)
🎯 1.14500 — major support zone + oversold levels + liquidity trap potential.
Perfect spot to escape with profits before the crowd catches on.
Again — this TP is flexible. The Thief exits quietly when the bag is full. 🤑
🔗 Related Pairs & Correlations to Watch
Keep your thief’s radar open for USD movement across majors:
• OANDA:USDCHF – Usually mirrors EUR/USD in reverse.
• FX:GBPUSD – Helps confirm overall USD strength or weakness.
• OANDA:EURGBP – Reveals EUR’s independent strength.
• TVC:DXY (US Dollar Index) – Strong DXY usually drags EUR/USD lower.
🔍 Key Points to Monitor
• Will the 200 SMA hold as resistance?
• Does the SMA 786 breakout retest fail or bounce?
• Volume + momentum alignment near entry layers.
• Any macroeconomic event shaking USD or EUR sentiment.
✨ “If you find value in my analysis, a 👍 and 🚀 boost is much appreciated — it helps me share more setups with the community!”
#EURUSD #Forex #DayTrade #ThiefStrategy #BearishSetup #LayeredEntries #SmartMoney #ForexCommunity #TradingViewIdeas #MetalsMarket #PriceAction

EUR/USD Slide Begins! Market Flow Shifts Bearish🎯 EUR/USD "THE FIBER" 🔥 | Cash Flow Heist Strategy (Swing/Day Trade)
📊 MARKET SETUP
🐻 Bias: BEARISH CONFIRMED
✅ Technical Confirmation: Triangular Moving Average Breakout
⚡ Strategy Type: The Thief Layering Method
🎯 THE HEIST PLAN (Entry Strategy)
🔫 Thief Style = Layered Limit Orders
Instead of one entry, we're placing multiple sell limit orders to catch the best average price:
Suggested Entry Layers:
🎯 Layer 1: 1.17000
🎯 Layer 2: 1.16800
🎯 Layer 3: 1.16500
🎯 Layer 4: 1.16300
Note: You can add more layers based on your account size and risk appetite. This is NY session pricing strategy.
🛡️ RISK MANAGEMENT
🚨 Stop Loss: 1.17300
💰 Take Profit Target: 1.15400
⚠️ IMPORTANT DISCLAIMER:
Dear Ladies & Gentlemen (Thief OG's) - These are MY levels for reference only. Always manage your own risk! If you see profit, secure it. Your account, your rules. Don't be greedy when the market pays you! 💵
Why 1.15400 Target?
Strong historical support zone
Oversold conditions likely
Bull trap territory - time to escape with the loot before reversal! 🏃♂️💨
🔗 CORRELATED PAIRS TO WATCH
Keep your eyes on these connected moves:
📈 Positive Correlation (Move together):
EURGBP
- Euro strength indicator
EURJPY
- Risk sentiment gauge
EURCHF
- Safe haven flow monitor
📉 Inverse Correlation (Move opposite):
DXY
(US Dollar Index) - The boss! Strong DXY = Weak EUR/USD
GBPUSD
- Cable follows Fiber's lead often
AUDUSD
- Risk-on/risk-off cousin
💡 Pro Tip: If DXY breaks higher while EUR indices weaken, this setup gets SPICY! 🌶️
🎓 KEY TECHNICAL POINTS
✅ Triangular MA Breakout = Momentum shift confirmed
✅ Multi-layer entries = Better average cost & lower risk per position
✅ 1.17300 SL = Tight stop above resistance
✅ 1.15400 TP = Major support + psychological level
✅ Risk:Reward = Solid 2:1+ depending on entry layers
📍 Current Levels (Oct 8, 2025):
Weekly High: 1.177
Weekly Low: 1.1663
Trend: Bearish pressure continuing
⚠️ FINAL DISCLAIMER
🎭 This is "Thief Style" trading strategy - created for educational and entertainment purposes only!
This analysis represents my personal trading approach and should NOT be considered financial advice. Trading forex carries substantial risk. Past performance does not guarantee future results. Always:
Do your own analysis
Risk only what you can afford to lose
Use proper position sizing
Never trade with borrowed money
YOU are responsible for YOUR trading decisions! 🎰
✨ If you find value in my analysis, a 👍 and 🚀 boost is much appreciated — it helps me share more setups with the community!
#EURUSD #Forex #TradingStrategy #SwingTrading #DayTrading #ForexSignals #TechnicalAnalysis #PriceAction #ForexTrading #CurrencyTrading #FiberSetup #ThiefStrategy #LayeredEntry #ForexCommunity #TradingView #ForexIdeas

Is NZD/JPY Setting Up for a Perfect Swing Trade Setup?🥝💴 KIWI vs YEN: The Ultimate Profit Heist Plan! (Swing/Day Trade Setup)
📊 Asset Overview
NZD/JPY | New Zealand Dollar vs Japanese Yen
Current Market Context: Price recently trading around 86.50, with recent volatility showing moves between 86.49 and 88.50
🎯 Trade Setup: BULLISH Bias
🚀 Entry Zones (Pick Your Poison)
1st Entry: @ 87.500 and above
For the aggressive OGs who love catching momentum
2nd Entry: Pullback & Retest @ 85.500+ (ATR Zone)
For the patient masterminds waiting for the clean retest
💡 Flexibility Note: You've got freedom anywhere above these levels — trade what you see, not what you feel!
🛡️ Stop Loss Zones (Guard Your Gold)
1st Entry SL: @ 86.500
Tight stop for momentum entries
2nd Entry SL: @ 85.000 (ATR Pullback Protection)
Wider net for retest entries
⚠️ Risk Disclosure: These are reference levels only! Adjust your stop loss based on YOUR risk tolerance and account size. This is your capital, your rules — manage it wisely!
💰 Target Zone (Escape with the Loot)
Primary Target: @ 89.500
🎪 What's Waiting There?
Strong resistance confluence
Overbought conditions likely
Potential liquidity trap zone
🏃💨 Exit Strategy: Don't get greedy! When you see profits, TAKE THEM. The market gives, but it also takes back. Scale out, lock gains, and live to trade another day.
📌 TP Flexibility: This target is guidance, not gospel. If you're in profit and want to secure gains earlier, DO IT! Your profit, your choice.
🔗 Related Pairs to Watch (Correlation Game)
Keep an eye on these correlated moves:
OANDA:AUDJPY | Sister Oceanic pair — moves together with NZD/JPY about 85% of the time
OANDA:NZDUSD | Kiwi strength indicator — if NZD/USD is bullish, it supports NZD/JPY upside
FX:USDJPY | The Yen boss — if USD/JPY rallies, JPY weakness helps NZD/JPY climb
OANDA:EURJPY | Risk sentiment gauge — risk-on = JPY weakness = NZD/JPY support
💵 Why These Matter:
All JPY crosses move on risk sentiment. When global markets are risk-on (stocks up, optimism high), JPY weakens and pairs like NZD/JPY, AUD/JPY, EUR/JPY rise. When fear hits (risk-off), JPY strengthens and these pairs drop. Watch the broader Yen picture!
Key Correlation Points:
✅ Strong correlation with commodity currencies (AUD, CAD)
✅ Inverse correlation with safe-haven flows (Gold, Bonds)
✅ Positive correlation with equity markets (S&P 500, Nikkei)
🧠 Technical Context
Bias: Bullish structure intact
Key Support: 85.000-85.500 (ATR zone)
Key Resistance: 89.500+ (profit-taking zone)
Strategy: Buy dips, sell rips, manage risk!
⚡ The Thief OG Mindset
This isn't financial advice — it's a treasure map. You decide if you want to dig. The market doesn't care about your feelings, your bills, or your dreams. It rewards patience, discipline, and ruthless risk management. Trade smart, not hard!
✨ If you find value in my analysis, a 👍 and 🚀 boost is much appreciated — it helps me share more setups with the community!
📜 Disclaimer
This is a "Thief Style" trading strategy shared purely for educational and entertainment purposes. This is NOT financial advice, investment guidance, or a recommendation to buy/sell any asset. Trading forex involves substantial risk of loss and is not suitable for all investors. Past performance does not guarantee future results. Always trade with money you can afford to lose, use proper risk management, and consult with a licensed financial advisor before making any trading decisions. By viewing this analysis, you acknowledge that all trading decisions are your own responsibility. Trade at your own risk! 🎲
#NZDJPY #ForexTrading #SwingTrading #DayTrading #KiwiYen #ForexSignals #TechnicalAnalysis #PriceAction #RiskManagement #ForexStrategy #CurrencyTrading #JPYPairs #ForexIdeas #TradingSetup #ForexCommunity #MarketAnalysis #ForexEducation #ThiefStyle #SmartMoney #ForexLife

Global Trading Economics Risk1. Macroeconomic Risks in Global Trade
Macroeconomic risks arise from changes in global economic conditions. These are the most common risks that affect trade flows, demand, profits, and investment decisions.
a) Economic Slowdowns and Recessions
When major economies like the US, China, or the EU slow down, global trade demand drops sharply. Lower consumer spending reduces imports, companies cut production, and global supply chains weaken. Recessions also increase unemployment, reduce investment, and cause businesses to delay expansion.
b) Inflation Risk
High inflation increases production costs, reduces the purchasing power of consumers, and forces central banks to raise interest rates. When interest rates rise:
borrowing costs go up
companies reduce investment
currency values fluctuate
export and import dynamics shift
Countries with high inflation become less competitive in global markets.
c) Interest Rate Risk
Central banks around the world adjust interest rates to control inflation, stabilize the currency, or stimulate growth. Higher interest rates strengthen a country’s currency, making exports expensive and imports cheaper. Lower interest rates weaken the currency and stimulate exports. These fluctuations directly impact global trade volumes and profitability.
2. Currency Risk in Global Trade
Currency risk is one of the biggest challenges in international trade. Because transactions usually happen in global currencies like USD, EUR, or GBP, sudden changes in exchange rates can create huge gains or losses.
a) Exchange Rate Volatility
If a country's currency depreciates suddenly, its exports become cheaper globally, but its imports become costly. On the other hand, a strong currency makes exports expensive and reduces foreign demand.
b) Currency Wars
Sometimes countries intentionally devalue their currency to boost exports. This creates competitive tension between nations and increases uncertainty for international traders.
c) Hedging Challenges
Companies use forex instruments (like forward contracts, options, and swaps) to protect themselves from currency movements. But hedging itself carries costs and complexity.
3. Geopolitical and Political Risks
Political instability and geopolitical conflicts are major sources of global trading risk. Any disruption in political relations impacts trade policies, supply routes, and investor confidence.
a) Trade Wars
Trade wars happen when countries impose tariffs and sanctions on each other’s imports. The US-China trade war is a clear example, with tariffs creating uncertainty for businesses and raising costs for consumers.
b) Conflicts and Wars
Geopolitical conflicts disrupt supply chains, increase commodity prices (especially oil and gas), and restrict trade routes. For example:
Middle East conflicts disrupt crude oil supply.
Russia–Ukraine conflict affected global wheat, gas, and fertilizer markets.
c) Policy Changes
Government decisions such as new taxes, export restrictions, sanctions, or regulatory reforms can abruptly change trade conditions.
d) Political Instability
Countries with unstable governments experience disruptions in production, currency fluctuations, investment losses, and lower international trust.
4. Supply Chain and Logistics Risks
Global trade depends on efficient supply chains. Any disruption can cause shortages, delays, and increased costs.
a) Shipping Delays and Container Shortages
Events such as port congestion, strikes, and logistical bottlenecks lead to delivery delays and higher freight costs.
b) Natural Disasters
Earthquakes, floods, cyclones, and pandemics can shut down ports, factories, and production hubs, affecting global supply networks.
c) Supply Chain Dependencies
Many countries depend heavily on specific nations for essential goods like semiconductors, crude oil, food, and pharmaceuticals. Disruptions in these supply hubs can impact global trade stability.
d) Transportation Risk
Breakdowns in transportation networks—such as railway issues, air cargo restrictions, or shipping route closures—cause massive trade disruptions.
5. Regulatory and Compliance Risks
International trade is heavily regulated. Countries follow trade agreements, tariffs, environmental rules, and safety standards.
a) Tariff Risk
Changes in customs duties, import taxes, and trade barriers can alter the profitability of cross-border sales.
b) Trade Agreement Risk
Countries may withdraw from agreements (like Brexit), renegotiate tariffs, or impose new conditions.
c) Compliance Risk
Businesses must follow:
environmental standards
labor laws
product quality rules
customs documentation
Non-compliance leads to fines, shipment delays, or bans.
6. Technological Risks in Global Trading Economics
Technology plays a critical role in modern trade, but it also introduces new risks.
a) Cybersecurity Threats
Hackers target:
financial transactions
supply chain software
logistics systems
digital shipping documents
A cyberattack can halt operations and compromise sensitive data.
b) Automation and AI Risks
Automation increases efficiency but also creates job losses and inequality. Over-reliance on AI systems can escalate risks if they malfunction.
c) Digital Trade Barriers
Countries sometimes restrict data transfers or impose digital taxes, affecting companies operating globally.
7. Commodity Market Risks
Global trade heavily depends on commodities like crude oil, natural gas, metals, and agricultural produce.
a) Price Volatility
Commodity prices fluctuate due to demand-supply imbalances, geopolitical tensions, weather conditions, or speculation. High volatility affects production costs and profit margins.
b) Resource Dependency
Countries dependent on a single commodity face extreme risk when prices fall (e.g., oil-exporting nations during a crude price crash).
8. Environmental and Climate Risks
Climate change is becoming one of the most significant long-term global trading risks.
a) Extreme Weather
Storms, droughts, and floods disrupt trade, damage crops, and shut down industries.
b) Carbon Taxes and Emission Rules
Global environmental regulations are changing how companies operate. Carbon taxes increase costs for exporters, especially in energy-intensive industries.
c) Sustainability Pressure
Consumers and governments demand eco-friendly production. Companies that fail to adapt face loss of market access.
9. Global Financial Market Risks
Financial markets influence trade through stock market performance, liquidity conditions, and investor sentiment.
a) Credit Risk
Companies and governments rely on global financing. Liquidity crises or credit downgrades increase borrowing costs.
b) Banking Risk
Banking collapses or regulatory failures impact trade finance, currency markets, and investor confidence.
10. Risk Management in Global Trading Economics
Companies and investors use several strategies to manage global trading risks:
Hedging using futures, options, and swaps
Diversifying markets and suppliers
Setting up supply chain redundancies
Political risk insurance
Strong financial planning
Digital security systems
Scenario analysis and stress testing
Effective risk management ensures long-term stability and profitability in global trade.
Conclusion
Global trading economics risks are unavoidable in today’s interconnected world. They emerge from economic cycles, political tensions, currency movements, supply chain disruptions, commodity volatility, and environmental changes. For traders, investors, and businesses, understanding these risks and adopting effective risk-management strategies is crucial to surviving and succeeding in global markets.

New Energy Market Trends1. Rapid Growth of Renewable Energy Capacity
One of the most dominant trends in the new energy sector is the unprecedented expansion of renewable power capacity—mainly solar, wind, and hydropower. Solar energy is leading the transition due to plummeting module costs, scalable technology, and supportive government policies. Large-scale solar parks, rooftop installations, and floating solar plants are becoming mainstream. Wind power, especially offshore wind, is growing rapidly thanks to improved turbine technology, higher capacity factors, and falling installation costs.
Developing countries, particularly India, China, and parts of Southeast Asia, are experiencing the fastest renewable capacity growth due to rising electricity demand and favorable national policies. Many countries are committing to Net Zero targets and increasing their proportion of renewable energy in the grid-mix. This shift is also being supported by private players, as corporate Power Purchase Agreements (PPAs) gain popularity for decarbonizing operations.
2. Energy Storage Becomes Essential for Grid Stability
With renewable energy’s intermittent nature, energy storage systems—especially lithium-ion batteries—have become critical. Storage allows solar and wind energy to be stored during peak production and used during high demand or low generation hours. This enhances grid reliability and reduces blackout risks.
Battery storage prices have been falling consistently, supported by innovation in lithium-ion chemistry, solid-state battery development, and economies of scale in production. Grid-scale battery farms, home energy storage, and industrial storage systems are growing globally. Additionally, alternative storage technologies like pumped hydro storage, flow batteries, and thermal energy storage are emerging as powerful solutions for long-duration needs.
Countries with high renewable penetration, such as Australia, Germany, and the United States, are heavily investing in hybrid renewable-plus-storage projects, which combine solar/wind with batteries to stabilize supply. This trend will continue as more renewable energy is integrated into power grids worldwide.
3. Green Hydrogen Gains Global Attention
Green hydrogen—produced using renewable energy through electrolysis—is becoming a key pillar of the clean energy transition. It provides a decarbonization pathway for hard-to-abate sectors like steel, cement, fertilizers, shipping, and heavy industries.
Major economies such as the European Union, Japan, South Korea, India, and China are investing heavily in national hydrogen strategies. Electrolyzer prices are expected to fall significantly as production scales up, similar to the trend seen in solar panels. Industrial clusters across the world are piloting hydrogen-based steel production, hydrogen fuel cells for vehicles, and hydrogen-powered power plants.
Hydrogen also acts as an energy storage medium, helping balance renewable power supply. The future will likely see widespread hydrogen hubs, export-import corridors, and integration with heavy industries.
4. Growth of Electric Vehicles (EVs) Reshapes Energy Demand
Electric mobility is one of the biggest disruptors in the energy market. EV adoption is accelerating due to falling battery costs, government incentives, improving charging infrastructure, and increasing environmental awareness. With automotive giants transitioning to all-electric fleets, EVs are reshaping the demand for electricity, metals, energy storage, and charging technology.
Charging infrastructure is becoming more widespread—public stations, fast chargers, home charging units, and battery swapping stations (popular in Asia) are expanding rapidly. Vehicle-to-grid (V2G) technology, which allows EVs to feed energy back into the grid, is another emerging innovation that may stabilize electricity networks.
The shift from internal combustion engines to EVs also affects the oil and gas industry, reducing long-term demand for petrol and diesel while increasing dependence on electricity and battery raw materials.
5. Digitalization and Smart Grid Technologies Transform Energy Systems
Smart grids and digital energy solutions are essential for managing the growing complexity of modern power systems. Real-time data, automation, smart meters, IoT-connected devices, and AI-driven energy management platforms are dramatically improving energy efficiency.
Smart grids help utilities balance demand and supply more effectively, reduce transmission losses, and manage decentralized renewable resources. Consumers also benefit through smarter home energy devices, solar-plus-storage systems, and real-time consumption insights.
AI and machine learning are being used for:
Predicting energy demand patterns
Optimizing renewable generation
Monitoring grid assets
Reducing energy waste
Enhancing power trading
Blockchain-based energy trading is also emerging, allowing peer-to-peer power purchase in local microgrids, making energy more democratized.
6. Carbon Markets and ESG Investing Accelerate Clean Energy Adoption
Global carbon markets—both compliance and voluntary—are growing as companies and nations commit to decarbonization. By putting a price on carbon emissions, governments incentivize cleaner technologies and penalize polluting industries. This pushes industries toward renewable energy, energy efficiency, and sustainable operations.
ESG (Environmental, Social, Governance) investing has gained tremendous momentum, with institutional investors increasingly allocating funds to companies with strong sustainability practices. Renewable energy companies, green bonds, and climate-focused funds are benefiting from this capital inflow.
Carbon credit trading, carbon offset projects, and nature-based solutions are becoming new investment categories. Companies are adopting internal carbon pricing to make environmentally conscious decisions and prepare for stricter regulations in the future.
7. Energy Transition Metals See Rising Demand
Clean energy technologies rely heavily on specific metals—lithium, cobalt, nickel, graphite, copper, and rare earth elements. As EVs, batteries, solar panels, and wind turbines scale up, demand for these minerals is surging.
This has triggered investments in sustainable mining, recycling technologies, and alternative materials to avoid supply chain bottlenecks. Countries are also exploring domestic mineral reserves to reduce dependence on dominant exporters. Circular economy initiatives—battery recycling, solar panel reuse, rare metal recovery—are gaining traction globally.
8. Distributed Energy and Microgrids Expand
Distributed energy resources (DERs) such as rooftop solar, small wind systems, home batteries, and local microgrids are becoming popular for both residential and commercial users. These systems reduce dependence on central grids and improve energy resilience.
Microgrids are particularly valuable for remote regions, military bases, industrial facilities, and disaster-prone areas. They can operate independently during grid failures, providing reliable and clean power.
DERs and microgrids help reduce transmission losses, lower consumer bills, and decentralize energy production—making energy more democratic and community-driven.
Conclusion
The new energy market is evolving faster than any previous phase in global energy history. Renewable power growth, battery storage, green hydrogen, EVs, smart technologies, and carbon markets are fundamentally reshaping how the world generates, distributes, and consumes energy. Innovations in digitalization, materials science, and policy frameworks further accelerate this transformation.
As nations pursue sustainability and energy security, the new energy sector will continue attracting massive investments and technological advancements, unlocking long-term economic, environmental, and social benefits. The coming decade marks a decisive shift towards decentralized, digital, and decarbonized energy systems—defining the future of global markets.

Price Is Sitting on a High-Probability Demand Zone 📌 MARKET OUTLOOK
USDJPY continues to move inside a well-defined descending channel, forming a clean sequence of Lower Highs and Lower Lows.
Right now, price has tapped the Demand Zone at the bottom of the channel — a level that has consistently acted as a reaction point. After rejecting this zone, the market created a small pullback, forming a clearer Entry Zone for a potential bullish correction.
The structure shows a classic pattern:
➡️ Bounce from Demand → Pullback → Higher Low → Long Setup
This gives us a high-probability opportunity to follow the upcoming corrective leg of the channel.
🎯 TRADE SETUP (Entry – SL – TP)
✅ ENTRY ZONE
155.10 – 155.25
(Aligned with the pullback and the retest highlighted in the chart.)
❌ STOP LOSS (SL ZONE)
154.70 – 154.85
(Placed safely below the Demand Zone and channel support to avoid noise.)
🥇 TAKE PROFIT 1 (TP1)
155.90 – 156.10
(Targeting the upper boundary of the channel.)
🥈 TAKE PROFIT 2 (TP2 – Extended Move)
156.60 – 157.00
(If price breaks market structure and shifts momentum upward.)

NZD/USD Bearish Play — Trend Reversal + Structured Sell Zones🐻 BEARISH SWING TRADE SETUP | NZD/USD "The Kiwi"
Hey Traders! 👋 Here's a detailed swing trade analysis for the NZD/USD pair, focusing on a high-probability bearish continuation play. We're using a strategic layered entry method to optimize our risk.
📈 Trade Thesis & Market Context
A bearish structure is confirmed, and price is currently exhibiting a classic pullback towards a key dynamic resistance (Moving Average). This setup aims to capture the next leg down in line with the prevailing downtrend.
⚡ The "Thief" Layered Entry Strategy
This plan uses multiple limit orders to "scale in" to the position, averaging your entry price as the pullback unfolds.
🎯 Entry Zone (Sell Limit Orders):
Layer 1: 0.56500
Layer 2: 0.56400
Layer 3: 0.56300
💡 Pro Tip: You can increase or decrease the number of layers and adjust prices based on your own capital and risk management.
🚨 Risk Management (Your Responsibility!)
Stop Loss (SL): A suggested stop loss is above the recent structure at 0.56700.
⚠️ IMPORTANT NOTE: I am NOT recommending you use only my SL. You MUST adjust your stop loss based on your personal risk tolerance, account size, and strategy. The market is unpredictable; protect your capital first!
🎯 Profit Targets (Take Profit - TP)
Primary Target (TP): 0.55900
Rationale: This target aligns with a strong support zone, oversold conditions, and a potential liquidity pool ("trap"). The goal is to "escape" with profits before any significant bounce.
⚠️ REMINDER: Just like the SL, this is a suggested target. You are free to take profits earlier or adjust based on how price action develops. Manage your own trade!
🔍 Key Correlations & Pairs to Watch
Understanding the Kiwi's relationships is crucial for this trade's context.
AUD/USD ( OANDA:AUDUSD ): 🦘 The "Aussie" and "Kiwi" are highly correlated commodity brothers. A strong downtrend in AUD/USD often reinforces bearish momentum in NZD/USD.
USD/CNH ( FX:USDCNH ): 🇨🇳 China's economy is a major driver for New Zealand's exports (especially dairy). A stronger USD/CNH (weaker Yuan) can signal risk-off sentiment and pressure the NZD.
TVC:DXY (US Dollar Index): 🇺🇸 A strong overall US Dollar, as shown by a rising DXY, provides a strong tailwind for this bearish NZD/USD setup.

EUR/NZD Builds Bullish Structure – Will Buyers Dominate?💶💚 EUR/NZD “EURO VS KIWI DOLLAR” — Profit Pathway Setup (Day Trade)
🎯 Market Bias:
Bullish momentum confirmed ✅ following a 786 LSMA breakout, showing potential continuation strength on intraday structure.
🧩 Entry Plan (Layering Strategy Style)
This setup uses a layered entry method (multi-limit strategy) to build position strength on pullbacks.
🟢 Buy Limits: 2.01000 / 2.01200 / 2.01400
(You can increase or fine-tune limit layers based on your risk management plan.)
💡 This approach helps catch liquidity dips before the main impulse move.
🛡️ Stop Loss:
📍 “Thief SL” positioned at 2.00800 — designed for tight risk control within short-term volatility.
⚠️ Note: Fellow traders (Thief OG’s 👀), this is not financial advice — you may adjust SL as per your personal plan. Trade smart, take money, move clean.
🎯 Target Zone (Police Barricade Ahead!)
🚧 2.03000 is marked as our resistance checkpoint — an area of previous overbought pressure and liquidity traps.
Plan to secure profits once price approaches this zone.
⚠️ Again — you’re the boss of your take-profit. My setup, your decision!
🧠 Technical Context & Market Insight
LSMA breakout above 786 retracement confirms bullish bias.
RSI mid-zone recovery supports upward momentum.
MACD histogram crossover indicates renewed buying pressure.
Watch for volatility spikes during London & NY overlap session.
🔗 Correlated Pairs to Watch
💷 $GBP/NZD → Similar Kiwi reaction strength; strong upward momentum often mirrors EUR/NZD.
💶 $EUR/AUD → Positive correlation; Euro performance gauge.
💵 $USD/NZD → Inverse bias; weakness in Kiwi could strengthen this play.
💸 $AUD/NZD → Regional flow confirmation; helps validate Kiwi strength/weakness patterns.
Monitoring these can provide inter-market confirmation before scaling in or adding layers.
✨ “If you find value in my analysis, a 👍 and 🚀 boost is much appreciated — it helps me share more setups with the community!”
🔖 #EURNZD #Forex #DayTrading #PriceAction #EUR #NZD #TradingView #TechnicalAnalysis #ThiefStrategy #BullishSetup #MarketInsights #LSMABreakout #SwingTrading #TradePlan #LiquidityZones #ForexTrader #RiskManagement
