AUDUSD LOCAL SHORT|
✅AUDUSD rallies into a clear premium PD array after sharp bullish displacement. Price is expected to mitigate supply, with smart money likely distributing before a bearish continuation toward sell-side liquidity below. Time Frame 2H.
SHORT🔥
✅Like and subscribe to never miss a new idea!✅
Forex-trading

EUR-GBP Free Signal! Buy!
Hello,Traders!
EURGBP is trading into a clean demand zone after a sharp displacement lower. Liquidity has been swept below prior lows, hinting at smart money absorption. Price is likely to retest demand before a bullish reaction toward upside imbalance.
--------------------
Stop Loss: 0.8631
Take Profit: 0.8680
Entry: 0.8656
Time Frame: 10H
--------------------
Buy!
Comment and subscribe to help us grow!
Check out other forecasts below too!
Disclosure: I am part of Trade Nation's Influencer program and receive a monthly fee for using their TradingView charts in my analysis.

NZD-USD Local Short! Sell!
Hello,Traders!
NZDUSD reacts into a premium supply zone after a strong bullish correction. Smart money distribution and bearish displacement suggest this move is corrective, with price likely to reject and seek sell-side liquidity lower.Time Frame 3H.
Sell!
Comment and subscribe to help us grow!
Check out other forecasts below too!
Disclosure: I am part of Trade Nation's Influencer program and receive a monthly fee for using their TradingView charts in my analysis.

The Bullish Counter-Strike: Can EURUSD Break the Shackles Hello everyone,
On the H1 timeframe, the key focus right now is not the volatility seen in the previous sessions, but how EURUSD is reacting after a strong rejection from the lower support zone and its subsequent push into a cluster of intermediate supply levels.
Structurally, the market has transitioned from a sharp impulsive decline into a potential trend reversal phase, marked by a V-shaped recovery off the 1.1670 lows. Currently, price is consolidating just below the 1.1730 mark, attempting to establish a higher low. The most recent candle price action shows a consolidation phase where buyers are absorbing the remaining sell-side pressure before attempting the next leg higher.
Following the aggressive bounce from the primary Support Zone, EURUSD is now rotating toward the first major hurdle around the 1.1742–1.1754 range. This area is technically important: it represents a prior breakdown point where the previous bearish momentum accelerated. The current price action suggests that the bulls are in control of the short-term narrative, but they face a series of "step-like" resistance zones that must be reclaimed to confirm a structural shift.
From a price action perspective, we are observing a classic accumulation pattern. The move higher appears impulsive, while the minor pullbacks are corrective and shallow, which is a hallmark of budding bullish strength. As long as price holds above the newly formed local support at 1.1723, the immediate bias remains skewed toward a breakout.
The projected path on the chart reflects this logic:
- A successful retest of the 1.1723–1.1730 level to confirm a solid base.
- An impulsive breakout through the 1.1750 resistance tier.
- A technical rally toward the primary Resistance Zone near the 1.1790–1.1800 psychological level.
Only a clean breakdown and acceptance back below the 1.1710 support zone would invalidate this recovery scenario and suggest that the bearish trend is resuming. Conversely, a reclaim of the 1.1760 level would be the first definitive signal that the mid-term bearish pressure has faded and a larger recovery is underway.
Until the breakout through the upper resistance tiers occurs, EURUSD is in a rebalancing phase. Patience around these intermediate supply zones remains critical to avoid being caught in a range-bound trap.
Wishing you all effective and disciplined trading.

GBP-CAD Local Short! Sell!
Hello,Traders!
GBPCAD trades below a dominant bearish trendline, with repeated buy-side failures showing smart money distribution. Expect a pullback into resistance followed by continuation lower toward resting sell-side liquidity.Time Frame 8H.
Sell!
Comment and subscribe to help us grow!
Check out other forecasts below too!
Disclosure: I am part of Trade Nation's Influencer program and receive a monthly fee for using their TradingView charts in my analysis.

EURUSD Under Structural StressHello Traders,
On the H1 timeframe, EURUSD is currently trading in a corrective-to-bearish structure after failing to hold above the previously marked resistance zone. Price was repeatedly rejected from this supply area, confirming it as an active distribution zone rather than a continuation base.
Following the rejection, price expanded lower and is now rotating toward the lower range, approaching a clearly defined support zone. The recent downside impulse shows increasing bearish pressure, suggesting that sellers remain in control in the short term.
This support zone now represents a critical decision area. If price stabilizes and holds above this level, a corrective rebound toward the prior intraday targets becomes possible. Such a move would be classified as a pullback within a broader range, not an immediate trend reversal.
However, failure to hold this support — especially with acceptance below the zone — would signal further structural weakness. In that scenario, downside continuation becomes the dominant path, invalidating any short-term bullish recovery expectations.
From a structural perspective, EURUSD is currently not offering a clean entry. Price is transitioning between resistance rejection and support testing. The next directional move will be defined by whether the market defends this support or breaks through it with conviction.
At this stage, patience is required. Let price confirm its reaction at the support zone before committing to directional bias.
Share your view below.

ETH Inside the Ascending Channel — Is a $3,400 Breakout ImminentEthereum is currently exhibiting a strong bullish recovery, trading within a well-defined ascending channel after successfully rebounding from its early 2026 lows near $2,970. The market structure is constructive, with price action respecting the channel boundaries and carving out a series of higher lows. Following a five-session rally across major assets, ETH is now consolidating near the $3,220 mark, showing resilience as it absorbs selling pressure at this local peak.
The narrative is shifting toward a potential "breakout" phase. On the H1 chart, the blue projection highlights a textbook "W-shaped" accumulation within the channel, suggesting that after a brief test of the lower boundary, momentum is likely to accelerate. The technical backdrop is further bolstered by a "triple-bottom" formation with a key neckline at $3,475, indicating that the current move is likely the start of a broader impulsive leg.
Technical alignment is healthy, as the price is trading above the EMA 50 ($3,183). This moving average is acting as a dynamic floor, converging with the lower trendline of the channel to create a high-probability demand zone for dip-buyers.
Key Levels
Resistance: 3,280 – 3,320 (Channel Upper Boundary) | 3,396 – 3,475 (Major Supply Wall)
Support: 3,210 – 3,230 (Channel Floor / Pivot) | 3,184 (EMA 50 dynamic support)
Deep Support: 3,010 (Start of 2026 Lows)
Trading Scenarios
➡️ Primary: Minor consolidation or a shallow pullback to test the $3,200 – $3,230 support zone → successful defense of the EMA 50 → a volatile breakout above the channel toward the $3,396 liquidity target.
⚠️ Risk: A failure to maintain the channel floor followed by a sharp hourly close below $3,183 (EMA 50) would signal exhaustion, likely triggering a deeper correction toward the $3,010 psychological level before any fresh accumulation begins.

H4 US Dollar Index (DXY) – Technical AnalysisThe US Dollar Index (DXY) is trading near 98.70 on the 4H chart, and it’s looking like it’s going to continue its recovery within that rising channel from the low at 97.75. Price has managed to take back the 50% Fib level at 98.24 and is now testing the resistance at 98.74 – which just so happens to be where a prior support level used to be.
The 200-EMA at 99.00 is a big deal as far as upside goes, while the supports sit at 98.12 and 97.9. RSI is sitting at 58, which is a pretty good sign. The trade idea is to pick up a few dollars on the dip near 98.30 and aim for 99.20, but set a stop loss below 97.95.

CADJPY RISING TRENDLINE|LONG|
✅CADJPY holds a clean bullish structure with price pulling back into a rising trendline. This looks like a textbook ICT retracement into dynamic support before continuation higher toward premium targets. Time Frame 12H.
LONG🚀
✅Like and subscribe to never miss a new idea!✅

EUR-AUD Bearish Breakout! Sell!
Hello,Traders!
EURAUD breaks below a well-defined horizontal supply, confirming bearish BOS. The move sweeps buy-side liquidity before continuation, with smart money targeting lower sell-side pools after minor mitigation. Time Frame 6H.
Sell!
Comment and subscribe to help us grow!
Check out other forecasts below too!
Disclosure: I am part of Trade Nation's Influencer program and receive a monthly fee for using their TradingView charts in my analysis.

Can Bitcoin Hold This Level?Hello Traders,
On the H1 timeframe, Bitcoin is currently trading back into a clearly defined resistance zone after recovering from the prior sell-off. The recent price action shows a series of higher lows, indicating short-term bullish pressure rebuilding as price rotates upward toward supply.
This resistance zone is a key decision area. Historically, this level has acted as a distribution zone, and price reaction here will determine whether the move develops into a sustained continuation or another corrective rotation.
If price manages to break above the resistance and hold with acceptance, the structure opens the path toward higher targets, as marked on the chart. In this scenario, continuation would likely unfold in stages, with upside extensions toward Target 1, then Target 2, and potentially Target 3, assuming structure remains intact.
However, failure to accept above resistance would likely trigger a pullback. A rejection from this zone could rotate price back toward the mid-range support levels. As long as price holds above the broader support zone, such a move would still be considered a corrective pullback within a developing recovery, not a full bearish reversal.
The bullish continuation scenario is invalidated if price decisively breaks below the marked support zone and shows acceptance below it. That would signal a structural failure and reopen the downside.
At this point, Bitcoin is not at a high-conviction entry area but at a decision zone. Patience and confirmation are required. Let the market show whether it accepts above resistance or rotates back toward support before committing to directional bias.
Share your view below.

EURJPY WILL GO UP|LONG|
✅EURJPY price is expected to retrace back into the demand PD array for a clean mitigation. Once sell-side liquidity is absorbed, bullish continuation is favored, with expansion toward buy-side liquidity above recent highs. Time Frame 5H.
LONG🚀
✅Like and subscribe to never miss a new idea!✅

EUR-CHF Rebound Ahead! Buy!
Hello,Traders!
EURCHF sweeps sell-side liquidity into a well-defined demand zone, showing strong SMC reaction. Absorption and bullish response suggest mitigation is in play, with price likely seeking higher buy-side liquidity on the rebound.
Time Frame 6H.
Buy!
Comment and subscribe to help us grow!
Check out other forecasts below too!
Disclosure: I am part of Trade Nation's Influencer program and receive a monthly fee for using their TradingView charts in my analysis.

The Energy Transition Boom: Powering a Sustainable Global Future1. Understanding the Energy Transition
Energy transition refers to the long-term transformation of how energy is produced, distributed, and consumed. Historically, energy systems have shifted before—from biomass to coal, coal to oil, and oil to gas. Today’s transition, however, is unique in its speed, scale, and urgency, as it is driven by the need to combat climate change and reduce greenhouse gas emissions.
The current transition emphasizes:
Renewable energy sources such as solar, wind, hydro, and geothermal
Electrification of transport and industry
Energy efficiency and smart grids
Decarbonization of hard-to-abate sectors like steel, cement, and chemicals
2. Key Drivers of the Energy Transition Boom
a. Climate Change and Net-Zero Targets
Governments worldwide have committed to net-zero emissions targets, many by 2050. These commitments are backed by international agreements such as the Paris Agreement, creating long-term policy certainty that accelerates investment in clean energy.
b. Rapid Cost Declines in Renewables
The cost of renewable energy has fallen dramatically over the past decade. Solar and wind power are now among the cheapest sources of electricity globally, even without subsidies. This cost competitiveness has made renewables economically attractive, not just environmentally desirable.
c. Technological Innovation
Advancements in battery storage, hydrogen technology, carbon capture, and digital energy management systems are solving intermittency and reliability challenges. Innovation is enabling renewables to scale faster and integrate more effectively into existing grids.
d. Capital Reallocation and Investor Pressure
Global investors are increasingly shifting capital away from fossil fuels toward ESG-aligned assets. Sovereign wealth funds, pension funds, and asset managers now view clean energy as both a growth opportunity and a risk management necessity.
3. Renewable Energy at the Core
Solar and Wind Power
Solar and wind are the backbone of the energy transition boom. Utility-scale solar parks, offshore wind farms, and decentralized rooftop systems are expanding rapidly. Emerging markets, with abundant sunlight and land availability, are becoming major growth hubs.
Hydropower and Geothermal
Hydropower remains a stable baseload renewable source, while geothermal energy is gaining traction in regions with favorable geology. Together, they provide reliability and diversification within renewable portfolios.
4. Electrification and the Rise of Electric Mobility
One of the most visible aspects of the energy transition boom is the electrification of transportation. Electric vehicles (EVs) are rapidly gaining market share due to falling battery costs, government incentives, and expanding charging infrastructure.
Beyond passenger vehicles, electrification is extending to:
Buses and commercial fleets
Two-wheelers and three-wheelers in emerging markets
Railways and urban transit systems
This shift is increasing electricity demand while simultaneously reducing oil dependence and urban pollution.
5. Energy Storage and Grid Transformation
Renewable energy growth requires robust energy storage and grid modernization. Battery energy storage systems (BESS) are becoming essential for balancing supply and demand, stabilizing grids, and enabling higher renewable penetration.
Smart grids, powered by AI and digital technologies, are improving:
Demand forecasting
Real-time energy management
Integration of distributed energy resources like rooftop solar and EVs
6. Hydrogen and the Next Frontier
Green hydrogen—produced using renewable electricity—has emerged as a critical pillar of the energy transition boom. It offers a solution for decarbonizing sectors where direct electrification is difficult, such as:
Steel and cement production
Long-haul transport and shipping
Aviation and chemical manufacturing
Countries are racing to build hydrogen ecosystems, from electrolyzers to pipelines and export hubs, positioning hydrogen as a future global commodity.
7. Economic and Employment Impact
The energy transition boom is a major job creator. Renewable energy, EV manufacturing, grid infrastructure, and energy efficiency projects are generating millions of new jobs worldwide.
Key economic benefits include:
Reduced energy import bills for fossil-fuel-dependent countries
Improved energy security and price stability
Development of new industrial clusters and supply chains
For emerging economies, the transition presents a chance to leapfrog traditional energy models and build sustainable growth pathways.
8. Geopolitical and Strategic Shifts
The transition is reshaping global geopolitics. Energy power is shifting from fossil fuel–rich nations to countries with:
Strong renewable resources
Advanced clean-tech manufacturing
Access to critical minerals like lithium, cobalt, and rare earths
This is creating new strategic alliances, trade routes, and competition over clean energy supply chains.
9. Challenges and Risks
Despite its momentum, the energy transition boom faces challenges:
Intermittency of renewables and grid constraints
High upfront capital costs in developing countries
Supply chain bottlenecks for critical minerals
Policy inconsistency and regulatory delays
Managing a just transition—ensuring affordability, energy access, and workforce reskilling—is essential to maintain social and political support.
10. The Road Ahead
The energy transition boom is not a short-term trend; it is a multi-decade structural shift. As technology matures and policy frameworks strengthen, clean energy will become the dominant foundation of the global economy.
Success will depend on:
Continued innovation and cost reduction
Strong public–private collaboration
Scalable financing solutions
Global cooperation to ensure inclusive growth
Conclusion
The energy transition boom represents a historic transformation of the global energy system—one that aligns economic growth with environmental sustainability. It is redefining how nations power their economies, how industries operate, and how societies consume energy. While challenges remain, the momentum is unmistakable. Those who adapt early—governments, companies, and investors—stand to benefit most from this once-in-a-generation shift toward a cleaner, more resilient, and sustainable future.

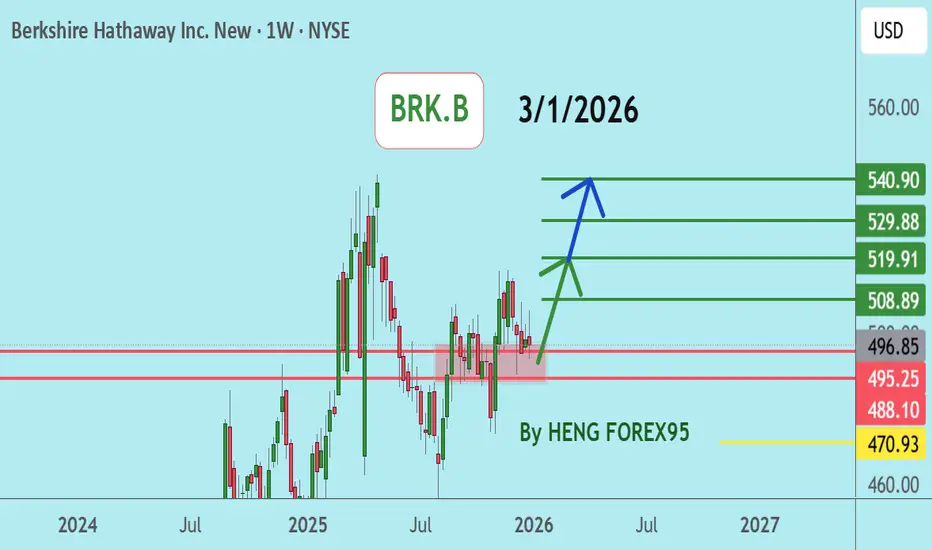
BRK.BBerkshire Hathaway (BRK.B) remains in an uptrend. If the price can hold above $486, there is a possibility of further price increases.
🔥Trading futures, forex, CFDs and stocks carries a risk of loss.
Please consider carefully whether such trading is suitable for you.
>>GooD Luck 😊
❤️ Like and subscribe to never miss a new idea!
EURCHF LOCAL LONG|
✅EURCHF reacts from a key discount PD array after sell-side liquidity sweep. Strong bullish displacement hints at mitigation complete, with price seeking buy-side liquidity toward the upper imbalance.
Time Frame 3H.
LONG🚀
✅Like and subscribe to never miss a new idea!✅

The Best Way of Trading in the Cryptocurrency Market1. Understand the Nature of the Crypto Market
Before trading, it is essential to understand how crypto markets differ from traditional markets. Cryptocurrencies are decentralized, largely unregulated in many regions, and driven by innovation, narratives, and global participation. Prices can move sharply within minutes due to news, whale activity, macroeconomic events, or social media sentiment. Volatility is both the biggest opportunity and the biggest risk. Successful traders accept volatility as a feature, not a flaw, and design strategies that can survive sudden price swings.
2. Choose the Right Trading Style
The best way to trade crypto depends heavily on your personality, time availability, and risk tolerance. Common trading styles include scalping, day trading, swing trading, and position trading.
Scalping focuses on very small price movements and requires speed, discipline, and low transaction costs.
Day trading involves entering and exiting positions within the same day to avoid overnight risk.
Swing trading aims to capture medium-term trends lasting days or weeks.
Position trading focuses on long-term trends based on fundamentals and macro cycles.
There is no universally best style; the best approach is the one you can execute consistently without emotional stress.
3. Focus on Liquidity and Quality Assets
A key rule in crypto trading is to trade liquid and well-established assets, especially for beginners. Coins like Bitcoin (BTC) and Ethereum (ETH) have high liquidity, tighter spreads, and more reliable technical structures. Low-liquidity altcoins can offer explosive gains, but they also carry higher risks of manipulation, slippage, and sudden crashes. The best way to trade is to prioritize quality over hype and avoid chasing every new token or trend.
4. Use Technical Analysis as a Core Tool
Technical analysis plays a central role in crypto trading because price action reflects collective market psychology. Learning how to read charts, identify trends, support and resistance levels, chart patterns, and indicators like moving averages, RSI, and volume is essential. However, indicators should not be used blindly. The best traders focus on price structure and market context first, using indicators only as confirmation tools rather than decision-makers.
5. Combine Fundamentals and Narratives
While technical analysis helps with entries and exits, fundamentals and narratives help with direction and conviction. Understanding a project’s use case, tokenomics, developer activity, ecosystem growth, and adoption trends can help traders decide which assets are worth trading. In crypto, narratives such as Layer-2 scaling, AI tokens, DeFi, NFTs, or Bitcoin halving cycles often drive sustained trends. The best way to trade is to align technical setups with strong narratives rather than trading random coins.
6. Master Risk Management
Risk management is the most important factor in long-term success. Even the best strategy will fail without proper risk control. Traders should never risk more than a small percentage of their capital on a single trade, typically 1–2%. Stop-loss orders are essential to protect against sudden market moves. Position sizing, risk-to-reward ratios, and capital preservation must always come before profit maximization. The best way of trading is to survive long enough to let skill compound.
7. Control Emotions and Trading Psychology
The crypto market is emotionally intense. Fear of missing out (FOMO), panic selling, overconfidence, and revenge trading are common reasons for losses. Successful traders develop emotional discipline by following predefined rules and avoiding impulsive decisions. Keeping a trading journal, reviewing mistakes, and maintaining realistic expectations helps build psychological resilience. The best way to trade crypto is to remain calm and rational, even during extreme volatility.
8. Avoid Overtrading and Leverage Abuse
Because crypto markets are always open, many traders fall into the trap of overtrading. Constant trading increases transaction costs and emotional fatigue. Similarly, excessive leverage can wipe out accounts quickly during sudden price swings. While leverage can be a useful tool for experienced traders, the best way of trading is to use it conservatively or avoid it entirely until consistent profitability is achieved.
9. Stay Updated but Filter Information
Crypto markets react quickly to news, but not all information is valuable. Social media is full of hype, rumors, and misleading advice. The best traders learn to filter noise and focus on credible sources, on-chain data, macro trends, and official announcements. Being informed is important, but reacting emotionally to every headline is dangerous.
10. Build Consistency and a Long-Term Mindset
The best way of trading in the crypto market is to think in terms of consistency rather than quick riches. Profitable trading is the result of repeated correct decisions over time, not one lucky trade. Losses are part of the process, and even top traders experience drawdowns. What separates successful traders is their ability to learn, adapt, and remain disciplined.
Conclusion
In conclusion, the best way of trading in the cryptocurrency market is a balanced and professional approach that combines market understanding, a suitable trading style, technical and fundamental analysis, strict risk management, and strong psychological control. Crypto trading is not gambling; it is a skill that improves with education, experience, and discipline. Those who focus on process over profits, protect their capital, and continuously refine their strategies are the ones who succeed in the long run.

Recovery Attempts Remain Corrective, Not a Trend ShiftOn the 1H timeframe, Gold is trading below a well-defined resistance zone around 4,440–4,460, which previously acted as a structural support area before being decisively broken. The sharp sell-off from the ATH region confirms a clear change in short-term market character, shifting price action from trend continuation into a corrective and rebalancing phase.
The recent decline shows strong bearish impulse, with consecutive large-bodied candles breaking through prior support and accelerating toward the lower demand area around 4,260–4,280. This type of move is typically associated with forced liquidation and liquidity release, rather than a healthy pullback. As a result, the market is now in a stabilization attempt rather than a confirmed reversal.
From a moving-average perspective, price is trading below both the 34 EMA and the 89 EMA, and both averages are sloping downward. This alignment reinforces that short-term momentum remains bearish, and any upside movement toward the resistance zone should be treated as a technical retracement, not a bullish continuation signal.
The current bounce from the lower support zone reflects reactive buying, likely driven by short-covering rather than fresh trend buyers. The projected recovery path toward the resistance zone represents a mean-reversion scenario, where price revisits previous supply to test whether sellers remain in control. Without a clean reclaim and acceptance above 4,460, upside attempts are structurally vulnerable to rejection.
From a macro perspective, Gold remains sensitive to USD strength and real yield expectations. In the absence of a clear risk-off catalyst or a sharp drop in yields, the broader environment supports range-to-bearish consolidation rather than immediate trend resumption.
In summary, Gold is currently in a post-impulse corrective phase. The dominant structure favors sell-side control below resistance, with the market likely oscillating between support and resistance until a decisive breakout occurs. Any recovery should be evaluated as corrective price action, not confirmation of renewed bullish momentum.

GBP/USD Pulls Back to Demand — Recovery Is ConditionalOn the 1H timeframe, GBP/USD has just completed a sharp bearish impulse, breaking below short-term structure and pushing price down into a well-defined support zone around 1.3420–1.3430. This move followed a clear rejection from the resistance area near 1.3480–1.3500, where prior buying attempts repeatedly failed. The speed and range of the sell-off indicate that sellers briefly regained control after a prolonged period of balance.
From a market structure perspective, the pair has transitioned from a choppy, sideways-to-slightly-bullish environment into a corrective bearish phase. The break below the 34 EMA, followed by price acceptance beneath both the 34 EMA and 89 EMA, signals a loss of short-term bullish momentum. The moving averages are now rolling over, suggesting that upside moves are currently corrective rather than impulsive.
The current support zone is technically significant, as it aligns with prior reaction lows and has previously attracted demand. The initial bounce projected from this area should be interpreted as a technical reaction, not a trend reversal. For any upside recovery to gain credibility, price must reclaim the 1.3480 resistance zone and hold above it with structure and momentum. Without that, rallies remain vulnerable to selling pressure.
In terms of price behavior, the projected path highlights a potential range rotation: a rebound from support, followed by consolidation and a test of resistance. This is consistent with markets that are digesting a recent impulse rather than immediately continuing in one direction. Failure to hold above support would expose the pair to deeper downside continuation, while acceptance above resistance would be required to shift bias back toward expansion.
From a macro context, GBP/USD remains sensitive to relative expectations around Bank of England versus Federal Reserve policy, as well as ongoing USD liquidity dynamics. With no immediate catalyst forcing repricing, the market is more likely to respect technical levels in the short term rather than trend aggressively.
In summary, GBP/USD is currently stabilizing at support after a bearish impulse. The setup favors caution: upside scenarios require confirmation through acceptance above resistance, while downside risk remains present if support fails. Until one of these boundaries is decisively broken, the pair should be treated as range-to-corrective, not directional.

Ethereum Compresses Below Major Supply On the 1H timeframe, Ethereum is trading within a well-defined sideways range, capped by a strong resistance zone around 3,050–3,080 and supported by a demand area near 2,900–2,920. Price has repeatedly failed to establish acceptance above the upper boundary, confirming that this zone remains a dominant supply area rather than a breakout level.
The sharp impulsive rally into resistance earlier in the session was followed by an immediate rejection, forming a classic stop-run and distribution reaction. This behavior indicates that liquidity above prior highs was absorbed by sellers, not followed by continuation. Since then, price has rotated back into the range, reinforcing the market’s balance condition rather than trend expansion.
From a structural perspective, Ethereum is currently printing overlapping candles and shallow pullbacks, characteristic of range-bound price action. The 34 EMA and 89 EMA are flattening and converging, which further supports the view that momentum is neutral and that the market is waiting for a catalyst to resolve the range.
On the downside, the support zone around 2,900–2,920 has been respected multiple times. Each test has produced a reaction, suggesting the presence of responsive buyers. However, these bounces lack strong follow-through, highlighting that demand is defensive rather than aggressive at this stage.
From a macro and sentiment standpoint, Ethereum remains highly correlated with broader crypto risk appetite and liquidity conditions. With no immediate macro shock or strong risk-on impulse, price action favors mean reversion within the range rather than a sustained directional move.
In summary, Ethereum is in a clear consolidation phase between major supply and demand. A clean breakout above 3,080 with acceptance and volume would be required to shift the structure bullish. Until that occurs, rallies into resistance and dips into support should be viewed as range rotations, not trend signals.

Accumulation Continues — Expansion Needs a Breakout.BITSTAMP:BTCUSD is stuck in a clear accumulation range, with price rotating between the 86,000 support zone and the 90,200–90,800 resistance area. Repeated rejections near the top of the range show supply remains active, while buyers continue to defend dips, keeping structure balanced rather than trending.
The EMA cluster is flattening, reinforcing range conditions and liquidity rotation. Directional expansion will require a clean break from this box.
Key Levels
Resistance: 90,200 – 90,800
Support: 86,000 – 86,500
Range focus: 86,000 – 90,800
➡️ Primary: hold above 86k → range continuation → push back toward 89.5k–90.8k.
⚠️ Risk: loss of 86k → downside sweep into lower demand before reassessment.

USD-CAD Will Fall! Sell!
Hello,Traders!
USDCAD will soon react into a key horizontal supply area after a bullish pullback. Sell-side imbalance remains intact, suggesting smart money distribution and a likely rejection toward internal sell-side liquidity below. Time Frame 3H.
Sell!
Comment and subscribe to help us grow!
Check out other forecasts below too!
Disclosure: I am part of Trade Nation's Influencer program and receive a monthly fee for using their TradingView charts in my analysis.

USDCAD LOCAL SHORT|
✅USDCAD remains bearish after strong displacement below a key supply level. Price failed to reclaim structure in premium, with sell-side liquidity drawing price lower toward the next downside objective. Time Frame 12H.
SHORT🔥
✅Like and subscribe to never miss a new idea!✅
