XAGUSDHello Traders! 👋
What are your thoughts on SILVER?
Silver experienced a sharp decline after a strong rally and printing a local high, correcting nearly 50% from its peak. Upon reaching the highlighted support zone, price showed a bullish reaction, indicating the presence of buyers and the validity of this demand area.
At this stage, we expect price to spend some time moving sideways and ranging within this zone before attempting a bullish corrective move toward the specified upside levels.
As long as price remains below the key resistance areas, any upside move should be considered corrective rather than trend-reversing.
Don’t forget to like and share your thoughts in the comments! ❤️
Forex

ETHUSD Trend Shift: Bullish CHoCH from Demand ZoneETHUSD on the 2H timeframe is coming out of a strong descending channel after tapping a clear demand zone near the lows. The market printed a bullish CHoCH (change of character), signaling a potential short-term trend reversal. Price is now consolidating around the Ichimoku cloud, suggesting early accumulation, with upside room toward the first resistance/target area around the 2,400 zone. Overall bias shifts from strong bearish momentum to a cautious bullish recovery while price holds above the demand base.

EURUSD Deep Pullback ScenarioQuick Summary
EURUSD rallied strongly throughout the last week gaining more than 250 pips without a proper correction
A pullback is highly likely to rebalance the fair value gaps and the Key levels to watch are 1.17687 and 1.17189
A bullish reaction may occur after testing the second FVG due to inducement at that level
Full Analysis
After the strong upside movement on EURUSD throughout the week price rise more than 250 pips without performing a meaningful retracement
Such impulsive moves usually leave significant imbalance in the market which often leads to a corrective phase
Because of this a downside move is highly likely in order to rebalance the fair value gaps left behind
The first area of interest sits around 1.17687 while the second fair value gap is located near 1.17189
Price may continue lower until the second FVG is tested
This area holds additional importance because there is inducement present which can attract liquidity and support a bullish reaction
If price reaches this zone and shows strength it may serve as the base for the next upside continuation

EUR/USD Calm Before the Next Big Move?The Euro’s setting up for what could be a textbook correction before the next drive up.
The question now: does 1.14 hold… or do we break deeper? 👇
Here’s the simple map:
🔻 Correction zone: Price is cooling off toward 1.14.
⚡ If 1.14 holds, we could see a clean bounce and a new leg higher.
⚠️ If it breaks, then eyes on 1.12, 1.10, and in a worst-case dip, 1.08–1.07.
So basically:
👉 Hold 1.14 = bounce potential
👉 Break 1.14 = deeper pullback ahead
Momentum is slowing; this is where smart traders are patient, not panicked.
If you’re watching EUR/USD and unsure where the best risk-to-reward setups might form, DM me; I’ll walk you through how I’m mapping my key levels and what I’m waiting for before jumping in.
Mindbloome Exchange

EURCHF WILL GO UP|LONG|
✅EURCHF taps into a refined demand zone after sell-side liquidity sweep. Strong bullish displacement and structure shift suggest smart money support, favoring continuation toward higher liquidity pools. Time Frame 4H.
LONG🚀
✅Like and subscribe to never miss a new idea!✅

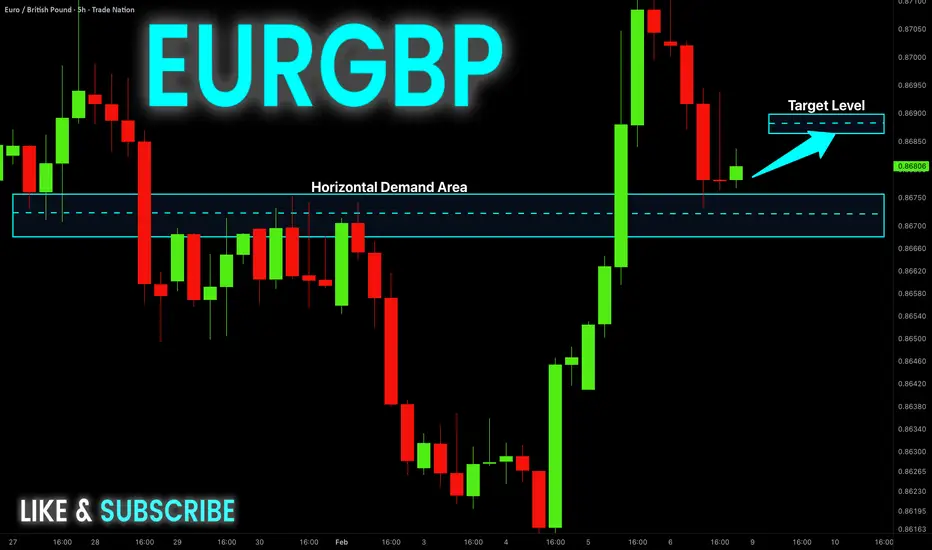
EUR-GBP Local Long! Buy!
Hello,Traders!
EURGBP reacts strongly from a well-defined horizontal demand zone after sell-side liquidity is swept. Bullish response and displacement suggest smart money accumulation, favoring a rebound toward higher liquidity. Time Frame 5H.
Buy!
Comment and subscribe to help us grow!
Check out other forecasts below too!
Disclosure: I am part of Trade Nation's Influencer program and receive a monthly fee for using their TradingView charts in my analysis.
USDCHF WILL GROW|LONG|
✅USDCHF reacts strongly from a discount demand PD array after mitigation. Bullish displacement and acceptance above demand suggest smart money accumulation, favoring continuation toward buy-side liquidity. Time Frame 3H.
LONG🚀
✅Like and subscribe to never miss a new idea!✅

USD-CAD Bullish Bias! Buy!
Hello,Traders!
USDCAD taps a strong horizontal demand zone after a sharp selloff. Bullish reaction and liquidity absorption suggest smart money accumulation, favoring a rebound toward higher liquidity. Time Frame 5H.
Buy!
Comment and subscribe to help us grow!
Check out other forecasts below too!
Disclosure: I am part of Trade Nation's Influencer program and receive a monthly fee for using their TradingView charts in my analysis.

NZDUSD FREE SIGNAL|SHORT|
✅NZDUSD trades into a premium supply PD array after bullish expansion. Bearish rejection and displacement confirm smart money distribution, favoring continuation toward sell-side liquidity below.
—————————
Entry: 0.6020
Stop Loss: 0.6034
Take Profit: 0.5996
Time Frame: 2H
—————————
SHORT🔥
✅Like and subscribe to never miss a new idea!✅

AUD-USD Free Signal! Sell!
Hello,Traders!
AUDUSD reacts from a well-defined horizontal supply area after a strong bullish push. Rejection and bearish displacement indicate smart money distribution, favoring continuation toward lower liquidity.
--------------------
Stop Loss: 0.7024
Take Profit: 0.6984
Entry: 0.7017
Time Frame: 2H
--------------------
Sell!
Comment and subscribe to help us grow!
Check out other forecasts below too!
Disclosure: I am part of Trade Nation's Influencer program and receive a monthly fee for using their TradingView charts in my analysis.

BTCUSD Facing Strong Resistance – Possible Drop After Fake BreakOn the 1H chart, BTCUSD shows a sharp recovery after a strong bearish channel breakdown, but price is now struggling near a major resistance zone around 69,000–70,000. The recent move looks like a fake breakout above the falling trendline, where buyers failed to sustain momentum.
This area is acting as strong resistance, and price is forming rejection wicks, suggesting selling pressure is building. If BTC fails to hold above this zone, we could see a pullback toward the 64,400 support level marked on the chart.
Key Points:
Bearish channel breakdown followed by weak recovery
Fake breakout near trendline resistance
Strong resistance at 69k–70k
Potential drop toward 64,400 support
Plan:
Watching for bearish confirmation here. A rejection from this zone can provide a good short opportunity with proper risk management.
This is not financial advice. Trade with risk management.

APPLE: Market of Sellers
Balance of buyers and sellers on the APPLE pair, that is best felt when all the timeframes are analyzed properly is shifting in favor of the sellers, therefore is it only natural that we go short on the pair.
Disclosure: I am part of Trade Nation's Influencer program and receive a monthly fee for using their TradingView charts in my analysis.
❤️ Please, support our work with like & comment! ❤️

SPY: Short Signal with Entry/SL/TP
SPY
- Classic bearish formation
- Our team expects fall
SUGGESTED TRADE:
Swing Trade
Sell SPY
Entry Level - 690.62
Sl - 692.78
Tp - 684.19
Our Risk - 1%
Start protection of your profits from lower levels
Disclosure: I am part of Trade Nation's Influencer program and receive a monthly fee for using their TradingView charts in my analysis.
❤️ Please, support our work with like & comment! ❤️

QQQ: Will Keep Growing! Here is Why:
The price of QQQ will most likely increase soon enough, due to the demand beginning to exceed supply which we can see by looking at the chart of the pair.
Disclosure: I am part of Trade Nation's Influencer program and receive a monthly fee for using their TradingView charts in my analysis.
❤️ Please, support our work with like & comment! ❤️

SILVER: Short Signal Explained
SILVER
- Classic bearish formation
- Our team expects pullback
SUGGESTED TRADE:
Swing Trade
Short SILVER
Entry - 78.099
Sl - 80.385
Tp - 74.346
Our Risk - 1%
Start protection of your profits from lower levels
Disclosure: I am part of Trade Nation's Influencer program and receive a monthly fee for using their TradingView charts in my analysis.
❤️ Please, support our work with like & comment! ❤️

TESLA Massive Long! BUY!
My dear followers,
This is my opinion on the TESLA next move:
The asset is approaching an important pivot point 410.99
Bias - Bullish
Technical Indicators: Supper Trend generates a clear long signal while Pivot Point HL is currently determining the overall Bullish trend of the market.
Goal - 425.61
About Used Indicators:
For more efficient signals, super-trend is used in combination with other indicators like Pivot Points.
Disclosure: I am part of Trade Nation's Influencer program and receive a monthly fee for using their TradingView charts in my analysis.
———————————
WISH YOU ALL LUCK

NATGAS Technical Analysis! BUY!
My dear subscribers,
This is my opinion on the NATGAS next move:
The instrument tests an important psychological level 3.405
Bias - Bullish
Technical Indicators: Supper Trend gives a precise Bullish signal, while Pivot Point HL predicts price changes and potential reversals in the market.
Target - 3.488
My Stop Loss - 3.360
About Used Indicators:
On the subsequent day, trading above the pivot point is thought to indicate ongoing bullish sentiment, while trading below the pivot point indicates bearish sentiment.
Disclosure: I am part of Trade Nation's Influencer program and receive a monthly fee for using their TradingView charts in my analysis.
———————————
WISH YOU ALL LUCK

US30 My Opinion! SELL!
My dear friends,
Please, find my technical outlook for US30 below:
The instrument tests an important psychological level 50111
Bias - Bearish
Technical Indicators: Supper Trend gives a precise Bearish signal, while Pivot Point HL predicts price changes and potential reversals in the market.
Target - 49609
About Used Indicators:
Super-trend indicator is more useful in trending markets where there are clear uptrends and downtrends in price.
Disclosure: I am part of Trade Nation's Influencer program and receive a monthly fee for using their TradingView charts in my analysis.
———————————
WISH YOU ALL LUCK

EURUSD Set To Fall! SELL!
My dear friends,
Please, find my technical outlook for EURUSD below:
The price is coiling around a solid key level - 1.1814
Bias - Bearish
Technical Indicators: Pivot Points Low anticipates a potential price reversal.
Super trend shows a clear sell, giving a perfect indicators' convergence.
Goal - 1.1802
Safe Stop Loss - 1.1823
About Used Indicators:
The pivot point itself is simply the average of the high, low and closing prices from the previous trading day.
Disclosure: I am part of Trade Nation's Influencer program and receive a monthly fee for using their TradingView charts in my analysis.
———————————
WISH YOU ALL LUCK

Gold ( important zone )As you can see in the attached TradingView chart (1-hour timeframe, XAU/USD around 4,964.62), gold has recently rallied sharply from lower levels (around the green demand zone near 4,700–4,750) and is now approaching a multi-layered supply zone highlighted in red.
Key observations from the chart:
Price has tested and reacted to the red supply bands multiple times, particularly around 5,024–5,035 and higher at 5,074–5,100.
The current price is consolidating/testing the lower edge of this supply area (~4,986–5,024), with yellow arrows indicating potential rejection and downward moves.
Bearish structure is visible with the price failing to hold higher after the recent pump, showing signs of exhaustion near these resistance layers.
On the 1H chart, we see potential bearish candlestick formations or rejection wicks at these levels.
I expect gold to show a very strong reaction (rejection) from these supply zones. With proper confirmations — such as a bearish engulfing candle, failure to break above 5,000–5,024 decisively, increased volume on downside, or bearish divergence on RSI/MACD — we can look to enter a sell trade targeting longer-term downside objectives, potentially back toward 4,850–4,900 initially, and deeper if momentum builds (e.g., toward the prior low zones or 4,700 area).
Risk management: Stops should be placed above the supply zone (e.g., above 5,074 or recent swing high) to protect against a breakout invalidation.
This is not financial advice; always DYOR and manage risk carefully.

EURUSD reay to bounceEURUSD is holding a structurally bullish recovery after a strong impulsive move higher, with price now retracing into a well-defined daily support and demand zone that previously acted as resistance, indicating a classic support flip and healthy pullback within an emerging uptrend. The current consolidation above this key level suggests sellers are losing momentum while buyers defend value, keeping bullish market structure intact as long as price holds above the zone. Fundamentally, the pair remains supported by easing US dollar strength amid growing expectations of Federal Reserve rate cuts later in the year, softer US macro data, and stabilizing risk sentiment, while the euro benefits from improving Eurozone growth outlook and reduced recession fears despite ongoing ECB caution. With liquidity absorbed on the downside, rising bullish momentum, and macro drivers favoring dollar weakness, this technical pullback into support aligns with continuation behavior, positioning EURUSD for a potential upside expansion toward higher liquidity zones, making this a favorable risk-to-reward environment for trend-following and smart money aligned long setups.

BTCUSD – 1H Chart Analysis & Trade Idea Bitcoin is trading within a broader descending channel, but recent price action shows a strong bullish reaction from channel support, suggesting a potential short-term recovery.
Technical Analysis
Price respected the lower trendline support of the descending channel and formed a rounded bottom / V-shaped recovery, indicating exhaustion of sellers.
A bullish structure shift is visible after the strong bounce from the lows, with higher highs and higher lows on the lower timeframe.
The green demand zone has acted as a solid support area, from which price is pushing upward.
The red descending trendline above is a key resistance and confluence area.
ALMA and dynamic levels suggest price is attempting a corrective move within the overall downtrend.
Aroon Oscillator is strongly bullish, confirming increasing upside momentum.
Trade Idea
Entry: Buy on pullback / confirmation within the marked green support zone.
Target: Upper resistance zone near the descending trendline (marked “Target”).
Bias: Short-term bullish correction, long-term trend still bearish unless price breaks and holds above the descending trendline.
Invalidation: A strong close below the demand zone and channel support.
Conclusion
This setup favors a counter-trend bullish move toward resistance. Traders should manage risk carefully, as the overall market structure remains bearish until a confirmed breakout occurs.
This analysis is for educational purposes only and not financial advice.
BTCUSD CHoCH Signals Trend Reversal Clear structure break + CHoCH on BTCUSD (2H). Based on what you marked, here are clean upside targets:
🎯 BTCUSD Upside Targets (after CHoCH)
Target 1 (TP1):
78,000 – 79,000
Previous supply / structure resistance
First logical profit-taking zone
Target 2 (TP2):
83,500 – 84,500
Higher timeframe resistance
Major liquidity / imbalance area
Strong swing target if bullish momentum continues
Invalidation / Risk Area (for bias)
If BTC loses 65,000 – 64,000, bullish setup weakens and downside continuation becomes likely.
Short & Simple Caption (for your post)
BTC breaks bearish structure and shows CHoCH on 2H, hinting at a potential trend reversal. Price may target higher liquidity zones if bullish momentum holds.
