EURUSD BULLISH REBOUND|LONG|
✅EURUSD price is drawing back into the demand block, where internal liquidity sits below the short-term lows. A clean rebalance from this zone can fuel a continuation toward the next upside target. Time Frame 2H.
LONG🚀
✅Like and subscribe to never miss a new idea!✅
Forex

EURUSD could dropA downward move in EURUSD could initiate from its current price range,
or from either the 1.16284 or 1.64500 levels. CMCMARKETS:EURUSD

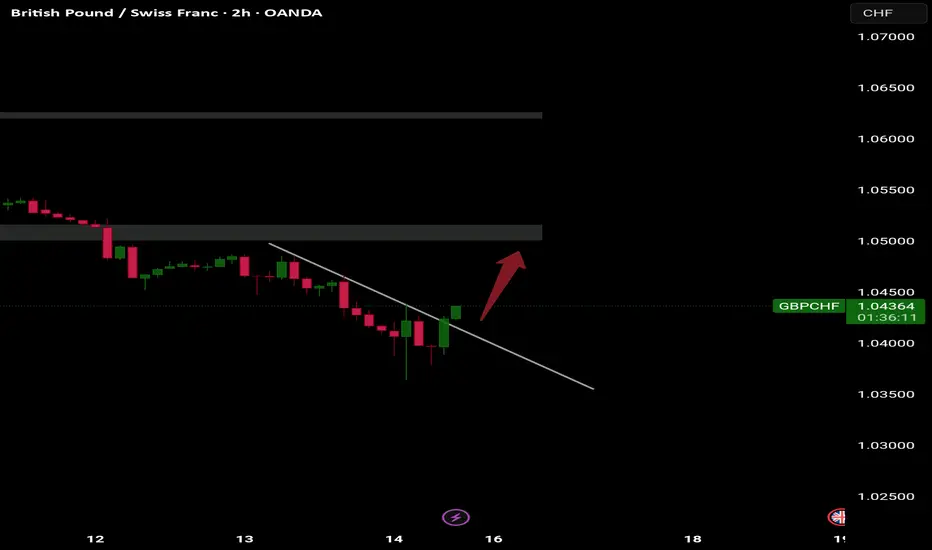
GBPCHF reversingGBPCHF has broken out of the channel and continuing to gain strength. Next week could be the rising week for this pair.
NZDCAD WILL KEEP GROWIING|LONG|
✅NZDCAD rebounded from a strong demand level, signaling possible continuation toward the liquidity pocket above 0.7980. A retracement into fair value gap could offer optimal entry. Time Frame 3H.
LONG🚀
✅Like and subscribe to never miss a new idea!✅

EUR-GBP Will Keep Growing! Buy!
Hello,Traders!
EURGBP is retesting a horizontal demand area, aligning with premium–discount dynamics. If the level holds, bullish delivery could target liquidity resting above 0.8850. Time Frame 4H.
Buy!
Comment and subscribe to help us grow!
Check out other forecasts below too!
Disclosure: I am part of Trade Nation's Influencer program and receive a monthly fee for using their TradingView charts in my analysis.

XAU/USD | Gold Faces Pullback After Breaking $4200, What’s Next?By analyzing the #Gold chart on the 4-hour timeframe, we can see that after breaking above the $4200 resistance, the price continued to rise and reached $4244 before reacting negatively from the OTE zone, correcting down to $4184.
Gold is currently trading around $4195, with an FVG zone between $4141–$4181 that might get filled soon. There’s also a key demand area between $4098–$4125 to watch closely.
If gold manages to hold above $4181 without breaking below, we could see another strong bullish move toward $4269. Monitor price reactions carefully at all mentioned levels!
Please support me with your likes and comments to motivate me to share more analysis with you and share your opinion about the possible trend of this chart with me !
Best Regards , Arman Shaban

FINAL TRADE OF THE WEEK: CADJPY Follow-Through ExecutionSetup Analysis:
CADJPY formed a Momentum Low yesterday, followed by a sustained pullback/sideways pattern that established our structural point. This consolidation created the perfect setup for a continuation entry.
Trade Execution:
Entry triggered this afternoon after the break of the internal wave structure, confirming Sellers conviction and follow-through.
Trade Management:
Strong momentum immediately after entry
Target 2 (T2) achieved in under 2 hours
Profit: +50 pips
Exit Decision:
Position closed at T2 after price displayed strong reversal signals. This is mechanical trading—take profits when price action shows the move is exhausted.
Key Lesson:
The best trades are the ones where:
✅ Structure is clear
✅ Entry confirms momentum
✅ Price moves decisively in your favour
✅ You exit with discipline when reversal patterns emerge
This is the WavesOfSuccess methodology in action—patience for setup, precision on entry, discipline on exit.
Result: +50 pips in under 2 hours ✅
Have a blessed weekend! 🙏
👍 Hit the boost button if you found this valuable
👤 Follow for more educational trading content

AUDNZD Rally Losing Steam – Watch This Reversal Zone!As we’ve seen, AUDNZD ( OANDA:AUDNZD ) recently began an upward move after forming a Falling Wedge Pattern , and it’s been in an Ascending Channel for about the past 16 days.
Currently, AUDNZD is moving into a Heavy Resistance zone(1.1662 NZD-1.1340 NZD) and a Potential Reversal Zone(PRZ) .
From an Elliott Wave perspective, it seems like AUDNZD is completing the microwave 5 of the main wave 3 . Once it breaks below the lower line of the ascending channel, we can somewhat confirm the end of the main wave 3.
Additionally, we can see a Negative Regular Divergence(RD-) forming between two consecutive peaks.
I expect that in the coming hours, AUDNZD might decline at least to the Support zone(1.1480 NZD-1.1444 NZD) . If it breaks that Support zone, we could see it dropping toward around 1.1353 NZD(Second Target) .
Stop Loss(SL): 1.16403 NZD
Please respect each other's ideas and express them politely if you agree or disagree.
Australian Dollar/New Zealand Dollar Analyze (AUDNZD), 4-hour time frame.
Be sure to follow the updated ideas.
Do not forget to put a Stop loss for your positions (For every position you want to open).
Please follow your strategy and updates; this is just my Idea, and I will gladly see your ideas in this post.
Please do not forget the ✅' like '✅ button 🙏😊 & Share it with your friends; thanks, and Trade safe.

GOLD On The Rise! BUY!
My dear friends,
Please, find my technical outlook for GOLD below:
The instrument tests an important psychological level 4125.1
Bias - Bullish
Technical Indicators: Supper Trend gives a precise Bullish signal, while Pivot Point HL predicts price changes and potential reversals in the market.
Target - 4139.79
Recommended Stop Loss - 4117.21
About Used Indicators:
Super-trend indicator is more useful in trending markets where there are clear uptrends and downtrends in price.
Disclosure: I am part of Trade Nation's Influencer program and receive a monthly fee for using their TradingView charts in my analysis.
———————————
WISH YOU ALL LUCK

EURUSD Set To Fall! SELL!
My dear subscribers,
EURUSD looks like it will make a good move, and here are the details:
The market is trading on 1.1629 pivot level.
Bias - Bearish
My Stop Loss - 1.1642
Technical Indicators: Both Super Trend & Pivot HL indicate a highly probable Bearish continuation.
Target - 1.1607
About Used Indicators:
The average true range (ATR) plays an important role in 'Supertrend' as the indicator uses ATR to calculate its value. The ATR indicator signals the degree of price volatility.
Disclosure: I am part of Trade Nation's Influencer program and receive a monthly fee for using their TradingView charts in my analysis.
———————————
WISH YOU ALL LUCK

CHFJPY 9-month Channel Up looking for a pull-back.The CHFJPY pair has been trading within a 9-month Channel Up with the current Bullish Leg approaching its Top (Higher Highs trend-line).
Given that with its +7.77% rise it has already marginally exceeded the maximum Bullish Leg extension within this pattern, we expect a technical pull-back (Bearish Leg) to start now given that the 1D RSI turned overbought (above 70.00).
Both previous Bearish Legs declined by -2.45%, testing the 1D MA50 (blue trend-line). As a result, our short-term Target here is 191.000.
---
** Please LIKE 👍, FOLLOW ✅, SHARE 🙌 and COMMENT ✍ if you enjoy this idea! Also share your ideas and charts in the comments section below! This is best way to keep it relevant, support us, keep the content here free and allow the idea to reach as many people as possible. **
---
💸💸💸💸💸💸
👇 👇 👇 👇 👇 👇

EURUSD: Expecting Bearish Continuation! Here is Why:
Balance of buyers and sellers on the EURUSD pair, that is best felt when all the timeframes are analyzed properly is shifting in favor of the sellers, therefore is it only natural that we go short on the pair.
Disclosure: I am part of Trade Nation's Influencer program and receive a monthly fee for using their TradingView charts in my analysis.
❤️ Please, support our work with like & comment! ❤️

GBPJPY: Long Trade with Entry/SL/TP
GBPJPY
- Classic bullish formation
- Our team expects pullback
SUGGESTED TRADE:
Swing Trade
Long GBPJPY
Entry - 202.77
Sl - 202.54
Tp - 203.28
Our Risk - 1%
Start protection of your profits from lower levels
Disclosure: I am part of Trade Nation's Influencer program and receive a monthly fee for using their TradingView charts in my analysis.
❤️ Please, support our work with like & comment! ❤️

EURJPY Sellers In Panic! BUY!
My dear subscribers,
This is my opinion on the EURJPY next move:
The instrument tests an important psychological level 179.30
Bias - Bullish
Technical Indicators: Supper Trend gives a precise Bullish signal, while Pivot Point HL predicts price changes and potential reversals in the market.
Target - 179.52
My Stop Loss - 179.18
About Used Indicators:
On the subsequent day, trading above the pivot point is thought to indicate ongoing bullish sentiment, while trading below the pivot point indicates bearish sentiment.
Disclosure: I am part of Trade Nation's Influencer program and receive a monthly fee for using their TradingView charts in my analysis.
———————————
WISH YOU ALL LUCK

EURUSD SELL NOW Script Name - EURUSD
Position - SELL SIDE
Time frame :
Monthly - Coming to support
Day - Descending Channel Forming and market in Top
1Hr - Breakout the Structure
Entry - 1.16136
Target - 1.14823
Stoploss - 1.16560
This view only for Eduactional Purpose
Happy Trading ...

Possible Cup and Handle for SilverSilver likes forming cups then breaking them, I saw them many times. A possible new one is forming but complete yet. I'm thinking about entering the trade early. It might decreases the chances of a winning trade but also increases the risk reward ratio and possible total loss. I did not decide how to proceed yet myself.

BITCOIN Will Go Higher From Support! Long!
Here is our detailed technical review for BITCOIN.
Time Frame: 2h
Current Trend: Bullish
Sentiment: Oversold (based on 7-period RSI)
Forecast: Bullish
The market is testing a major horizontal structure 96,949.13.
Taking into consideration the structure & trend analysis, I believe that the market will reach 100,800.47 level soon.
P.S
We determine oversold/overbought condition with RSI indicator.
When it drops below 30 - the market is considered to be oversold.
When it bounces above 70 - the market is considered to be overbought.
Like and subscribe and comment my ideas if you enjoy them!

EURUSD Will Go Up From Support! Buy!
Take a look at our analysis for EURUSD.
Time Frame: 9h
Current Trend: Bullish
Sentiment: Oversold (based on 7-period RSI)
Forecast: Bullish
The market is approaching a key horizontal level 1.161.
Considering the today's price action, probabilities will be high to see a movement to 1.168.
P.S
Overbought describes a period of time where there has been a significant and consistent upward move in price over a period of time without much pullback.
Like and subscribe and comment my ideas if you enjoy them!

EURAUD Will Go Lower! Short!
Please, check our technical outlook for EURAUD.
Time Frame: 2h
Current Trend: Bearish
Sentiment: Overbought (based on 7-period RSI)
Forecast: Bearish
The market is approaching a significant resistance area 1.781.
Due to the fact that we see a positive bearish reaction from the underlined area, I strongly believe that sellers will manage to push the price all the way down to 1.773 level.
P.S
Please, note that an oversold/overbought condition can last for a long time, and therefore being oversold/overbought doesn't mean a price rally will come soon, or at all.
Like and subscribe and comment my ideas if you enjoy them!

AUDNZD Will Go Up! Long!
Here is our detailed technical review for AUDNZD.
Time Frame: 1h
Current Trend: Bullish
Sentiment: Oversold (based on 7-period RSI)
Forecast: Bullish
The market is on a crucial zone of demand 1.149.
The oversold market condition in a combination with key structure gives us a relatively strong bullish signal with goal 1.154 level.
P.S
The term oversold refers to a condition where an asset has traded lower in price and has the potential for a price bounce.
Overbought refers to market scenarios where the instrument is traded considerably higher than its fair value. Overvaluation is caused by market sentiments when there is positive news.
Like and subscribe and comment my ideas if you enjoy them!

GBP/USD Set to Plunge: Rate Cut Pressure and Weak Data!Currently, the GBP/USD pair is under strong selling pressure following macroeconomic news from the UK. Weak GDP data of only 0.1% in Q3/2025 , along with the government's cancellation of the planned income tax hikes, has raised concerns about the financial stability of the UK economy. This has fueled expectations that the Bank of England (BoE) may be forced to cut interest rates soon, further pressuring the British Pound.
From a technical perspective, GBP/USD is still heavily influenced by the descending trendline. The pair has failed to break the strong resistance at 1.3200, indicating that the downward trend remains intact. The nearest support level is 1.3100, and if this is broken, 1.3020 will be the next target.
In conclusion, with the pressure from macroeconomic factors and technical signals, the likelihood of GBP/USD continuing its decline in the near future is very high. Traders may consider opening a SELL position when the price approaches the resistance zone.

EURUSD Trend ChangeMy EURUSD short attempt failed and EURUSD trend is now broken to the upside and Dollar trend broken to the downside. Unless it is a massive trap, it came with diffrent oppurtunities. Now, donward moves should become buying oppurtunities for EURUSD.

GBP/JPY Retesting Support Bullish Rebound PossibleOn the GBP/JPY 1-minute chart, the price is pulling back toward the support zone around 203.15. If this level holds and buyers step in, a strong bullish rebound could follow, pushing the pair back toward the recent highs. However, a break below this support may signal further downside. Watching for clear reaction and confirmation before entering any trades.
