EURGBP FREE SIGNAL|LONG|
✅EURGBP bullish displacement from a refined demand zone confirms market structure shift. Liquidity sweep completed with strong impulsive move, favoring continuation toward premium liquidity.
—————————
Entry: 0.8677
Stop Loss: 0.8653
Take Profit: 0.8696
Time Frame: 4H
—————————
LONG🚀
✅Like and subscribe to never miss a new idea!✅
Forex

GBPUSD (H1) – Structure OverviewPrice continues to respect a descending channel, indicating controlled bearish market structure. Recent upside movement appears corrective rather than impulsive.
Channel Respect: Price remains below the channel’s upper boundary, maintaining bearish pressure.
H1 Order Block Reaction: Current price is testing a prior H1 supply zone, aligning with channel resistance.
Market Context: Failure to accept above this zone keeps price within the broader downward structure.
Momentum: Lower highs within the channel suggest continuation of range-to-bearish behavior unless structure changes.
⚠️ Educational analysis only. No buy/sell recommendation. Always wait for confirmation and manage risk.

XAUUSD (Gold) – H1 Market Structure AnalysisContext: Liquidity → Structure Shift → Reaction Zones
Price previously respected a descending trendline. A clean breakout has occurred, followed by a pullback, indicating a potential change in market character.
🔍 Key Technical Observations
Trendline Breakout Confirmed
Price has broken above the descending trendline, suggesting bearish momentum is weakening.
Market Structure Shift (MSS)
A bullish displacement from the lows signals a possible short-term structural shift.
Liquidity Sweep Completed
Sell-side liquidity was taken below prior lows before the impulsive move upward, often seen before reversals.
Fair Value Gaps (H1 FVGs)
Upper FVG (Premium zone): Acts as resistance; reaction or rejection possible.
Lower FVG (Discount zone): Potential reaction area if price retraces.
Order Block Zone (H1 OB)
Below price, this zone represents a strong demand area where buyers previously stepped in.
🧠 Scenarios to Watch (No Predictions)
If price reacts from the upper FVG, short-term pullbacks toward imbalance zones are possible.
If price retests the lower FVG / OB and holds, continuation toward recent highs may develop.
Acceptance above the upper imbalance would indicate strength, while rejection signals range behavior.
⚠️ Notes
This idea is for educational and technical discussion purposes only.
Always wait for confirmation and manage risk according to your own plan.
No buy/sell instructions are provided.

Gold outlook: The short bullish trend is forming from the 4658 zGold outlook: The short bullish trend is forming from the 4658 zone and still continues towards 4967. There is a possibility that the market will continue this trend to gain till 5099. So there is a possible and profitable move, but keep in mind that the gold trend in H1 also be tested at 4939. if the market closes H1 with strong volume below the level of 4939, then we go for a sell position in gold; otherwise, trade gold with the trend. It's better suggestions that always trade with the trend. Always take a brief outlook on gold history and recent price behivour with Geopolitical events and war inflamtions in the world.

Overlap resistance ahead?USD/JPY is rising towards the resistance level, which is an overlap resistance that aligns with the 78.6% Fibonacci retracement and could reverse from this level to our take profit.
Entry: 157.76
Why we like it:
There is an overlap resistance that aligns with the 78.6% Fibonacci retracement.
Stop loss: 159.39
Why we like it:
There is a swing high resistance level.
Take profit: 156.32
Why we like it:
There is a pullback support level.
Enjoying your TradingView experience? Review us!
Please be advised that the information presented on TradingView is provided to Vantage (‘Vantage Global Limited’, ‘we’) by a third-party provider (‘Everest Fortune Group’). Please be reminded that you are solely responsible for the trading decisions on your account. There is a very high degree of risk involved in trading. Any information and/or content is intended entirely for research, educational and informational purposes only and does not constitute investment or consultation advice or investment strategy. The information is not tailored to the investment needs of any specific person and therefore does not involve a consideration of any of the investment objectives, financial situation or needs of any viewer that may receive it. Kindly also note that past performance is not a reliable indicator of future results. Actual results may differ materially from those anticipated in forward-looking or past performance statements. We assume no liability as to the accuracy or completeness of any of the information and/or content provided herein and the Company cannot be held responsible for any omission, mistake nor for any loss or damage including without limitation to any loss of profit which may arise from reliance on any information supplied by Everest Fortune Group.

Heading towards Fib levels?GBP/USD is rising towards the resistance level, which is a pullback resistance that aligns with the 61.8% and the 38.2% Fibonacci retracement and could reverse from this level to our take profit.
Entry: 1.3650
Why we like it:
There is a pullback resistance level that aligns with the 61.8% and the 38.2% Fibonacci retracement.
Stop loss: 1.3753
Why we like it:
There is a pullback resistance that is slightly above the 61.8% Fibonacci retracement.
Take profit: 1.3534
Why we like it:
There is an overlap support level.
Enjoying your TradingView experience? Review us!
Please be advised that the information presented on TradingView is provided to Vantage (‘Vantage Global Limited’, ‘we’) by a third-party provider (‘Everest Fortune Group’). Please be reminded that you are solely responsible for the trading decisions on your account. There is a very high degree of risk involved in trading. Any information and/or content is intended entirely for research, educational and informational purposes only and does not constitute investment or consultation advice or investment strategy. The information is not tailored to the investment needs of any specific person and therefore does not involve a consideration of any of the investment objectives, financial situation or needs of any viewer that may receive it. Kindly also note that past performance is not a reliable indicator of future results. Actual results may differ materially from those anticipated in forward-looking or past performance statements. We assume no liability as to the accuracy or completeness of any of the information and/or content provided herein and the Company cannot be held responsible for any omission, mistake nor for any loss or damage including without limitation to any loss of profit which may arise from reliance on any information supplied by Everest Fortune Group.

Could we se a bounce from here?EUR/USD is falling towards the support, which is a pullback support, and could bounce from this level to our take profit.
Entry: 1.1799
Why we like it:
There is a pullback support level.
Stop loss: 1.1756
Why we like it:
There is a pullback support level.
Take profit: 1.1860
Why we like it:
There is a pullback resistance level.
Enjoying your TradingView experience? Review us!
Please be advised that the information presented on TradingView is provided to Vantage (‘Vantage Global Limited’, ‘we’) by a third-party provider (‘Everest Fortune Group’). Please be reminded that you are solely responsible for the trading decisions on your account. There is a very high degree of risk involved in trading. Any information and/or content is intended entirely for research, educational and informational purposes only and does not constitute investment or consultation advice or investment strategy. The information is not tailored to the investment needs of any specific person and therefore does not involve a consideration of any of the investment objectives, financial situation or needs of any viewer that may receive it. Kindly also note that past performance is not a reliable indicator of future results. Actual results may differ materially from those anticipated in forward-looking or past performance statements. We assume no liability as to the accuracy or completeness of any of the information and/or content provided herein and the Company cannot be held responsible for any omission, mistake nor for any loss or damage including without limitation to any loss of profit which may arise from reliance on any information supplied by Everest Fortune Group.

Bullish momentum to extend?USDX is falling towards the support level, which is a pullback support that is slightly above the 38.2% Fibonacci retracement and could bounce from this level to our take profit.
Entry: 96.99
Why we like it:
There is a pullback support level that is slightly above the 38.2% Fibonacci retracement.
Stop loss: 96.31
Why we like it:
There is a pullback support level that aligns with the 61.8% Fibonacci retracement.
Take profit: 97.93
Why we like it:
There is a pullback resistance level that is slightly above the 61.8% Fibonacci retracement.
Enjoying your TradingView experience? Review us!
Please be advised that the information presented on TradingView is provided to Vantage (‘Vantage Global Limited’, ‘we’) by a third-party provider (‘Everest Fortune Group’). Please be reminded that you are solely responsible for the trading decisions on your account. There is a very high degree of risk involved in trading. Any information and/or content is intended entirely for research, educational and informational purposes only and does not constitute investment or consultation advice or investment strategy. The information is not tailored to the investment needs of any specific person and therefore does not involve a consideration of any of the investment objectives, financial situation or needs of any viewer that may receive it. Kindly also note that past performance is not a reliable indicator of future results. Actual results may differ materially from those anticipated in forward-looking or past performance statements. We assume no liability as to the accuracy or completeness of any of the information and/or content provided herein and the Company cannot be held responsible for any omission, mistake nor for any loss or damage including without limitation to any loss of profit which may arise from reliance on any information supplied by Everest Fortune Group.

kvmev / CADCHF long / 01/02/2026 - 07/02/2026Price closed above previous lows, retested support zone and is looking to continue up bullish.

US30: Market Sentiment & Forecast
The price of US30 will most likely collapse soon enough, due to the supply beginning to exceed demand which we can see by looking at the chart of the pair.
Disclosure: I am part of Trade Nation's Influencer program and receive a monthly fee for using their TradingView charts in my analysis.
❤️ Please, support our work with like & comment! ❤️

EURUSD: Bearish Continuation & Short Trade
EURUSD
- Classic bearish setup
- Our team expects bearish continuation
SUGGESTED TRADE:
Swing Trade
Short EURUSD
Entry Point - 1.1814
Stop Loss - 1.1822
Take Profit - 1.1799
Our Risk - 1%
Start protection of your profits from lower levels
Disclosure: I am part of Trade Nation's Influencer program and receive a monthly fee for using their TradingView charts in my analysis.
❤️ Please, support our work with like & comment! ❤️

TESLA: Market of Buyers
The charts are full of distraction, disturbance and are a graveyard of fear and greed which shall not cloud our judgement on the current state of affairs in the TESLA pair price action which suggests a high likelihood of a coming move up.
Disclosure: I am part of Trade Nation's Influencer program and receive a monthly fee for using their TradingView charts in my analysis.
❤️ Please, support our work with like & comment! ❤️

NATGAS: Long Trade Explained
NATGAS
- Classic bullish formation
- Our team expects growth
SUGGESTED TRADE:
Swing Trade
Buy NATGAS
Entry Level - 3.404
Sl - 3.347
Tp - 3.493
Our Risk - 1%
Start protection of your profits from lower levels
Disclosure: I am part of Trade Nation's Influencer program and receive a monthly fee for using their TradingView charts in my analysis.
❤️ Please, support our work with like & comment! ❤️

QQQ The Target Is UP! BUY!
My dear friends,
My technical analysis for QQQ is below:
The market is trading on 609.55 pivot level.
Bias - Bullish
Technical Indicators: Both Super Trend & Pivot HL indicate a highly probable Bullish continuation.
Target - 620.06
About Used Indicators:
A pivot point is a technical analysis indicator, or calculations, used to determine the overall trend of the market over different time frames.
Disclosure: I am part of Trade Nation's Influencer program and receive a monthly fee for using their TradingView charts in my analysis.
———————————
WISH YOU ALL LUCK

SILVER Trading Opportunity! SELL!
My dear followers,
I analysed this chart on SILVER and concluded the following:
The market is trading on 78.099 pivot level.
Bias - Bearish
Technical Indicators: Both Super Trend & Pivot HL indicate a highly probable Bearish continuation.
Target - 74.855
Safe Stop Loss - 80.157
About Used Indicators:
A super-trend indicator is plotted on either above or below the closing price to signal a buy or sell. The indicator changes color, based on whether or not you should be buying. If the super-trend indicator moves below the closing price, the indicator turns green, and it signals an entry point or points to buy.
Disclosure: I am part of Trade Nation's Influencer program and receive a monthly fee for using their TradingView charts in my analysis.
———————————
WISH YOU ALL LUCK

APPLE What Next? SELL!
My dear subscribers,
APPLE looks like it will make a good move, and here are the details:
The market is trading on 278.07 pivot level.
Bias - Bearish
Technical Indicators: Both Super Trend & Pivot HL indicate a highly probable Bearish continuation.
Target - 269.38
About Used Indicators:
The average true range (ATR) plays an important role in 'Supertrend' as the indicator uses ATR to calculate its value. The ATR indicator signals the degree of price volatility.
Disclosure: I am part of Trade Nation's Influencer program and receive a monthly fee for using their TradingView charts in my analysis.
———————————
WISH YOU ALL LUCK

US100 Sellers In Panic! BUY!
My dear friends,
US100 looks like it will make a good move, and here are the details:
The market is trading on 25010 pivot level.
Bias - Bullish
Technical Indicators: Supper Trend generates a clear long signal while Pivot Point HL is currently determining the overall Bullish trend of the market.
Goal - 25505
Recommended Stop Loss - 24728
About Used Indicators:
Pivot points are a great way to identify areas of support and resistance, but they work best when combined with other kinds of technical analysis
Disclosure: I am part of Trade Nation's Influencer program and receive a monthly fee for using their TradingView charts in my analysis.
———————————
WISH YOU ALL LUCK

USDCHFUSDCHF price is near the support zone of 0.77528-0.77352. If the price fails to break through 0.77352, a rebound is expected.
🔥Trading futures, forex, CFDs and stocks carries a risk of loss.
Please consider carefully whether such trading is suitable for you.
This content is not financial advice. Always conduct your own financial due diligence.
>>GooD Luck 😊
❤️ Like and subscribe to never miss a new idea!

EURUSD What Next? BUY!
My dear followers,
I analysed this chart on EURUSD and concluded the following:
The market is trading on 1.1791 pivot level.
Bias - Bullish
Technical Indicators: Both Super Trend & Pivot HL indicate a highly probable Bullish continuation.
Target - 1.1804
Safe Stop Loss - 1.1784
About Used Indicators:
A super-trend indicator is plotted on either above or below the closing price to signal a buy or sell. The indicator changes color, based on whether or not you should be buying. If the super-trend indicator moves below the closing price, the indicator turns green, and it signals an entry point or points to buy.
Disclosure: I am part of Trade Nation's Influencer program and receive a monthly fee for using their TradingView charts in my analysis.
———————————
WISH YOU ALL LUCK

EURNZD Massive Short! SELL!
My dear friends,
EURNZD looks like it will make a good move, and here are the details:
The market is trading on 1.9707 pivot level.
Bias - Bearish
Technical Indicators: Supper Trend generates a clear short signal while Pivot Point HL is currently determining the overall Bearish trend of the market.
Goal - 1.9616
About Used Indicators:
Pivot points are a great way to identify areas of support and resistance, but they work best when combined with other kinds of technical analysis
Disclosure: I am part of Trade Nation's Influencer program and receive a monthly fee for using their TradingView charts in my analysis.
———————————
WISH YOU ALL LUCK

USDJPY The Target Is DOWN! SELL!
My dear friends,
My technical analysis for USDJPY is below:
The market is trading on 157.11 pivot level.
Bias - Bearish
Technical Indicators: Both Super Trend & Pivot HL indicate a highly probable Bearish continuation.
Target - 156.87
Recommended Stop Loss - 157.26
About Used Indicators:
A pivot point is a technical analysis indicator, or calculations, used to determine the overall trend of the market over different time frames.
Disclosure: I am part of Trade Nation's Influencer program and receive a monthly fee for using their TradingView charts in my analysis.
———————————
WISH YOU ALL LUCK

XAU/USD ~ Gold Building Momentum from Key Support📝 Description 🔍 Setup OANDA:XAUUSD
✅Gold has been respecting a descending trendline with multiple rejections, showing clear bearish structure. Now price is attempting a breakout + retest while holding above a strong demand zone.
✅Buyers stepped in aggressively from support, forming higher lows and pushing price back toward the cloud resistance area.
✅Geopolitical tensions (Middle East concerns) continue to support safe-haven demand for gold — adding a fundamental tailwind.
📍 Support & Resistance
🟥 Support Zone: 4,760 – 4,650
🟥 Major Support: 4,570 – 4,400
🟩 1st Resistance: 5,310
🟩 2nd Resistance: 5,550
Volume profile shows strong acceptance near support — buyers defending the zone.
⚠️ Disclaimer
This analysis is for educational purposes only.
Trading involves risk. Always use proper risk management and your own strategy.
💬 Support the Idea👍 Like if you’re bullish on Gold
💬 Comment: Breakout rally or fakeout? 🔁 Share with fellow gold traders
#XAUUSD #Gold #Forex #PriceAction #TrendlineBreakout #SafeHaven #TradingView #SupportResistance #IntradayTrading #Kabhi_TATrading

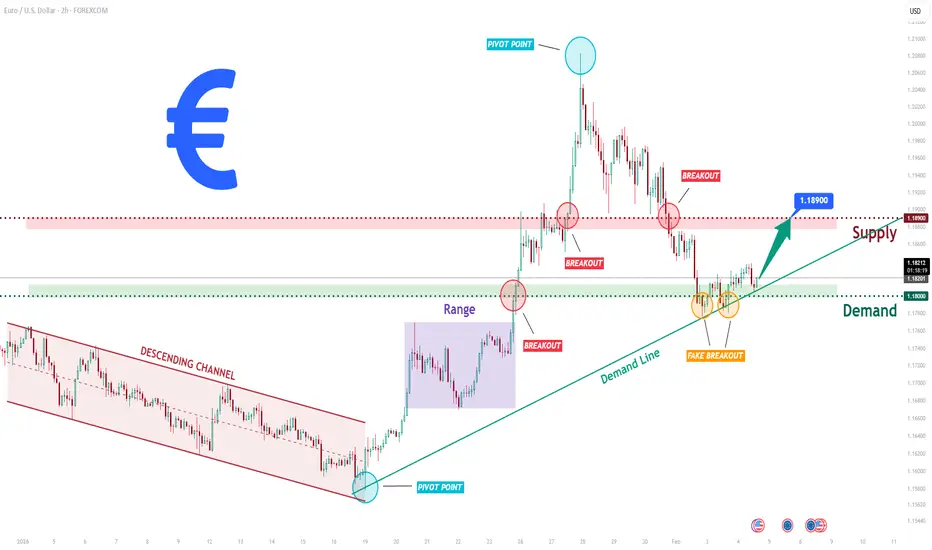
EURUSD Long: Demand Zone Holds - Bulls Preparing Next LegHello traders! Here’s a clear technical breakdown of EURUSD (2H) based on the current chart structure. EURUSD previously traded within a well-defined descending channel, where price consistently respected the descending resistance and support lines, forming a series of lower highs and lower lows. This structure confirmed sustained bearish pressure and orderly downside continuation. The bearish phase eventually reached a key pivot point, where selling momentum weakened and buyers began to step in. Following this pivot, price broke out of the descending channel and transitioned into a ranging phase, indicating temporary balance between buyers and sellers after the trend shift. This range acted as an accumulation zone before the next impulsive move. A clean bullish breakout above the range confirmed renewed buyer control and initiated a strong impulsive rally to the upside.
Currently, EURUSD is pulling back from supply and retesting the Demand Zone around 1.1800, which aligns closely with a rising demand trend line. A brief fake breakout below demand has already occurred, followed by a quick recovery back above the level — a strong sign that sellers failed to gain acceptance below support. This behavior suggests that the current pullback is corrective rather than a full trend reversal.
My primary scenario, as long as EURUSD holds above the 1.1800 Demand Zone and continues to respect the rising demand line, the bullish structure remains intact. A sustained reaction from this area could lead to a renewed upside move, targeting a retest of the 1.1890 Supply Zone (TP1). A clean breakout and acceptance above supply would confirm bullish continuation and open the door for further upside expansion. However, a decisive breakdown and acceptance below the demand zone and trend line would invalidate the bullish scenario and signal a deeper corrective phase. For now, structure, trend, and price behavior continue to favor buyers, with demand acting as the key battlefield. Manage your risk!