CHFJPY Will Collapse! SELL!
My dear subscribers,
My technical analysis for CHFJPY is below:
The price is coiling around a solid key level - 201.99
Bias - Bearish CHFJPY
Technical Indicators: Pivot Points High anticipates a potential price reversal.
Super trend shows a clear sell, giving a perfect indicators' convergence.
Goal - 201.09
About Used Indicators:
By the very nature of the supertrend indicator, it offers firm support and resistance levels for traders to enter and exit trades. Additionally, it also provides signals for setting stop losses
Disclosure: I am part of Trade Nation's Influencer program and receive a monthly fee for using their TradingView charts in my analysis.
———————————
WISH YOU ALL LUCK
Forex

NZD-USD Free Signal! Sell!
Hello,Traders!
NZDUSD
Price reacts from a well-defined horizontal supply zone after a corrective pullback. Bearish displacement and acceptance below supply suggest smart money distribution, favoring continuation toward lower liquidity.
--------------------
Stop Loss: 0.6011
Take Profit: 0.5968
Entry: 0.5994
Time Frame: 3H
--------------------
Sell!
Comment and subscribe to help us grow!
Check out other forecasts below too!
Disclosure: I am part of Trade Nation's Influencer program and receive a monthly fee for using their TradingView charts in my analysis.

EURJPY: Bullish Push to 186.40?As the previous analysis worked exactly as predicted, FX:EURJPY is eyeing a bullish continuation on the 4-hour chart , with price rebounding from the upward channel's lower boundary after lower high, converging with a potential entry zone at support that could fuel upside momentum if buyers hold amid recent volatility. This setup indicates a rally opportunity post-pullback, targeting higher resistance levels with near 1:4 risk-reward .🔥
Entry between 184.50–184.76 for a long position (entry from current price with proper risk management is recommended)🎯. Target at 186.40 . Set a stop loss at a daily close below 184.35 , yielding a risk-reward ratio of near 1:4 . Monitor for confirmation via a bullish candle close above entry with increasing volume, capitalizing on the pair's upward bias in the channel.🌟
Fundamentally , EURJPY is trading around 185.1 in early February 2026, with limited high-impact events this week, but key Japanese developments could influence JPY weakness. For the Yen, the Snap General Election on February 7 may lead to Monday's market gap, with outcomes impacting Nikkei and yen sentiment. Monday February 9 at 12:00 AM UTC features Eco Watchers Survey: Current (Jan, previous 48.6) and Outlook (Jan, previous 50.5), where weaker consumer sentiment could pressure JPY. For the Euro, no major releases this week, leaving the pair sensitive to JPY catalysts and broader USD flows. 💡
📝 Trade Setup
🎯 Entry (Long):
184.50 – 184.76
(Entry from current price is valid with proper risk & position sizing.)
🎯 Target:
• 186.40
❌ Stop Loss:
• Daily close below 184.35
⚖️ Risk-to-Reward:
• ~ 1:4
💡 Your take?
Does EURJPY extend toward 186.40 after this pullback, or do you expect more consolidation before the next leg higher? 👇

CAD/JPY | BSL sweep (READ THE CAPTION)After last week's massive NWOG and the dramatic fall of the CADJPY, it moved upwards and then faced a little bit of correction after this week's NWOG, it gone up to 114.91 and dropped a little bit, leaving a Liquidity Pool below and the went back up and is being traded at 114.81. I expect CADJPY to sweep the liquidity above the 114.91 and then wait to see if it goes down again or will go for the next liquidity pool above 115.43 to make a move.
Targets: 115.00, 115.10 and 115.20.
If it fails to sweep the liquidity and drops: 114.72, 114.62, 114.52 and 114.42.

USD/CAD | Stuck! (READ THE CAPTION)As you can see in the daily chart of USDCAD, after it hit the Bullish OB, it has been going higher and higher, and started today by going through the Volume Imbalance, but it eventually fell inside the Volume Imbalance zone again. I expect it to retest the Vol Imbalance as well as Feb 6th NDOG soon and I want it to go through it. Currently it's being traded at 1.3684 and It is stuck between the Feb 3rd NDOG and Feb 6th NDOG.
For now, here are the targets for USDCAD: 1.3688, 1.3694, 1.3700 and 1.3707.

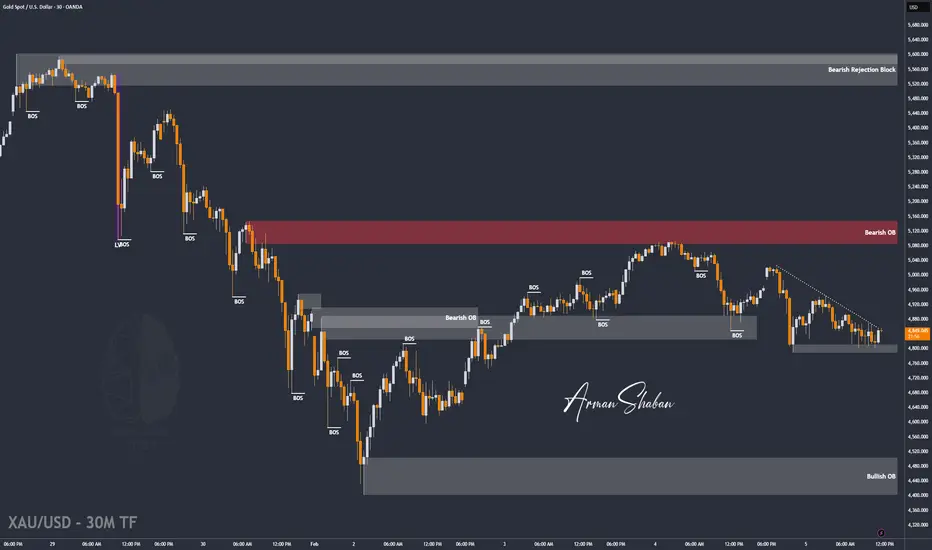
XAU/USD | Gold Short-Term Bounce After Liquidity Grab!By analyzing the #Gold chart on the 30-minute timeframe, we can see that after our previous analysis, price moved exactly as expected and first corrected down to $4,790. After reaching this key level and sweeping the liquidity below it, gold turned bullish again and is now trading around $4,850.
If price can stabilize above $4,839, we can expect further upside in gold. The next potential targets for this move are $4,876 and $4,913.
Please support me with your likes and comments to motivate me to share more analysis with you and share your opinion about the possible trend of this chart with me !
Best Regards , Arman Shaban
Bitsounis / EURAUD Short limitEURAUD has broken the upward trend in 1h.
and I am waiting for an entry in the fib level zone.

USDCHF - The Breakdown You Can’t Afford to IgnoreHello Traders! 👋
What are your thoughts on USDCHF?
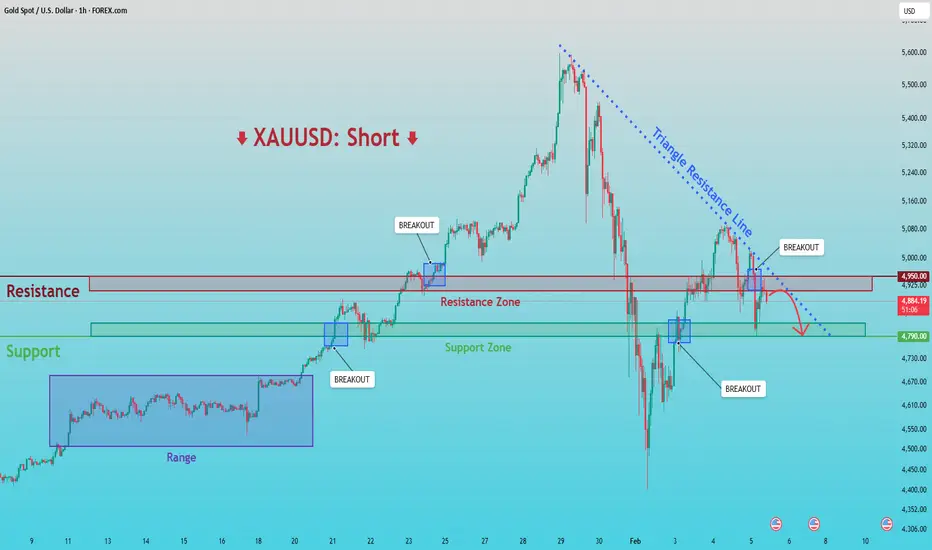
This chart shows a bearish technical analysis for the USD/CHF (US Dollar vs. Swiss Franc) currency pair on a daily timeframe.
The overall sentiment is that the pair has broken below long-term support and is now showing signs of further weakness.
Key Takeaways
Bearish Breakdown: The price has fallen significantly below a long-standing consolidation range (the blue support zone around 0.7850).
Role Reversal: The previous "Support" (blue zone) is now acting as "Resistance." The red arrow indicates a "retest" of this level—a common technical pattern where price returns to a broken level before continuing lower.
Descending Trend: The purple lines highlight a series of "Lower Highs," indicating a sustained downward trend over the past several months.
Don’t forget to like and share your thoughts in the comments! ❤️

AUDUSD Will Go Down! Short!
Take a look at our analysis for AUDUSD.
Time Frame: 4h
Current Trend: Bearish
Sentiment: Overbought (based on 7-period RSI)
Forecast: Bearish
The market is testing a major horizontal structure 0.697.
Taking into consideration the structure & trend analysis, I believe that the market will reach 0.689 level soon.
P.S
Please, note that an oversold/overbought condition can last for a long time, and therefore being oversold/overbought doesn't mean a price rally will come soon, or at all.
Like and subscribe and comment my ideas if you enjoy them!

NZDUSD Will Move Lower! Sell!
Please, check our technical outlook for NZDUSD.
Time Frame: 1h
Current Trend: Bearish
Sentiment: Overbought (based on 7-period RSI)
Forecast: Bearish
The market is approaching a key horizontal level 0.598.
Considering the today's price action, probabilities will be high to see a movement to 0.593.
P.S
The term oversold refers to a condition where an asset has traded lower in price and has the potential for a price bounce.
Overbought refers to market scenarios where the instrument is traded considerably higher than its fair value. Overvaluation is caused by market sentiments when there is positive news.
Like and subscribe and comment my ideas if you enjoy them!

NZDCAD: Bullish Forecast & Outlook
The charts are full of distraction, disturbance and are a graveyard of fear and greed which shall not cloud our judgement on the current state of affairs in the NZDCAD pair price action which suggests a high likelihood of a coming move down.
Disclosure: I am part of Trade Nation's Influencer program and receive a monthly fee for using their TradingView charts in my analysis.
❤️ Please, support our work with like & comment! ❤️

CADCHF: Bearish Continuation & Short Signal
CADCHF
- Classic bearish setup
- Our team expects bearish continuation
SUGGESTED TRADE:
Swing Trade
Short CADCHF
Entry Point - 0.5685
Stop Loss - 0.5689
Take Profit - 0.5677
Our Risk - 1%
Start protection of your profits from lower levels
Disclosure: I am part of Trade Nation's Influencer program and receive a monthly fee for using their TradingView charts in my analysis.
❤️ Please, support our work with like & comment! ❤️

GBPCHF Expected Growth! BUY!
My dear followers,
I analysed this chart on GBPCHF and concluded the following:
The market is trading on 1.0565 pivot level.
Bias - Bullish
Technical Indicators: Both Super Trend & Pivot HL indicate a highly probable Bullish continuation.
Target - 1.0602
About Used Indicators:
A super-trend indicator is plotted on either above or below the closing price to signal a buy or sell. The indicator changes color, based on whether or not you should be buying. If the super-trend indicator moves below the closing price, the indicator turns green, and it signals an entry point or points to buy.
Disclosure: I am part of Trade Nation's Influencer program and receive a monthly fee for using their TradingView charts in my analysis.
———————————
WISH YOU ALL LUCK

GBP/USD Declines After Bank of England DecisionGBP/USD Declines After Bank of England Decision
Yesterday’s decision by the Bank of England came as a surprise to forex traders. While the Official Bank Rate was left unchanged at 3.75%, markets were caught off guard by the notably dovish signals regarding future policy.
According to media reports, four out of nine Monetary Policy Committee members voted for an immediate rate cut. This has brought forward expectations of easing by the Bank of England, making the pound less attractive to hold and triggering its weakness yesterday.
Technical Analysis of GBP/USD
Price action in GBP/USD has been forming an upward trend (outlined by a channel) since November last year. However, yesterday’s move has put this channel at risk of a downside break.
It is worth noting that the market had only recently been in a very strong bullish phase. GBP/USD was advancing along the blue support line and even pushed above the upper boundary of the ascending channel.
Sentiment then shifted abruptly. Bears stepped in aggressively, driving the pair lower and breaking through several technical levels in sequence:
→ the blue trendline;
→ the upper boundary of the channel;
→ the channel median, reinforced by the 1.3640 level.
As a result, the price fell towards the lower boundary of the channel, strengthened by the 1.3530 level, which had acted as resistance in late December and early January.
Almost all of the bullish gains made in late January have now been erased. It cannot be ruled out that today’s rebound in GBP/USD is merely a technical recovery — a pause that allows bears to regroup before attempting a break below the lower boundary of the ascending channel, potentially steering the market into a downward trajectory (shown in red).
This article represents the opinion of the Companies operating under the FXOpen brand only. It is not to be construed as an offer, solicitation, or recommendation with respect to products and services provided by the Companies operating under the FXOpen brand, nor is it to be considered financial advice.

GOLD Buyers In Panic! SELL!
My dear subscribers,
GOLD looks like it will make a good move, and here are the details:
The market is trading on 4862.6 pivot level.
Bias - Bearish
My Stop Loss - 4893.5
Technical Indicators: Both Super Trend & Pivot HL indicate a highly probable Bearish continuation.
Target - 4806.5
About Used Indicators:
The average true range (ATR) plays an important role in 'Supertrend' as the indicator uses ATR to calculate its value. The ATR indicator signals the degree of price volatility.
Disclosure: I am part of Trade Nation's Influencer program and receive a monthly fee for using their TradingView charts in my analysis.
———————————
WISH YOU ALL LUCK

GBP/USD BULLS WILL DOMINATE THE MARKET|LONG
Hello, Friends!
GBP/USD pair is in the uptrend because previous week’s candle is green, while the price is clearly falling on the 4H timeframe. And after the retest of the support line below I believe we will see a move up towards the target above at 1.374 because the pair is oversold due to its proximity to the lower BB band and a bullish correction is likely.
Disclosure: I am part of Trade Nation's Influencer program and receive a monthly fee for using their TradingView charts in my analysis.
✅LIKE AND COMMENT MY IDEAS✅

AUD/CHF SENDS CLEAR BEARISH SIGNALS|SHORT
AUD/CHF SIGNAL
Trade Direction: short
Entry Level: 0.542
Target Level: 0.539
Stop Loss: 0.544
RISK PROFILE
Risk level: medium
Suggested risk: 1%
Timeframe: 1h
Disclosure: I am part of Trade Nation's Influencer program and receive a monthly fee for using their TradingView charts in my analysis.
✅LIKE AND COMMENT MY IDEAS✅

EURJPY: Bullish Trend Continuation 🇪🇺🇯🇵
EURJPY will like continue rising, following a confirmed breakout
of a resistance line of a bullish flag pattern.
Next goal is 185.8
❤️Please, support my work with like, thank you!❤️
I am part of Trade Nation's Influencer program and receive a monthly fee for using their TradingView charts in my analysis.


XAUUSD: Breakdown & Retest Signals Bearish ContinuationHello everyone, here is my breakdown of the current XAUUSD setup.
Market Analysis
XAUUSD previously traded within a well-defined consolidation range, where price moved sideways for an extended period, indicating balance between buyers and sellers and gradual liquidity accumulation. This range eventually resolved to the upside, triggering a clean bullish breakout and a strong impulsive rally. Following the breakout, gold expanded higher aggressively, confirming bullish intent and attracting momentum buyers. However, after reaching the upper highs near the peak of the move, bullish momentum began to fade, and price formed a clear swing top.
Currently, XAUUSD is trading below a key Resistance Zone around 4,950, which previously acted as support but has now flipped into resistance. Several breakouts above this zone failed, suggesting lack of acceptance and strong seller presence. At the same time, price recently broke below the descending triangle support and is attempting a weak pullback toward the broken structure — a classic bearish retest scenario.
My Scenario & Strategy
My primary scenario favors a short continuation, as long as price remains below the descending triangle resistance line and below the 4,950 Resistance Zone. The recent breakout attempts above resistance appear corrective and liquidity-driven rather than signs of a trend reversal. As long as these levels cap price, rallies are viewed as selling opportunities rather than bullish continuation signals. From a structural perspective, the market is transitioning from a bullish expansion phase into a broader corrective or distribution phase. The loss of higher highs and repeated rejections from resistance support the bearish case. The first downside objective lies near the 4,790 Support Zone, which represents a key demand area and a prior breakout level. This zone is expected to act as the first major target where buyers may attempt a reaction. If price reaches the support zone and shows strong rejection or consolidation, a temporary bounce is possible.
However, a clean breakdown and acceptance below 4,790 would confirm bearish continuation and open the door for a deeper move toward lower demand areas. The short bias remains valid as long as price stays below resistance and the descending structure remains intact. Any strong breakout and acceptance above the triangle resistance and the 4,950 zone would invalidate the short scenario and shift focus back to bullish continuation. Until then, structure favors sellers.
That’s the setup I’m tracking. Thank you for your attention, and always manage your risk.
EURUSD: Buyers Defend 1.1780 - Upside in Focus 1.1870Hello everyone, here is my breakdown of the current EURUSD setup.
Market Analysis
EURUSD was previously trading within a well-defined downward channel, where price consistently respected the descending resistance and support boundaries, forming a series of lower highs and lower lows. This structure confirmed sustained bearish control and orderly downside continuation. During this phase, several bearish pushes developed smoothly within the channel, highlighting strong seller dominance. After breaking the channel, EURUSD continued higher and successfully reclaimed the Support Zone around 1.1780, which acted as a key decision level. The breakout and subsequent hold above this zone confirmed a change from bearish structure into a bullish recovery phase. Price then accelerated toward the 1.1870 Resistance Zone, where supply became active again, resulting in consolidation and multiple breakout attempts.
Currently, price is trading above the rising trend line, while also forming a descending corrective structure beneath the triangle resistance line. Despite the pullback, the market continues to respect higher lows, suggesting that the recent decline is corrective rather than impulsively bearish. The ability of EURUSD to hold above the support zone keeps the bullish structure intact.
My Scenario & Strategy
My primary scenario favors a long continuation as long as EURUSD holds above the 1.1780 Support Zone and respects the rising trend line. The current consolidation appears to be a corrective pause within a broader bullish structure. A successful break and acceptance above the triangle resistance and the 1.1870 Resistance Zone would likely trigger renewed upside momentum. If buyers manage to reclaim and hold above resistance, the next bullish leg could extend higher, following the direction of the dominant trend.
However, a decisive breakdown below the support zone and trend line would weaken the bullish scenario and signal a potential deeper correction or range formation. For now, structure favors buyers, with pullbacks viewed as opportunities for continuation rather than trend reversal. EURUSD remains at a key technical decision area, and price reaction around support will be critical for the next move.
That’s the setup I’m tracking. Thank you for your attention, and always manage your risk.

Gold Holds Demand - Long Scenario After Correction Toward $5,180Hello traders! Here’s my technical outlook on XAUUSD (1H) based on the current chart structure. Gold initially traded within a well-defined range, indicating a period of accumulation and market balance. This consolidation eventually resolved to the upside, leading to a strong impulsive move and confirming bullish intent. Following the breakout, price respected a clean ascending channel, forming higher highs and higher lows. Multiple bullish breakouts along the structure confirmed sustained buyer control. However, after reaching the Resistance / Seller Zone around 5,180–5,200, bullish momentum weakened, and price faced strong rejection, resulting in a sharp corrective drop. This pullback drove price into a major Buyer Zone around 4,880–4,925, which aligns with a key horizontal support level and a previous breakout area. Price briefly dipped below this zone but quickly reclaimed it, forming a fake breakdown — a strong sign of seller exhaustion and buyer defense at demand. Currently, XAUUSD is stabilizing above the Buyer Zone, suggesting the correction may be complete. As long as price holds above this demand area, the structure favors a long scenario on pullbacks rather than continuation to the downside. A healthy retracement and consolidation within or just above the Buyer Zone could provide a favorable long opportunity. Bullish confirmation from this area increases the probability of a continuation move toward the 5,180 Resistance / Seller Zone (TP1). This level represents the first major upside target and an area where partial profits can be considered. If bullish momentum strengthens and price breaks above the Seller Zone with acceptance, the move could extend further toward higher resistance levels, confirming trend continuation. The long scenario remains valid as long as price holds above the Buyer Zone and avoids acceptance below support. A decisive breakdown and acceptance below the Buyer Zone would invalidate the long bias and shift focus back toward bearish continuation. Until that happens, Gold remains positioned for a bullish recovery from demand within the broader market structure. Please share this idea with your friends and click Boost 🚀

GBPUSD Range Fakeout → Bearish Breakdown Toward DemandGBPUSD on the 30m timeframe shows a clean shift from an ascending channel into a range, followed by a strong bearish breakdown. Price rejected the range highs, formed a distribution zone, and then broke structure to the downside, creating a descending channel.
After the breakdown, price pulled back into the supply trendline near 1.3588, giving a classic retest opportunity. The reaction from this supply area suggests continuation toward the marked demand zone around 1.3507.
This setup highlights:
• Range fakeout and market structure shift
• Bearish channel formation after breakdown
• Supply trendline retest entry
• Targeting demand liquidity below
As long as price holds below the supply line, bearish momentum remains valid toward the demand area.
Risk Management:
