EURUSD Massive Short! SELL!
My dear friends,
Please, find my technical outlook for EURUSD below:
The instrument tests an important psychological level 1.1863
Bias - Bearish
Technical Indicators: Supper Trend gives a precise Bearish signal, while Pivot Point HL predicts price changes and potential reversals in the market.
Target - 1.1834
About Used Indicators:
Super-trend indicator is more useful in trending markets where there are clear uptrends and downtrends in price.
Disclosure: I am part of Trade Nation's Influencer program and receive a monthly fee for using their TradingView charts in my analysis.
———————————
WISH YOU ALL LUCK
Forex

NZD/USD | FVG retest (READ THE CAPTION) As you can see in the hourly chart of NZDUSD we can see that it has touched the FVG Low several times but has failed to stay inside the gap and has dropped out of it each time. I expect it to retest the FVG again, and the targets are: 0.6061, 0.6068 and 0.6075.
If it fails to go inside the gap, the targets are: 0.6050, 0.6044 and 0.6039.

EUR/USD | Consolidation over? (READ THE CAPTION)By analyzing the 15m chart of EURUSD we can see that it has been consolidating in the same range in the past 2 days, Currently being traded at 1.1915, barely above the NDOG High. If EURUSD manages to hold itself above the NDOG, the targets are: 1.1922, 1.1929, 1.1936 and 1.1943.
If it fails to hold itself above the NDOG Midpoint (1.19135), the targets will be: 1.1908, 1.1900 and 1.1892.

GBPCHF Under Pressure! SELL!
My dear friends,
My technical analysis for GBPCHF is below:
The market is trading on 1.0518 pivot level.
Bias - Bearish
Technical Indicators: Both Super Trend & Pivot HL indicate a highly probable Bearish continuation.
Target - 1.0495
Recommended Stop Loss - 1.0530
About Used Indicators:
A pivot point is a technical analysis indicator, or calculations, used to determine the overall trend of the market over different time frames.
Disclosure: I am part of Trade Nation's Influencer program and receive a monthly fee for using their TradingView charts in my analysis.
———————————
WISH YOU ALL LUCK


XAUUSD Range Accumulation → Potential Upside BreakGold (XAUUSD) is currently trading inside a structured accumulation range on the 1H timeframe. Price has been respecting a strong support base around the 4,980–5,020 zone while forming higher lows, indicating steady buying interest and controlled consolidation.
The chart highlights repeated bounce patterns from support, suggesting institutional demand and liquidity collection before a potential continuation move. Price is now testing the upper range near 5,100–5,150, where resistance has previously rejected bullish attempts.
A sustained hold above the range support keeps the bullish structure intact, while a clean break and hold above the upper resistance area could open room toward higher target zones near 5,145 and 5,188. As long as price remains inside this structure, expect consolidation with breakout potential.
This analysis is for educational and informational purposes only and reflects technical structure, not financial advice. Always manage risk and confirm with your own strategy before making trading decisions.

GBPNZD Is Very Bearish! Sell!
Here is our detailed technical review for GBPNZD.
Time Frame: 1h
Current Trend: Bearish
Sentiment: Overbought (based on 7-period RSI)
Forecast: Bearish
The market is approaching a significant resistance area 2.258.
Due to the fact that we see a positive bearish reaction from the underlined area, I strongly believe that sellers will manage to push the price all the way down to 2.251 level.
P.S
Please, note that an oversold/overbought condition can last for a long time, and therefore being oversold/overbought doesn't mean a price rally will come soon, or at all.
Like and subscribe and comment my ideas if you enjoy them!

Potential 600Pips on EURAUDWait for price to rally into the 1.7780 – 1.7805 region.
Confirmation:
A structural shift, confirmed by a break and close below 1.7690.
Possible Entries
Entry 1
Sell Limit @ 1.7885
Stop Loss @ 1.7838
Entry 2
Sell Limit @ 1.7870
Stop Loss: Refined on entry
Target Levels
T1: 1.7484
T2: 1.7330
T3: 1.7180
This move can be anticipated to develop between 19:00 UTC, 17th December 2025 and 02:00 UTC, 26th January 2026.
This setup offers a projected risk-to-reward of approximately 1:11 when executed from refined entries.
Trade Safe.
Patience is the Way!
Ieios

EUR/CHF BEARS WILL DOMINATE THE MARKET|SHORT
EUR/CHF SIGNAL
Trade Direction: short
Entry Level: 0.913
Target Level: 0.910
Stop Loss: 0.914
RISK PROFILE
Risk level: medium
Suggested risk: 1%
Timeframe: 1h
Disclosure: I am part of Trade Nation's Influencer program and receive a monthly fee for using their TradingView charts in my analysis.
✅LIKE AND COMMENT MY IDEAS✅

Gold Is Compressing at Range High — Breakout or Bull Trap?On the H1 chart, Gold is clearly trading inside a defined sideway range, with price now hovering near the upper boundary (Resistance Zone ~5,080 area).
📊 Market Structure
- After the sharp recovery from the previous sell-off, price transitioned into range equilibrium.
- The EMA cluster (short & mid-term) is flattening and slightly rising → indicating balance, not expansion.
- Higher lows inside the range show mild internal bullish pressure.
- However, price is still capped below clear resistance → no confirmed breakout yet.
🧠 What This Means
This is classic range compression near resistance.
Two scenarios:
Bullish Case
Clean H1 close above resistance
Followed by acceptance + shallow pullback → Expansion toward new highs.
Bearish Case
Rejection wicks + bearish engulfing near resistance → Rotation back to mid-range or even support zone (~4,980–5,000).
🎯 Trading Logic
In a sideway market:
Buy near support.
Sell near resistance.
Or wait for confirmed breakout with structure shift.
Right now, price is at premium inside the range → risk-reward favors patience over chasing longs.
Short conclusion:
Gold is not trending,it is deciding.
The breakout must prove itself.
⚠️ Disclaimer
This analysis is for educational purposes only and not financial advice. Markets involve risk and conditions can change at any time. Always manage risk properly and trade what you see, not what you hope.

EURUSD Scalping/Day TradingEURUSD is consolidating. Can do some profits scalping and Day Trading and also at the break of SUPPORT looking to go SHORT.

Bullish Reversal Structure Toward 5,340 Resistance Market Structure Overview
The 1-hour chart shows gold recovering after a sharp selloff, forming a rounded bottom structure followed by higher lows — a sign of short-term bullish momentum building.
We can break the chart into three phases:
Left Side – Distribution & Breakdown
Price rejected the 5,300–5,340 resistance zone.
A sharp selloff followed, breaking structure and accelerating to the downside.
Capitulation low formed near 4,400 (marked with red circle).
Middle – Accumulation & Base Formation
Rounded bottom structure developed.
Price began forming higher lows.
Buyers defended the 4,950–5,000 support zone multiple times.
Right Side – Compression Under Mid-Range Resistance
Price is consolidating above 5,000 support.
Higher lows suggest accumulation.
Currently pressing against 5,100–5,105 minor resistance.
📌 Key Levels
Major Resistance Zone:
🔵 5,276 – 5,340
This is the primary supply area and projected upside target.
Mid Resistance:
🔵 Around 5,104
Short-term breakout level.
Major Support Zone:
🔴 5,000 – 4,996
Key demand area and potential long entry zone.
📈 Trade Idea Illustrated on Chart
Bias: Bullish
Entry: Near 5,000 support (on pullback)
Target: 5,276 → 5,340 resistance zone
Invalidation: Clean breakdown below 4,990
The projected move suggests a continuation of higher lows leading to a breakout toward the upper supply zone.
🧠 Technical Signals Supporting Bullish Case
Rounded bottom formation
Higher low structure
Strong reaction from demand zone
Consolidation under resistance (bullish compression)
Prior major resistance now acting as magnet
⚠️ Risk Scenario
If price breaks and holds below 4,990:
Structure shifts bearish
Likely retest of 4,900–4,800 zone
Bullish thesis invalidated
🎯 Summary
Gold on the 1H timeframe is showing signs of short-term bullish continuation after a strong recovery from lows. As long as price holds above the 5,000 support zone, the probability favors a move toward the 5,276–5,340 resistance region.
If momentum increases, a breakout above 5,104 could accelerate the move toward target.

#EURUSD , Again? 📊 Morning Market Brief | London Session Prep
🔎 Instrument Focus: #EURUSD
⚠️ Risk Environment: High
📈 Technical Overview:
Maybe it be a adding on Position setup .... Not a Quality setup but lets have it in our watchlist.
—
#GOLD is still VALID
—-
🚀 Trading Plan:
• Need to check Momentum at POI
• LTF ENTRY NEEDED ‼️
• Just and Only for QuickScalp
🧠 Stay updated with real time news and macro events, visit 👉 @News_Ash_TheTrader_Bot
#Ash_TheTrader #Forex #EURUSD #MarketInsight #PriceAction #TradingPlan #RiskManagement #LondonSession #Scalping #Futures #NQ #Gold

Silver Is Compressing Below Supply — Breakout or RejectionSilver has staged a strong recovery from the support area, forming a sequence of higher lows along the rising trendline. This confirms that buyers are active and defending pullbacks, keeping the short-term structure constructive.
However, price is now compressing directly beneath a well-defined supply zone, where previous upside attempts were capped. The recent candles show overlapping ranges and reduced momentum, suggesting absorption and indecision, not a clean breakout yet. This is typical behavior when the market is deciding between continuation and rejection.
As long as price holds above the rising trendline and the support area, the bullish structure remains intact. A confirmed breakout and acceptance above the supply zone would open the door toward the higher supply premium area (goal). Failure to break, on the other hand, could trigger a pullback toward trendline support before the next attempt.
Bullish continuation: Clean break + hold above supply → expansion toward the marked goal.
Corrective pullback: Rejection at supply → retrace toward trendline / support area, structure remains bullish if higher lows hold.
Mindset: Let price prove the breakout. Compression at supply is a decision point, not a signal by itself.

GBP-CAD Bearish Breakout! Sell!
Hello,Traders!
GBPCAD breaks below a key supply base with strong displacement. Bearish BOS confirms distribution, exposing sell-side liquidity toward lower imbalance zones. Time Frame 4H.
Sell!
Comment and subscribe to help us grow!
Check out other forecasts below too!
Disclosure: I am part of Trade Nation's Influencer program and receive a monthly fee for using their TradingView charts in my analysis.

GBPCAD: Bullish Continuation is Highly Probable! Here is Why:
It is essential that we apply multitimeframe technical analysis and there is no better example of why that is the case than the current GBPCAD chart which, if analyzed properly, clearly points in the upward direction.
Disclosure: I am part of Trade Nation's Influencer program and receive a monthly fee for using their TradingView charts in my analysis.
❤️ Please, support our work with like & comment! ❤️

GBPNZD: Bullish Continuation & Long Trade
GBPNZD
- Classic bullish formation
- Our team expects pullback
SUGGESTED TRADE:
Swing Trade
Long GBPNZD
Entry - 2.2589
Sl - 2.2572
Tp - 2.2619
Our Risk - 1%
Start protection of your profits from lower levels
Disclosure: I am part of Trade Nation's Influencer program and receive a monthly fee for using their TradingView charts in my analysis.
❤️ Please, support our work with like & comment! ❤️

EURCAD On The Rise! BUY!
My dear subscribers,
My technical analysis for EURCAD is below:
The price is coiling around a solid key level - 1.6114
Bias - Bullish
Technical Indicators: Pivot Points Low anticipates a potential price reversal.
Super trend shows a clear buy, giving a perfect indicators' convergence.
Goal - 1.6139
About Used Indicators:
By the very nature of the supertrend indicator, it offers firm support and resistance levels for traders to enter and exit trades. Additionally, it also provides signals for setting stop losses
Disclosure: I am part of Trade Nation's Influencer program and receive a monthly fee for using their TradingView charts in my analysis.
———————————
WISH YOU ALL LUCK

GBPUSD Trading Opportunity! BUY!
My dear subscribers,
GBPUSD looks like it will make a good move, and here are the details:
The market is trading on 1.3653 pivot level.
Bias - Bullish
My Stop Loss - 1.3639
Technical Indicators: Both Super Trend & Pivot HL indicate a highly probable Bullish continuation.
Target - 1.3678
About Used Indicators:
The average true range (ATR) plays an important role in 'Supertrend' as the indicator uses ATR to calculate its value. The ATR indicator signals the degree of price volatility.
Disclosure: I am part of Trade Nation's Influencer program and receive a monthly fee for using their TradingView charts in my analysis.
———————————
WISH YOU ALL LUCK

GJ Delivers Valid Breakout After False OneThis week has been nothing but Consolidation for OANDA:GBPJPY but today we finally get a Valid Breakout of the Falling Wedge!
A Falling Wedge consists of price trading between Lower Highs and Lower Lows and can be considered a Continuation or Reversal pattern dependent upon at what level the pattern is forming.
Monday, Bulls attempted to make a Breakout of the Falling Resistance but turned false once price fell right back down into the pattern and tested it as Resistance again and succeeded!
This morning, price has delivered what seems to be a Valid Bearish Breakout of the Falling Support but price seems to be exhausted which means we could be looking for a Retest of the Breakout.
If the Retest of the Breakout is successful, this could generate Short Opportunities to take price further down!
Fundamentally, we see strength come in for JPY with the Prime Minister Sanae Takaichi's election victory.
"Analysts also noted that Takaichi’s policy, which includes tax cuts and more fiscal spending, is expected to boost the economy and lift the stock market, potentially prompting the Bank of Japan to take a more hawkish stance, all factors that could support the yen."
- tradingview.com/news/reuters.com,2026:newsml_L6N3Z60OK:0-yen-extends-gains-after-takaichi-election-victory-us-data-in-focus/

XAUUSDHello Traders! 👋
What are your thoughts on GOLD?
After a strong bearish rejection from the previous high, Gold entered a deep corrective phase and declined into the highlighted demand zone, where strong bullish reaction and buyer participation were observed.
Subsequently, price formed a higher low, signaling the development of a bullish structure, and is currently trading above the ascending trendline.
At the moment, price is testing a key resistance area .
As long as Gold holds above the rising trendline and the identified support zone, the overall outlook remains bullish, and price has the potential to advance at least toward the marked upside target.
Currently, price has entered a trading range, and it is now trading near the upper boundary of this range. From here, two main scenarios are in focus:
Scenario 1: A confirmed breakout above the range high could trigger a continuation toward the specified upside target.
Scenario 2: Price may correct toward the range support area, and from there, buyers could step in again and push price higher.
Therefore, waiting for confirmation is essential before entering any position, while proper risk management remains key.
Don’t forget to like and share your thoughts in the comments! ❤️

EJ Bears Look To Expand Further DownOANDA:EURJPY has formed what looks to be an Expanding Range!
An Expanding Range consists of price trading between Higher Highs and Lower Lows and can deliver either a Bullish or Bearish Breakout.
Currently price is trading at the Falling Support and with combined tells from RSI, MACD and Volume, Bears could be looking to make a break for lower prices!
Fundamentally, we see strength come in for JPY with the Prime Minister Sanae Takaichi's election victory.
"Analysts also noted that Takaichi’s policy, which includes tax cuts and more fiscal spending, is expected to boost the economy and lift the stock market, potentially prompting the Bank of Japan to take a more hawkish stance, all factors that could support the yen."
- www.tradingview.com

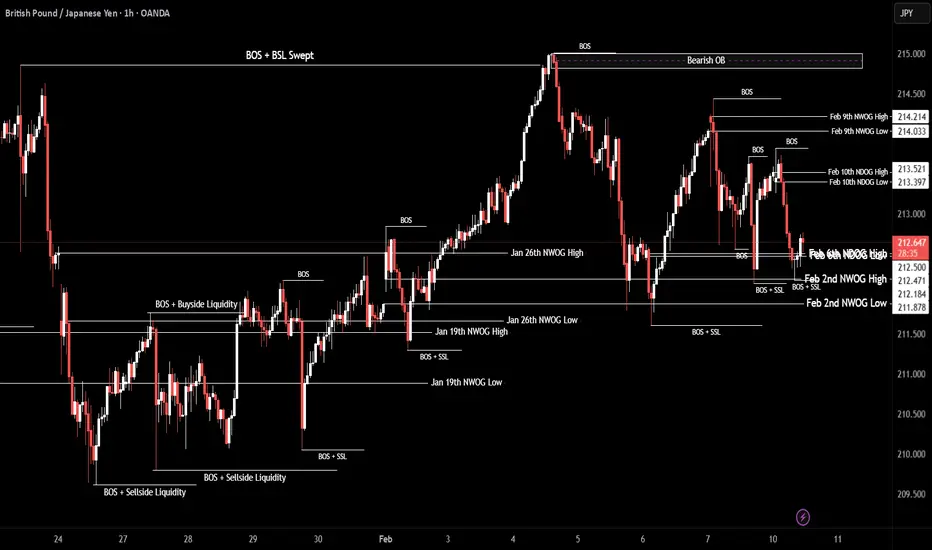
GBP/JPY | Up and down (READ THE CAPTION)By analyzing the hourly chart of GBPJPY, we can see that after yesterday's drop, it didn't go lower than the 212.13 to sweep the liquidity below and by hitting the Feb 2nd NWOG High, it bounced back up and it is being traded at 212.66.
If it holds up above the Feb 6th NDOG, I believe it can go up to 213.00.
Targets for GBPJPY: 212.75, 212.85 and 212.95.
If it fails: 212.50, 212.40, 212.30 and 212.20.