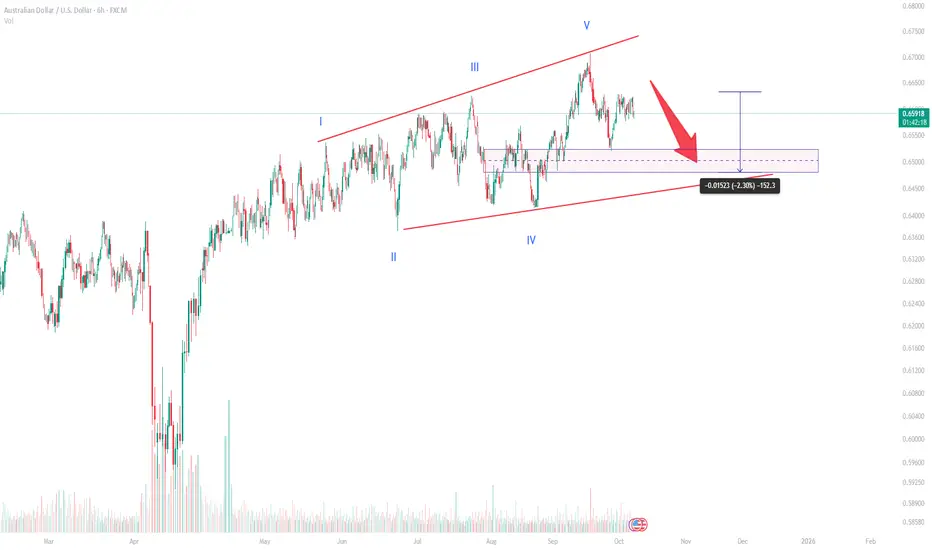
Rising Diagonal Pattern Near CompletionAUD/USD Elliott Wave Analysis – Rising Diagonal Pattern Near Completion
Overview
The AUD/USD pair has formed a clear ending diagonal pattern, signaling potential exhaustion of the current bullish trend. This structure, often seen at the final stage of an impulse wave, suggests that a corrective phase may soon follow. The diagonal appears complete with all five internal waves labeled (I-V), indicating that the market might be preparing for a deeper pullback.
Technical Analysis
According to the Elliott Wave structure visible on the 6-hour chart, AUD/USD completed its fifth and final wave near the 0.67 region. The wedge pattern is now narrowing, with bearish divergence hinting at weakening bullish momentum.
Wave Structure:
Wave I started the diagonal formation, initiating the rising trend.
Waves II and IV acted as corrections, forming higher lows.
Wave V extended slightly but failed to make a strong breakout, suggesting exhaustion.
The price currently trades near 0.6560, with a potential retracement zone between 0.6450 and 0.6500. This range coincides with a strong demand zone and the lower boundary of the diagonal pattern. A pullback into this area could complete the corrective (A)-(B)-(C) structure before the next major directional move.
Key Levels
Support Zone: 0.6450 – 0.6500
Immediate Resistance: 0.6650 – 0.6680
Breakout Confirmation: A sustained break below 0.6450 could confirm the end of the diagonal and open the door toward 0.63 in the medium term.
Invalidation: A breakout above 0.67 would invalidate the bearish correction scenario.
Market Outlook
The diagonal’s completion suggests that the pair may enter a short-term correction phase. However, traders should monitor price action near the support area before confirming the next trend direction. If buyers defend the 0.6450 zone, a rebound toward 0.6650 is likely. Conversely, a clear break below the wedge would strengthen bearish momentum.
Given the overall wave count, the market is likely in transition between an impulsive and a corrective phase. Patience is crucial at this stage, as the next few sessions will determine whether the larger uptrend resumes or a deeper retracement unfolds.
Forexanalysis
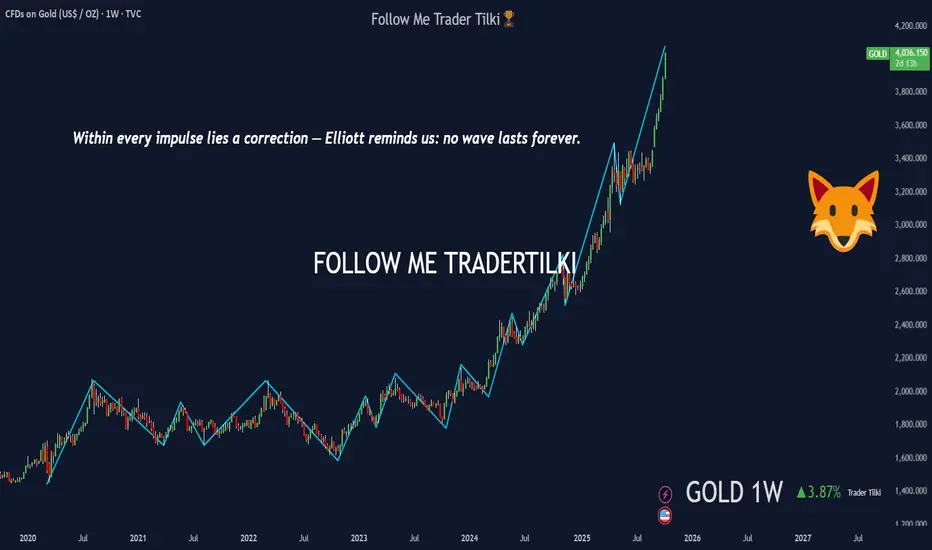
Impulse and Correction — XAUUSD-GOLD InformationElliott Wave Perspective on Gold
Gold is now testing the $4,000 level, marking one of its historic highs. On a yearly basis, the metal has been in a strong uptrend for a long time. But Elliott Wave Theory reminds us: no impulse lasts forever — every rally hides a correction.
At some point, this climb will lose steam and give way to a pullback. The real question is when — and that timing is known only by the market movers. Elliott’s structure shows us probabilities, not certainties.
👉 Consider this purely educational and informational. One day we will see sharp drops in gold, because just as every relentless rally comes with a relentless fall, gold is no exception.
💬 My friends, every single like from you is my biggest motivation to keep sharing these analyses. Thank you to all who support me with your likes.
GBPUSD Bearish Trade Setup @4h Decider (Mandatory)
Trend Bearish
Divergence None
Continuation Pattern Bearish Flag
Reversal Pattern
Harmonics AB=CD
Bias Bearish
Scenario Sell Stop at B point Breakout
Trade Plan
Stop Loss 1.35325
Entry Level 1.165
TP 1.3106

EURAUD Long Trade SetupTrend: Bearish
Divergence: Bullish
Continuation Pattern: None
Reversal Pattern: AB=CD
Harmonics : AB=CD
Bulls/Bears Score
Bias: Bullish
Scenario: Buy Stop at LH Breakout
Trade Plan
Stop Loss: 1.7612
Entry Level: 1.76765
TP: 1.7741

AUD/USD 4HR Trendline Breakout Long Setup. Daily Continuation.I will be entering a long trade at the close of the current daily candle on AUD/USD.
Stoploss and take profit provided. With this one management will be if the market does not trade through the target area by daily candle close on Thursday then I will close the trade manually.
Simple trading execution and plan.

EURUSD Bullish Trade SetupTrend: Bearish
Divergence Bullish: None
Reversal Pattern: Falling Wedge
Bias: Bullish
Scenario: Buy Stop at wedge breakout
Trade Plan
Stop Loss : 1.15925
Entry Level: 1.165
TP: 1.1708

EURAUD Bearish Trade SetupTrend: Bearish
Divergence: None
Continuation Pattern: Bearish Flag
Reversal Pattern: None
Harmonics : AB=CD
Bulls/Bears Score
Bias: Bearish
Scenario: Short Sell at B point Breakout
Trade Plan
Stop Loss: 1.77425
Entry Level: 1.7648
TP: 1.7553

USDCAD Bullish Trade IdeaTrend: Bullish
Divergence: None
Continuation Pattern: Bullish Rectangle
Reversal Pattern: None
Bias:Bullish
Scenario:Buy at Rnage Breakout
Trade Plan
Stop Loss 1.392
Entry Level 1.4001
TP1 1.4070

Trend Line Breakout 4HR. Daily Candle Continuation.Simple breakout pattern on the 4HR timeframe.
For this trade idea I will be holding till the end of new york session trading hours expecting movement to the downside.
Simple Trading Idea.
XAUUSDHello Traders! 👋
What are your thoughts on GOLD?
Gold continues its strong uptrend, printing new highs, but price action now shows signs of overbought conditions.
It appears that the bullish rally may pause for a short-term correction before resuming its upward momentum.
In this zone, we expect gold to form a new short-term high near the upper boundary of the ascending channel, followed by a pullback toward the highlighted support areas.
The overall long-term trend remains bullish — it’s better to avoid selling and instead look for buying opportunities during corrective moves.
What do you think — will gold continue its rally after this correction?
Don’t forget to like and share your thoughts in the comments! ❤️

Symmetrical Flag Pattern GBP/AUD Long SetupA beautiful flag pattern has formed on GBP/AUD. I am currently in a long position with the expectation of upside movement.
USDJPY Long Trade IdeaTrend:Bearish
Divergence: Bullish
Reversal Pattern: Double Bottom
Bias: Bullish
Scenario: Buy Stop at LH Breakout
Trade Plan
Stop Loss: 146.5
Entry Level: 147.65
TP1 148.8

NZDCHF Short Trade IdeaTrend: Bullish
Divergence: Bearish
Reversal Pattern: Head N Shoulder
Bias: Bearish
Scenario:Sell Stop at Neckline Breakout
Trade Plan
Stop Loss : 0.4649
Entry Leve: 0.4631
TP1: 0.4613

EURCAD Short Trade SetupTrend: Bullish
Divergence: Bearish
Continuation Pattern: None
Reversal Pattern: Falling Wedge
Bias: Bearish
Scenario: Buy Stop at LH and Wedge Break out
Trade Plan
Stop Loss : 1.6396
Entry Level: 1.6321
TP1: 1.6246

AUDNZD Short Treade IdeaDecider (Mandatory)
Trend: Bullish
Divergence: Bearish
Reversal Pattern: Head N Shoulder
Bias: Bearish
Scenario: Sell Stop at neck line breakout
Trade Plan
Stop Loss 1.1391
Entry Level 1.135
TP1 1.131

EURCAD Bearish SetupTrend: Bullish
Divergence: Bearish
Continuation Pattern: None
Reversal Pattern: Double Top
Bias: Bearish
Scenario: Sell Stop at neck line breakout
Trade Plan
Stop Loss : 1.638
Entry Level: 1.6295
TP1: 1.621

NZDCHF Long Trade SetupTrend: Bearish
Divergence: Bullish
Continuation Pattern: None
Reversal Pattern: Falling Wedge
Bias: Bullish
Scenario: Buy Stop at LH and Wedge Break out
Trade Plan
Stop Loss:0.4596
Entry Level: 0.4643
TP1: 0.469

GBPUSD Short Trade Plan – PRZ in Sight!Today I want to review a short setup on the GBPUSD ( FX:GBPUSD ) pair .
GBPUSD is currently near the Resistance zone($1.360-$1.351) and Support lines .
The question is, can GBPUSD break the Support lines!?
GBPUSD started to decline with a lot of momentum over the past week and this is a good sign for a break of the support lines .
According to Elliott Wave theory , GBPUSD appears to be completing microwave 4 , and given the bearish momentum , we can expect microwave 5 to break the support lines .
I expect GBPUSD to fall at least to the Potential Reversal Zone(PRZ) .
Stop Loss(SL): 1.3600 USD
Please respect each other's ideas and express them politely if you agree or disagree.
British Pound / U.S Dollar Analysis (GBPUSD), 4-hour time frame.
Be sure to follow the updated ideas.
Do not forget to put a Stop loss for your positions (For every position you want to open).
Please follow your strategy and updates; this is just my Idea, and I will gladly see your ideas in this post.
Please do not forget the ✅' like '✅ button 🙏😊 & Share it with your friends; thanks, and Trade safe.

NZDCHF Long Trade SetupTrend: Bearish
Divergence: Bullish
Continuation Pattern: None
Reversal Pattern: Falling Wedge
Bias: Bullish
Scenario: Buy Stop at Wedge breakout
Trade Plan
Stop Loss 0.46315
Entry Level 0.4652
TP1 0.4672

EURGBP Short Trade SetupTrend: Bullish
Divergence: Bearish
Continuation Pattern: None
Reversal Pattern: Rising Wedge
Bias: Bearish
Scenario: Sell Stop at LH Breakout
Trade Plan
Stop Loss: 0.87475
Entry Level: 0.8715
TP1: 0.8683

EURCHF Long SetupTrend Bearish
Divergence Bullish
Continuation Pattern No
Reversal Pattern Double Bottom
Bias Bullish
Scenario Entry at LH Breakout
Trade Plan
Stop Loss 0.9309
Entry Level 0.9359
TP1 0.9409

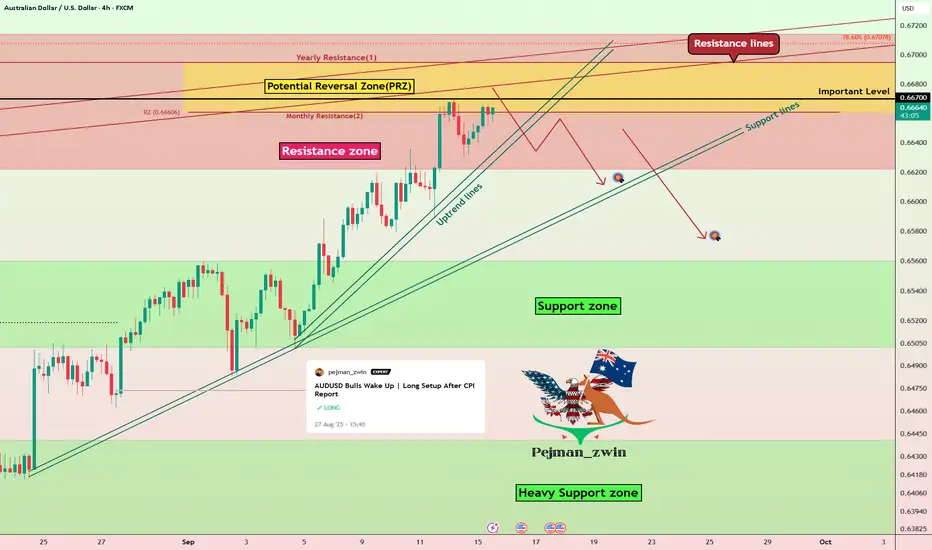
Short Setup on AUDUSD | Key Level at $0.667 TestedToday I want to share with you a Short position on the AUDUSD ( OANDA:AUDUSD ) pair. In the previous idea on AUDUSD, I managed to find the first part of this uptrend rally .
AUDUSD is currently trading in the Resistance zone($0.6714-$0.6622) and Potential Reversal Zone(PRZ) and near the Resistance lines .
Also, one of the reasons why I took this Short position on the AUDUSD pair is that the AUDUSD is approaching $0.667 , which is an important number in previous rallies (in terms of trading volume ) on the daily and weekly time frames.
I expect AUDUSD NOT to break the $0.667 level without a correction (at least), so a drop to $0.6614(First Target) is at least possible .
Second Target: $0.6580
Stop Loss(SL): $0.6723
Please respect each other's ideas and express them politely if you agree or disagree.
Australian Dollar/U.S.Dollar Analyze (AUDUSD), 4-hour time frame.
Be sure to follow the updated ideas.
Do not forget to put a Stop loss for your positions (For every position you want to open).
Please follow your strategy and updates; this is just my Idea, and I will gladly see your ideas in this post.
Please do not forget the ✅' like '✅ button 🙏😊 & Share it with your friends; thanks, and Trade safe.
AUDUSD Short SetupTrend: Bearish
Divergence: Bearish
Continuation Pattern: No
Bias: Bearish
Scenario: Head N Shoulder Pattern, SL at Shoulder 2 (LH)
Trade Plan
Stop Loss 0.66837
Entry Level 0.66299
TP1 0.65765
