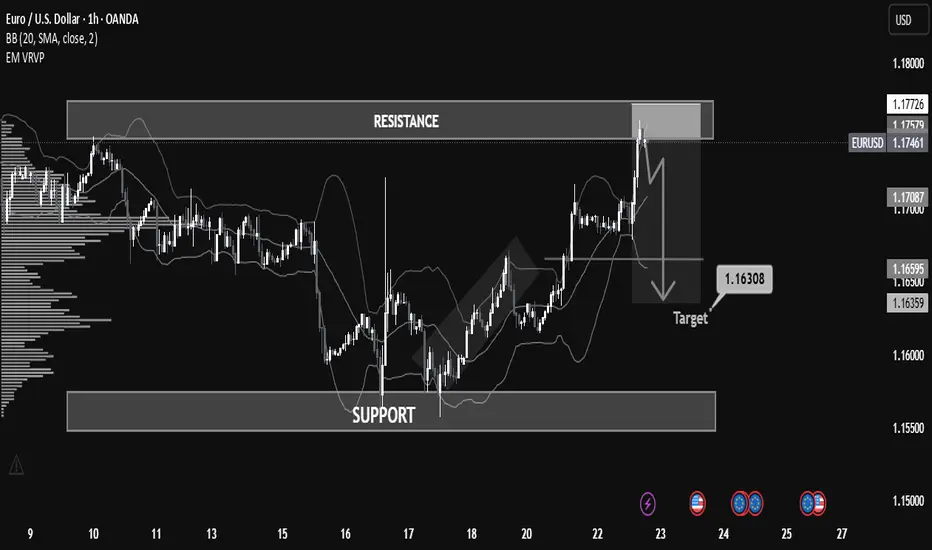
xauusd1st of all very very happy new year to all of you and specially to those who been profitable on 2025, and big congrets to those who loss and still dont give up, because if you give up you will never be their where you want to be, trading takes a time and patient.
i look at gold and consider if its a breakout or not.// so waiting for aconfirmation and some risk on pullback. my 1st trade will be on monday. i have draw a some line which may help to understand easy in my opinion. let me know what you think about a gold is still bullish or it will fall a bit more before go more higher.
Forexmentor

Market ShiftingHow Global Financial Markets Are Entering a New Phase of Transformation
Financial markets across the world are undergoing a profound shift. The forces that once defined market behavior—cheap liquidity, synchronized global growth, predictable central bank support, and deep globalization—are no longer dominant. Instead, markets are being reshaped by structural changes in geopolitics, technology, monetary policy, demographics, and investor behavior. This “market shifting” phase is not a temporary correction or a short-term cycle; it represents a transition into a new market regime where volatility, selectivity, and adaptability matter more than ever.
At its core, market shifting refers to the reallocation of capital, changes in leadership among asset classes and sectors, evolving risk-return dynamics, and altered relationships between traditional financial indicators. Understanding this shift is essential for investors, traders, policymakers, and businesses alike, as strategies that worked in the past decade may fail in the decade ahead.
From Easy Money to Tight Financial Conditions
One of the most important drivers of today’s market shift is the global move away from ultra-loose monetary policy. For more than a decade after the 2008 financial crisis, central banks flooded markets with liquidity through near-zero interest rates and quantitative easing. This environment inflated asset prices, reduced volatility, and encouraged risk-taking across equities, bonds, real estate, and alternative assets.
That era has now ended. Persistent inflation forced central banks such as the U.S. Federal Reserve, European Central Bank, and others to raise interest rates aggressively. Higher rates increase the cost of capital, compress valuations, and shift investor preference from speculative growth assets to cash-flow-generating and defensive investments. As a result, markets are recalibrating what assets are truly worth in a world where money is no longer free.
Shifting Asset Class Leadership
Another defining feature of the current market shift is the rotation in asset class leadership. During the previous cycle, equities—especially technology and growth stocks—consistently outperformed. Bonds served as reliable hedges, and correlations between asset classes were relatively stable.
Today, those relationships are changing. Bonds are no longer guaranteed safe havens during inflationary periods, commodities have regained importance as inflation hedges, and currencies are becoming active trading instruments rather than background variables. Gold, energy, industrial metals, and even agricultural commodities have taken center stage as investors seek protection against inflation, supply shocks, and geopolitical risk.
This shift means diversification strategies must be rethought. Traditional 60/40 portfolios are under pressure, pushing investors to explore alternatives such as commodities, infrastructure, private credit, and tactical trading strategies.
Geopolitics and Fragmentation of Global Markets
Geopolitical tensions are accelerating the market shift. The U.S.–China rivalry, regional conflicts, trade wars, sanctions, and the reshoring of supply chains are fragmenting global markets. Instead of one integrated global financial system, the world is moving toward regional blocs with distinct rules, risks, and capital flows.
This fragmentation impacts markets in multiple ways. Supply chain disruptions increase costs and inflation volatility. Trade restrictions alter corporate earnings and sector leadership. Capital controls and sanctions affect currency stability and cross-border investments. For markets, geopolitical risk is no longer a tail risk—it is a core pricing factor.
Technology, Automation, and Market Structure Changes
Technology is also reshaping how markets function. Algorithmic trading, artificial intelligence, high-frequency strategies, and retail participation through digital platforms have altered market microstructure. Price movements can be faster, sharper, and sometimes disconnected from fundamentals in the short term.
At the same time, technology-driven sectors are themselves undergoing a shift. Investors are now distinguishing between profitable, scalable tech businesses and those reliant on cheap funding. Innovation remains powerful, but valuation discipline has returned. This change reflects a broader market shift toward quality, earnings visibility, and balance sheet strength.
Behavioral Shifts Among Investors
Investor psychology is changing as well. The “buy the dip” mentality that dominated during central-bank-supported markets is no longer universally effective. Increased volatility, sudden drawdowns, and macro-driven price swings have made market participants more cautious.
Retail investors are more active but also more selective. Institutional investors are shortening time horizons, using derivatives for hedging, and actively managing risk rather than relying on passive exposure alone. This behavioral shift reinforces market volatility and creates frequent rotations between risk-on and risk-off environments.
Emerging Markets and Capital Flow Realignment
Market shifting is also visible in emerging markets. Higher global interest rates have reversed capital flows that once favored emerging economies. Stronger reserve currencies, especially the U.S. dollar, have pressured emerging market currencies, debt, and equities.
However, this shift is uneven. Countries with strong fundamentals, manageable debt, domestic growth drivers, and stable policy frameworks are attracting selective investment. Others face capital outflows and market stress. This divergence highlights how the new market environment rewards differentiation rather than broad-based exposure.
Implications for Traders and Long-Term Investors
The ongoing market shift demands a new approach to strategy and risk management. For traders, volatility creates opportunity, but it also increases the importance of discipline, position sizing, and macro awareness. Technical analysis must be combined with macro context, as news events and policy signals can override chart patterns.
For long-term investors, patience and selectivity are crucial. Instead of chasing momentum, focus is shifting toward valuation, earnings resilience, dividends, and real assets. Flexibility—across asset classes, geographies, and styles—is becoming a competitive advantage.
Conclusion: Adapting to the New Market Reality
Market shifting is not a crisis; it is a transition. Financial markets are adjusting to a world defined by higher interest rates, geopolitical complexity, technological disruption, and changing investor behavior. While this environment is more volatile and uncertain, it also offers opportunities for those who understand the new rules.
Success in this phase depends on adaptability, risk awareness, and a willingness to move beyond outdated assumptions. Markets are no longer driven by a single narrative or policy backstop. Instead, they reflect a complex interplay of economics, politics, and psychology. Recognizing and respecting this shift is the first step toward navigating the markets of today—and thriving in the markets of tomorrow.

A Strategic Approach to Profiting from Market InformationNews Trading Without Noise
In modern financial markets, news travels faster than ever. Economic data releases, central bank statements, corporate earnings, geopolitical developments, and even social media posts can move prices within seconds. While news creates opportunities, it also creates noise—misleading signals, emotional reactions, rumors, and short-term volatility that can trap unprepared traders. News trading without noise is the disciplined practice of extracting high-quality, actionable information from news while filtering out distractions, overreactions, and irrelevant data. This approach allows traders to participate in major market moves with clarity, confidence, and consistency.
Understanding the Difference Between News and Noise
Not all news is equal. Markets react strongly only to information that changes expectations. Noise, on the other hand, consists of repetitive commentary, speculative opinions, exaggerated headlines, and minor developments that do not materially alter fundamentals. For example, a central bank interest rate decision that deviates from expectations is meaningful news, while repeated media debates about possible outcomes before the announcement are often noise. Successful news traders focus on what is new, unexpected, and impactful, rather than what is loud or popular.
Noise is dangerous because it triggers emotional trading—fear of missing out (FOMO), panic selling, or impulsive entries. News trading without noise requires emotional detachment and a rules-based mindset, where decisions are driven by predefined criteria rather than instant reactions.
Focusing on High-Impact News Events
A noise-free news trading strategy begins with selectivity. Traders should focus only on high-impact, scheduled, and well-defined events such as:
Central bank interest rate decisions and policy statements
Inflation data (CPI, PPI), employment reports, and GDP figures
Corporate earnings from market leaders
Major geopolitical events that affect global risk sentiment
Low-impact data releases and speculative breaking news should be ignored unless they directly affect market expectations. By limiting attention to a small set of powerful events, traders reduce cognitive overload and improve decision quality.
Trading Expectations, Not Headlines
Markets move based on the gap between expectations and reality. A positive news headline does not always lead to rising prices if the market had already priced in better outcomes. News trading without noise means understanding consensus forecasts, market positioning, and sentiment before the event.
For instance, if inflation data comes in high but slightly below expectations, markets may rally despite inflation remaining elevated. Traders who focus only on the headline number may misinterpret the move, while those who analyze expectations understand the true driver. This expectation-based approach helps traders align with institutional flows rather than fighting them.
Using Price Action as the Final Filter
Price action is the most reliable filter against noise. Before acting on news, traders should observe how the market reacts in the first few minutes or hours. Strong, sustained moves with high volume often indicate genuine institutional participation, while sharp spikes followed by quick reversals usually signal noise-driven volatility.
News trading without noise does not mean reacting instantly. Instead, it means waiting for confirmation. Breakouts above key resistance levels, breakdowns below support, or continuation patterns after news provide clearer, lower-risk entry points. Letting price validate the news helps traders avoid false signals.
Timeframe Alignment and Patience
Many traders lose money by trading news on timeframes that do not match the event’s significance. Short-term scalping during major news releases is extremely risky due to slippage and whipsaws. Noise-free news traders often prefer higher timeframes—15-minute, 1-hour, or even daily charts—where the true impact of news becomes clearer.
Patience is critical. Not every news event needs to be traded immediately. Sometimes the best opportunity emerges hours or days later, once the market digests the information and establishes a clear trend.
Risk Management Over Prediction
A core principle of news trading without noise is accepting uncertainty. News outcomes are unpredictable, and even correct analysis can result in losses due to unexpected market reactions. Therefore, risk management is more important than prediction.
Traders should use predefined stop-loss levels, conservative position sizing, and avoid overexposure during high-volatility periods. Protecting capital ensures longevity and reduces emotional pressure, making it easier to stay disciplined and ignore noise.
Avoiding Media and Social Media Traps
Financial media and social platforms often amplify noise. Sensational headlines, conflicting expert opinions, and real-time commentary can distort perception and push traders into impulsive decisions. Noise-free traders limit exposure to such inputs, relying instead on primary data sources, official releases, and their own analysis frameworks.
Developing a personal trading plan and sticking to it is the best defense against external influence. When traders know exactly what they are looking for, irrelevant information naturally fades into the background.
Building a Structured News Trading Framework
To trade news without noise, traders should create a structured framework that includes:
A predefined list of tradable news events
Clear rules for pre-news preparation and post-news execution
Specific technical levels for confirmation
Strict risk management guidelines
This structure transforms news trading from reactive gambling into a professional, repeatable process.
Conclusion
News trading without noise is not about being the fastest or reacting to every headline. It is about clarity, selectivity, and discipline. By focusing on high-impact information, understanding expectations, waiting for price confirmation, and managing risk carefully, traders can turn news from a source of confusion into a powerful trading edge. In an age of information overload, the ability to filter noise is not just an advantage—it is a necessity for consistent success in financial markets.

Emerging Market vs Developed Market1. Definitions
Developed Markets
Developed markets are countries with high economic maturity, advanced financial systems, strong institutions, and stable political environments. Their characteristics include high GDP per capita, industrial sophistication, deep capital markets, and steady (though slower) economic growth. Examples include USA, UK, Canada, Japan, Germany, France, Australia, and Singapore.
Emerging Markets
Emerging markets are economies transitioning from developing to developed status. They show rapid industrialization, expanding middle-class populations, improving institutions, and increasing integration with global markets. Examples include India, China, Brazil, Indonesia, South Africa, Mexico, Turkey, and Vietnam.
2. Key Characteristics
2.1 Economic Growth
Emerging Markets:
Faster GDP growth, driven by urbanization, industrial expansion, rising consumption, digital adoption, and favorable demographics. Annual growth often ranges from 4–7%.
Developed Markets:
Slower but stable growth, typically 1–3%, due to market maturity, ageing demographics, and saturated industries.
Implication: EMs offer growth potential; DMs offer stability.
2.2 Income Levels and Living Standards
Developed Markets:
High income, advanced infrastructure, strong social welfare systems, high productivity.
Emerging Markets:
Lower but rapidly rising incomes, infrastructure still developing, large segments transitioning to formal economy.
2.3 Financial Markets and Institutions
Developed Markets:
Deep, liquid, and highly regulated financial markets. Stock exchanges (e.g., NYSE, NASDAQ, LSE) exhibit high transparency and strong corporate governance.
Emerging Markets:
Growing markets but with lower liquidity, higher volatility, and varying investor protections. Institutional reforms are ongoing.
2.4 Currency Stability
Developed Markets:
Stable currencies, low inflation, credible central banks.
Emerging Markets:
More prone to currency fluctuations, inflation spikes, and external shocks due to reliance on imported commodities and foreign capital.
2.5 Political and Regulatory Environment
Developed Markets:
Predictable policies, rule of law, strong regulatory systems.
Emerging Markets:
More political uncertainty, policy shifts, regulatory inconsistencies. However, some EMs like India are rapidly improving regulatory transparency.
2.6 Demographics
Emerging Markets:
Young, expanding populations — a positive for long-term consumption and labor supply.
Developed Markets:
Ageing populations — leading to higher healthcare spending, slower consumption growth, and labor shortages.
3. Opportunities in Emerging vs Developed Markets
3.1 Investment Opportunities
Emerging Markets
Higher returns due to rapid growth.
Sectors like technology, fintech, manufacturing, renewable energy, and infrastructure show exceptional potential.
Underpenetrated markets allow companies to grow at scale.
Developed Markets
Stable and predictable returns.
Strong corporate governance and reduced risk of fraud or systemic failures.
Advanced industries like AI, biotechnology, cloud computing, clean tech, and high-end manufacturing.
3.2 Consumer Market Potential
EMs have massive, growing middle classes. Consumption is expected to double in many EMs in the next two decades.
DMs have saturated markets, with growth reliant on innovation rather than new customers.
3.3 Capital Flows
Investors often chase high growth in EM equities, debt, and startups.
DMs attract long-term, stable institutional capital due to reliability of returns.
4. Risks in Emerging vs Developed Markets
4.1 Market Volatility
Higher in EMs, due to currency risks, political events, commodity dependence, and lower liquidity.
DMs show lower volatility thanks to robust financial systems.
4.2 Geopolitical and Policy Risks
EMs often face elections, reforms, or geopolitical pressures that can shift markets abruptly.
DMs are more predictable, although events like Brexit or US political gridlocks still create uncertainty.
4.3 Currency and Inflation Risks
EM currencies can depreciate sharply in global stress periods.
DMs maintain low inflation and strong central bank credibility.
4.4 Structural Challenges
EMs face challenges like corruption, weak judiciary, infrastructure gaps, and bureaucratic hurdles.
DMs deal with challenges like high public debt, low productivity growth, and ageing populations.
5. Comparative Overview
5.1 Growth vs Stability
Emerging markets = growth, opportunity, volatility
Developed markets = stability, safety, lower returns
5.2 Innovation and Technology Adoption
DMs lead in innovation due to research ecosystems.
EMs leapfrog technology — e.g., India’s digital payments boom, China’s e-commerce leadership.
5.3 Trade and Globalization
EMs are increasingly integrated into global supply chains.
DMs dominate global trade policies, IMF, World Bank, and monetary influence (USD, Euro, Yen).
5.4 Corporate Structures
DMs have multinationals with global footprints.
EMs are producing new giants (e.g., Reliance, Tata, Alibaba, BYD, Samsung).
6. Examples
Emerging Markets
India: Fastest-growing major economy, tech innovation, digital transformation.
China: Manufacturing hub, consumption growth.
Brazil: Natural resources, agriculture economy.
Indonesia & Vietnam: Manufacturing and consumption boom.
Developed Markets
USA: World’s largest and most innovative economy.
Japan: High-tech industries, strong institutions.
Germany: Industrial powerhouse.
UK & Canada: Stable financial systems.
7. Which Is Better for Investors?
Emerging Markets Are Ideal If You Want:
High long-term growth potential
Exposure to rising consumption
High-return equity opportunities
Portfolio diversification
Developed Markets Are Ideal If You Want:
Safety and predictability
Lower volatility
Strong governance
Blue-chip stability
Best Strategy:
A balanced portfolio that mixes both — e.g., EM for growth + DM for stability — provides optimal long-term results.
8. Conclusion
Emerging and developed markets represent two ends of the global economic spectrum. Emerging markets offer high growth, rising consumer demand, innovation, and long-term opportunities, but with higher risks and volatility. Developed markets deliver stability, security, and robust institutions, though with slower growth.
Understanding the differences helps investors, businesses, and policymakers choose the right strategies. In today’s interconnected world, both market types are essential components of global economic progress. A combination of the dynamism of emerging markets and the reliability of developed markets provides a balanced and powerful approach to global investment and economic engagement.
Invest Globally for Great Growth1. Why Invest Globally?
1. Diversification Beyond Local Risks
Every country faces its own economic cycles, policy changes, political uncertainties, and currency fluctuations. By investing globally, you spread your capital across different markets, reducing the risk that any one economy’s downturn will harm your overall portfolio. For example, if India or the US slows down, growth in Europe, Southeast Asia, or Latin America may balance the impact.
2. Access to Innovation Worldwide
No single country leads in every industry.
The US dominates technology and biotech.
Europe is strong in automation, renewable energy, and luxury goods.
China excels in manufacturing, EVs, and AI hardware.
Emerging markets lead in digital payments, mobile users, and consumption-led growth.
Global investing allows you to “own the best of the world.”
3. Capture Growth in Emerging Markets
Fast-growing countries like India, Vietnam, Indonesia, Brazil, and the Philippines grow faster than many developed nations. Rising incomes, urbanization, young populations, and new industries create high-growth opportunities that are unavailable in slow-growing economies.
4. Protection Against Currency Risk
A global portfolio naturally hedges currency exposure. When one currency depreciates, another may strengthen, which stabilizes your investment value in your home currency.
2. Key Global Asset Classes for Great Growth
1. Global Equities
Stocks provide the highest long-term returns among major asset classes. Global equity investing includes:
Developed Markets (US, UK, Japan, Germany)
Emerging Markets (India, China, Brazil, South Africa)
Frontier Markets (Vietnam, Nigeria, Bangladesh)
You may invest through:
Global index funds
Country-specific ETFs
International mutual funds
ADRs (American Depository Receipts)
The biggest advantage: exposure to global giants like Apple, NVIDIA, Samsung, Toyota, Nestlé, LVMH, and more.
2. Global ETFs
Exchange-Traded Funds provide diversified exposure at low cost. Popular categories include:
MSCI World ETF
MSCI Emerging Markets ETF
S&P 500 ETF
Global Tech ETF
Global Healthcare & Pharma ETF
Clean Energy ETF
ETFs allow you to invest in hundreds of companies across nations in one trade.
3. International Bonds
Bonds provide stability and income. Investing globally gives access to:
US Treasuries (most stable globally)
Eurozone bonds
Asian government bonds
Global corporate bonds
These act as ballast in a volatile portfolio.
4. Real Assets and REITs
You can invest in:
Global REITs
Infrastructure funds
Global commodity ETFs (gold, oil, metals)
These assets protect against inflation and provide diversification.
5. Alternative Global Investments
Venture capital funds
Private equity
Global hedge funds
International startups (via crowdfunding platforms in some regions)
These offer high potential returns but also higher risk.
3. Global Investing Strategies for Great Growth
1. Core–Satellite Strategy
Your portfolio is built in two layers:
Core (70–80%): diversified global index funds or ETFs (MSCI World, S&P 500, Global Emerging Markets).
Satellite (20–30%): high-growth sectors like AI, EVs, biotech, clean energy, robotics, or country-specific themes.
This balances stability with aggressive growth.
2. Thematic Global Investing
The world is driven by megatrends. High-growth themes include:
Artificial Intelligence
Electric Vehicles & Battery Technology
Green Energy & Climate Tech
Robotics & Automation
Digital Health & Genomics
Cybersecurity
Space Technology
Semiconductors
Investing in global thematic funds lets you catch long-term exponential trends.
3. Country Rotation Strategy
Different countries outperform at different times.
Examples:
US leads in technology
India leads in consumption & digital payments
China leads in EVs
Japan leads in robotics
Europe leads in luxury & renewable energy
Rotating positions across countries can capture high phases of growth.
4. Dollar-Cost Averaging (DCA) Globally
Investing fixed amounts regularly (monthly/quarterly) reduces timing risk and steadily builds global exposure.
5. Risk-Parity Global Allocation
Allocate based on risk, not just geography:
Stocks (global): 60%
Bonds (global): 20%
REITs: 10%
Commodities: 10%
This provides long-term balance across cycles.
4. Risks in Global Investing and How to Manage Them
1. Currency Risk
Foreign currencies fluctuate compared to your home currency.
Solution: Use hedged funds or diversify across many currencies.
2. Political & Regulatory Risk
Geopolitical tensions, sanctions, trade wars, and domestic policy changes impact returns.
Solution: Invest through diversified ETFs instead of concentrating in one high-risk nation.
3. Market Liquidity Risk
Some emerging markets have lower liquidity.
Solution: Prefer large, reputable ETFs and funds.
4. Overexposure to One Country
Many investors buy too many US tech stocks, ignoring Europe or Asia.
Solution: Maintain a balanced global mix.
5. Example of a Balanced Global Growth Portfolio
Aggressive Growth Portfolio Example:
40% US Equities (S&P 500 / Nasdaq)
20% India & Emerging Markets
20% Global Tech / AI / Semiconductor ETFs
10% Europe & Japan Equities
5% Global REITs
5% Gold or global commodities ETF
This mix taps into worldwide growth engines.
6. Benefits of Long-Term Global Investing
1. Higher Compounding Potential
When you own the fastest-growing companies globally, your wealth compounds at a higher pace.
2. Reduced Volatility
A global portfolio is more stable because downturns in one region are offset by growth in another.
3. Access to Worldwide Innovation
You can own stocks driving future revolutions—AI, space, clean tech, biotech.
4. Inflation Protection
Global assets usually hedge long-term inflation.
7. How to Start Investing Globally
Open an international brokerage account (e.g., Interactive Brokers, Webull, Vested, or your region’s global access broker).
Start with broad global ETFs.
Add specific regions (US, Europe, Japan, emerging markets).
Gradually include thematic funds.
Rebalance yearly.
Invest consistently.
Conclusion
Investing globally is one of the smartest ways to achieve great long-term growth. It lets you diversify across continents, participate in worldwide innovation, and capture opportunities unavailable in your home market. A well-structured global portfolio combines stability, growth, and resilience, ensuring your wealth compounds over decades.
Whether you are a beginner or an experienced investor, the world is now open to you. Start small, remain consistent, stay diversified, and allow global compounding to work in your favor.

The Impact of Corporations on Global Trade1. Corporations as Engines of Trade Expansion
Corporations, especially MNCs, are central to the expansion of global trade. These organizations operate in multiple countries, producing and selling goods and services on a scale that often surpasses the capacity of national economies. By establishing subsidiaries and joint ventures in foreign markets, corporations increase trade flows both in imports and exports. For instance, a technology company headquartered in the United States may source components from Japan, manufacture products in China, and sell them across Europe, effectively linking multiple economies through a single corporate network. This activity not only boosts trade volumes but also diversifies market opportunities for smaller businesses that supply inputs to these corporations.
2. Supply Chain Integration and Global Value Chains
A critical way in which corporations impact global trade is through the development of global supply chains and value chains. Modern production processes are fragmented across nations, allowing corporations to optimize costs, access specialized skills, and leverage comparative advantages. For example, automotive companies often design vehicles in Europe, manufacture engines in Germany, assemble components in Mexico, and distribute finished products worldwide. These intricate supply chains have led to the emergence of Global Value Chains (GVCs), where value is added in different stages across multiple countries. This fragmentation increases cross-border trade in intermediate goods and services, significantly expanding global trade volumes.
3. Technology Transfer and Knowledge Dissemination
Corporations are key conduits of technology and knowledge transfer across borders. When a corporation invests in a foreign country, it often brings advanced production techniques, management practices, and innovation capabilities. This transfer of technology boosts the productivity and competitiveness of the host country, indirectly influencing trade by enhancing export potential. For example, foreign direct investment (FDI) by high-tech corporations in developing economies can enable local firms to adopt modern technologies, facilitating the production of export-quality goods and services. Consequently, corporations not only trade goods but also foster skill development and technological upgrading globally.
4. Market Creation and Consumer Demand Expansion
Corporations also shape global trade by creating new markets and stimulating consumer demand. Through strategic marketing, product localization, and brand recognition, corporations expand the reach of their products to international markets. This expansion often encourages other domestic and international suppliers to enter these markets, increasing trade activity. For instance, the entry of multinational consumer goods companies into emerging economies often introduces a range of new products and stimulates imports of raw materials, packaging, and equipment. This effect extends beyond mere consumption—it establishes long-term trade relationships between suppliers and corporate buyers worldwide.
5. Influence on Trade Policy and International Regulations
Large corporations often influence global trade policies and regulations. Through lobbying, strategic partnerships, and participation in international organizations, corporations can affect trade agreements, tariffs, and standards. For example, tech giants may lobby for reduced tariffs on electronic goods or for harmonized digital standards, thereby facilitating smoother cross-border trade. Their influence can also shape regulatory frameworks regarding intellectual property, environmental standards, and labor practices, which in turn affect how trade flows are structured globally. While this can accelerate trade liberalization, it may also create challenges for smaller firms that cannot navigate complex regulatory environments.
6. Economic Impact and Market Competition
Corporations’ impact on global trade extends to economic growth and market competition. By expanding into new markets, corporations generate employment, contribute to tax revenues, and foster industrial development. Increased competition from multinational entrants can encourage local firms to innovate and improve efficiency, raising the overall competitiveness of industries in different countries. However, this dominance can also concentrate market power, leading to monopolistic practices that may distort trade and limit benefits for smaller players. The balance between stimulating trade and maintaining fair competition is a critical aspect of corporate influence on the global economy.
7. Challenges and Criticisms
Despite their positive contributions, corporations’ role in global trade is not without criticism. Critics argue that MNCs can exacerbate economic inequality by extracting resources from developing nations without sufficient local reinvestment. They may exploit labor and environmental regulations to minimize costs, leading to social and ecological consequences. Additionally, the dominance of a few large corporations in key sectors, such as technology or pharmaceuticals, can limit market access for smaller firms and distort trade dynamics. Trade imbalances may also arise if corporations disproportionately favor production in low-cost countries while concentrating profits in high-income regions. Addressing these challenges requires international cooperation, responsible corporate governance, and equitable trade policies.
8. Future Trends and Evolving Corporate Roles
The role of corporations in global trade is evolving in response to technological innovation, geopolitical shifts, and sustainability concerns. The rise of digital platforms and e-commerce enables even small and medium-sized enterprises (SMEs) to engage in cross-border trade, challenging the traditional dominance of large corporations. Sustainability initiatives are pushing corporations to consider environmental and social factors in supply chains, potentially reshaping trade patterns toward greener practices. Moreover, geopolitical tensions, trade wars, and regional trade agreements are influencing corporate decisions on production locations and supply chain management, reflecting a more complex and strategic approach to global trade.
Conclusion
Corporations, particularly multinational ones, are fundamental drivers of global trade. They expand markets, integrate supply chains, transfer technology, and shape consumer demand, all of which amplify international trade flows. At the same time, they wield significant influence over trade policies and economic structures, generating both opportunities and challenges for global markets. While their operations contribute to economic growth and innovation, they also raise concerns regarding inequality, environmental impact, and market concentration. Understanding the multifaceted impact of corporations on global trade is essential for policymakers, businesses, and international organizations seeking to foster equitable, sustainable, and efficient trade systems. As global commerce continues to evolve, the role of corporations will remain central, shaping not only the movement of goods and services but also the broader economic landscape of the 21st century.

The Impact of Multinational Corporations (MNCs) on Trading1. Driving International Trade Growth
MNCs are major engines of global trade. By establishing operations in multiple countries, they create a demand for goods, services, and capital across borders. Their activities often lead to the creation of intricate global supply chains where raw materials, intermediate goods, and finished products move seamlessly between countries. For example, an automobile company headquartered in Germany may source parts from Japan, assemble vehicles in Mexico, and sell them in the United States. This not only increases the volume of trade but also diversifies trade patterns, creating new economic linkages between nations.
MNCs often promote exports from developing countries by investing in local manufacturing plants. This stimulates local economies, generates employment, and enables these countries to integrate into global markets. Countries like China, Vietnam, and India have benefited significantly from MNC-led trade, seeing their export sectors expand dramatically due to foreign direct investment (FDI) from multinationals.
2. Influence on Market Structure and Competition
MNCs can reshape trading markets by altering competitive dynamics. Their size, access to advanced technology, and global networks give them a competitive advantage over domestic firms. This can create efficiencies in production, logistics, and distribution, often resulting in lower costs for consumers. For instance, multinational retail corporations like Walmart or Amazon leverage economies of scale to offer goods at prices that domestic competitors may struggle to match.
However, MNC dominance can also lead to market concentration, where a few large players control significant shares of certain markets. This has implications for trade policies, as governments may feel pressured to create favorable conditions for MNCs to attract investment, sometimes at the expense of local businesses. Thus, while MNCs enhance efficiency and expand trade, they can also introduce competitive challenges for smaller domestic firms.
3. Shaping Global Supply Chains
The operations of MNCs often dictate global supply chain structures, which have a direct impact on trading patterns. Companies like Apple, Samsung, and Toyota rely on a network of suppliers and manufacturers spread across continents. These supply chains facilitate the cross-border movement of intermediate goods, raw materials, and components, which in turn drives international trade.
Moreover, MNCs play a critical role in setting global standards for quality, production, and logistics. By enforcing uniform standards across their global operations, they encourage trading partners to adopt similar practices, thereby enhancing trade efficiency and reliability. However, dependence on MNC-driven supply chains can also create vulnerabilities. For example, disruptions in one region—like a natural disaster or geopolitical tension—can impact global trade flows significantly, as seen during the COVID-19 pandemic when supply chains were severely affected.
4. Technological Transfer and Innovation in Trade
MNCs are often at the forefront of technological innovation. Through their international operations, they transfer knowledge, skills, and technologies to host countries, impacting trading patterns. For instance, a multinational in the electronics sector may establish a research and development (R&D) center in a developing country, equipping local talent with advanced technological know-how. This technology transfer often enhances local production capabilities, enabling these countries to produce goods for export that meet international standards.
Additionally, MNCs introduce advanced management practices, logistics solutions, and production techniques, which improve efficiency and productivity in trade operations. Over time, these innovations contribute to the growth of trade volumes and the development of competitive export sectors in host countries.
5. Impact on Foreign Exchange and Financial Markets
MNCs’ global operations have a significant influence on currency markets and international finance. Their cross-border transactions in goods, services, and capital flows impact foreign exchange demand and supply. For instance, a U.S.-based multinational importing raw materials from India would need to convert dollars into Indian rupees, thereby affecting currency exchange rates. Large-scale operations of MNCs can thus introduce volatility into foreign exchange markets, influencing trade competitiveness and pricing.
Furthermore, MNCs often participate in international capital markets through foreign direct investment (FDI), portfolio investment, or borrowing in foreign currencies. These activities facilitate global financial integration and enhance liquidity in international trade financing. Their investments can also affect trade balances by increasing exports from host countries or boosting imports to supply their global production networks.
6. Influence on Trade Policies and Agreements
Governments often design trade policies to attract or regulate MNC activity. Many countries offer tax incentives, reduced tariffs, and favorable regulatory environments to encourage MNC investments. Consequently, MNCs influence trade policies and international trade agreements. For example, the presence of MNCs in a country may motivate it to negotiate bilateral or multilateral trade agreements that facilitate smoother export and import flows.
Additionally, MNC lobbying can impact international trade rules, including labor standards, environmental regulations, and intellectual property protections. By shaping the regulatory environment, MNCs indirectly affect the flow of goods and services across borders, promoting trade liberalization in some cases while creating barriers in others.
7. Risks and Challenges Introduced by MNCs
While MNCs boost global trade, they also introduce challenges. Overreliance on multinational corporations can make countries vulnerable to global economic shocks, such as sudden shifts in investment flows or supply chain disruptions. The dominance of MNCs in certain sectors can stifle domestic entrepreneurship, reducing the diversity of trade sources. Additionally, ethical concerns related to labor practices, environmental sustainability, and profit repatriation can complicate trade relations.
Global trade is also affected by political tensions involving MNCs. For instance, disputes between home and host countries over taxation, tariffs, or sanctions can disrupt trade flows, highlighting the complex interplay between multinational operations and international commerce.
8. MNCs and the Future of Global Trade
Looking ahead, MNCs will continue to be central to trading patterns. Emerging technologies like artificial intelligence, blockchain, and automation will enable more efficient global logistics and trade tracking. MNCs will likely invest in sustainable and green supply chains, aligning with international environmental standards, which will influence the type of goods traded and the countries involved.
Moreover, geopolitical shifts, trade wars, and regional economic blocs will affect how MNCs structure their operations, creating new trade corridors while potentially reducing reliance on certain markets. Their strategic decisions will continue to have far-reaching implications for global trade, economic growth, and international financial stability.
Conclusion
Multinational corporations have fundamentally transformed international trade. By driving global supply chains, influencing market structures, transferring technology, and shaping trade policies, MNCs create opportunities and challenges for countries around the world. Their operations stimulate economic growth, expand trade volumes, and integrate emerging markets into global commerce. At the same time, their dominance introduces risks such as market concentration, supply chain vulnerabilities, and ethical concerns. Understanding the nuanced impact of MNCs is critical for policymakers, investors, and businesses seeking to navigate the complexities of global trade.
In essence, MNCs act as both facilitators and influencers of trade. Their strategies and decisions resonate across borders, shaping not only the flow of goods and services but also the broader economic and political environment in which international commerce occurs. As globalization evolves, the role of MNCs in trading will remain a defining factor in the architecture of the global economy.
Global Recession Impact on the Stock Market1. Decline in Corporate Earnings and Profit Margins
A recession directly reduces business activity. Companies face:
Lower consumer spending
Weak industrial output
Supply-chain disruptions
Reduced global trade
All these factors hurt corporate profits. Since stock prices are fundamentally based on future earnings, declining earnings expectations lead to falling stock valuations. Sectors dependent on discretionary spending—such as automobiles, luxury goods, travel, entertainment, and retail—tend to see the largest drops.
Industries like utilities, consumer staples, and healthcare experience comparatively less damage because demand remains steady even in downturns.
2. Sharp Stock Market Sell-Offs and Panic Reactions
Recessions amplify fear and uncertainty, triggering:
Panic selling
Liquidity crunches
Forced margin call selling
Flight to safety (bonds, gold, cash)
Investors prefer safe assets over risky equities. This results in broad market declines, often leading to bear markets—defined as a 20% or more drop in stock indices.
Historical patterns show:
2008 Global Financial Crisis: Markets fell 50–60%
2000 Dot-com Crash: Tech-heavy indices declined massively
2020 COVID Crash: Markets dropped 30% in weeks due to recession fears
Psychology plays a huge role. When investors anticipate economic pain, they exit the market rapidly, causing steep downward moves.
3. Rising Volatility and Unpredictable Market Behaviour
During a recession, stock markets experience extreme volatility. Indices can swing 3–8% in a single day as investors react to:
Policy announcements
Interest rate changes
Earnings warnings
Employment reports
Global news and geopolitical events
The VIX index, known as the “fear index”, typically shoots upward in recession periods, reflecting a sharp rise in market uncertainty.
4. Credit Tightening and High Borrowing Costs
Recessions often lead banks and financial institutions to become risk-averse. This causes:
Reduced lending activity
Higher interest rates for risky borrowers
Difficulty for companies to raise capital
Delayed expansion or investment projects
As finance becomes difficult to access, companies struggle to maintain operations, leading to declining stock prices. Financial sector stocks are heavily affected because loan defaults and credit stress increase during recessions.
5. Job Losses and Lower Consumer Spending Hit Market Sentiment
When unemployment rises, consumers reduce spending. This creates a chain reaction:
Lower sales → lower profits → lower stock prices
Businesses cut costs → more layoffs → weaker economy
Investor sentiment drops further
The stock market is extremely sensitive to consumer confidence. When the global population reduces spending, markets price in weaker future demand, causing indices to fall.
6. Currency Fluctuations and Emerging Market Instability
During global recessions:
Investors move money to safe-haven currencies like USD or CHF
Emerging market currencies weaken
Foreign investors withdraw capital
This capital outflow leads to:
Stock market declines in developing countries
Higher import costs
Interest rate hikes to stabilize currency
These factors further intensify stock market stress in regions dependent on foreign investment.
7. Commodity Price Crashes Hit Commodity-Based Markets
Demand for commodities—oil, metals, energy—drops sharply during recessions. This leads to:
Falling commodity prices
Significant declines in commodity-driven equity markets
Lower revenues for countries and companies dependent on raw materials
Energy and mining stocks especially suffer during global downturns.
8. The Role of Central Banks and Government Interventions
While recessions hurt markets, governments and central banks attempt to stabilize conditions using:
Interest rate cuts
Quantitative easing
Fiscal stimulus packages
Bank bailouts or liquidity injections
Such actions can provide temporary relief and may cause short-term market rallies, even during recessions. However, long-term recovery depends on the real economy improving.
Markets often respond positively to stimulus, but if the recession is deep, the rallies may be short-lived.
9. Shift from Growth Stocks to Value and Defensive Stocks
During recessions, investor preferences shift:
Growth Stocks (Tech, Startups, High-Risk Sectors)
Decline more sharply due to high valuations
Struggle with funding shortages
Reduced investor appetite for risk
Value and Defensive Stocks (FMCG, Utilities, Healthcare)
Hold value better
Provide dividends
Offer stability
Portfolio rotation becomes a major trend during recessions, influencing market behavior across sectors.
10. Long-Term Opportunities for Investors
While recessions cause fear and losses, they also create the best long-term investment opportunities. Historically:
Markets recover and hit new all-time highs after recessions
Quality stocks become undervalued
Long-term investors gain the most during recovery phases
Key benefits for disciplined investors include:
Lower entry prices
Higher future returns
Stronger long-term compounding
However, identifying fundamentally sound companies is crucial.
11. Slow and Uneven Recovery Across Sectors
Even after recession ends:
Some sectors recover quickly (technology, IT services, pharma)
Others take years (travel, real estate, heavy industries)
The recovery of stock markets does not always align with economic recovery. Markets often recover before the economy because they are forward-looking.
Conclusion
A global recession deeply affects stock markets through falling corporate earnings, reduced spending, rising job losses, tightening credit, and panic selling. Market volatility increases dramatically, and global liquidity dries up. Sectors linked to discretionary spending and commodities face the sharpest declines, while defensive sectors remain comparatively stable.
Although recessions cause fear and uncertainty, they also offer long-term buying opportunities. Markets eventually recover and grow beyond previous highs, rewarding patient, disciplined investors with strong returns.
Understanding these dynamics helps traders and investors navigate turbulent times with clarity, strategy, and confidence.

Investing in the World Trade Market1. Understanding the World Trade Market
The world trade market is not a single unified marketplace. Instead, it consists of several interconnected segments:
Goods and Services
Countries trade products such as automobiles, electronics, oil, agricultural goods, and software services. Investors can participate through stocks, ETFs, or multinational companies involved in global trade.
Foreign Exchange (Forex)
Global currency trading supports international business. Investors participate to profit from exchange rate fluctuations driven by economic data, interest rates, and geopolitical events.
Commodities
Oil, natural gas, gold, silver, wheat, and other commodities are exchanged globally. Commodity markets are crucial because they influence trade balances, inflation, and corporate profitability.
Global Financial Markets
International stock markets, bonds, derivatives, and cross-border investment instruments allow investors to trade foreign assets.
Together, these components form the backbone of global commerce, offering multiple investment avenues.
2. Why Invest in the World Trade Market?
a. Diversification Beyond Domestic Borders
Investing globally spreads risk across countries and industries. When one nation faces recession, another may experience growth. Diversification helps protect capital from country-specific political or economic downturns.
b. Access to High-Growth Economies
Many emerging markets—India, China, Vietnam, Brazil, and African economies—offer rapid growth rates higher than developed countries. Investing early in these regions can yield substantial long-term returns.
c. Exposure to Global Brands
Companies like Apple, Toyota, Samsung, Nestlé, and LVMH operate across continents. Investors benefit from their global revenues and stability.
d. Currency Appreciation
Global investing exposes investors to foreign currencies. Gaining from strong currencies can multiply returns when converted back into the home currency.
e. Hedge Against Domestic Market Instability
If the domestic market faces inflation, political instability, or economic slowdown, global assets may provide stability.
3. Ways to Invest in the World Trade Market
Investors can participate globally in several ways depending on risk tolerance, knowledge, and financial goals.
a. International Stocks
Investors can buy shares of foreign companies through:
Direct foreign exchanges
Indian brokers offering global investment accounts
American Depositary Receipts (ADRs)
Global Depositary Receipts (GDRs)
This provides direct exposure to overseas corporations.
b. Exchange-Traded Funds (ETFs)
Global ETFs track:
Foreign stock indices (e.g., S&P 500, Nikkei, FTSE)
Global bonds
Emerging markets
Commodities
Multi-asset portfolios
They offer simplicity, diversification, and lower cost.
c. Forex Trading
Investors trade currency pairs like:
USD/INR
EUR/USD
GBP/JPY
Forex gives quick profit potential but carries high volatility and requires knowledge.
d. Commodity Investments
Investors can trade:
Gold and silver
Oil and natural gas
Agriculture (wheat, cotton, coffee)
Commodities are influenced by supply–demand dynamics, weather, geopolitical tensions, and global economic cycles.
e. Global Mutual Funds
Mutual fund companies offer international and global schemes, allowing investors exposure without direct trading in foreign markets.
f. Investing in Multinational Corporations (MNCs)
Buying shares of companies heavily engaged in global trade gives indirect access to world markets. These companies spread risk across continents and benefit from diverse revenue streams.
g. Digital Assets (Crypto)
Crypto markets operate globally and provide decentralized trading opportunities. However, they carry higher risk and require regulatory awareness.
4. Factors Driving Success in World Trade Investments
To succeed in the world trade market, investors must understand key global drivers.
a. Geopolitical Stability
Conflicts, trade wars, sanctions, or diplomatic tensions affect global markets. For example:
War can raise oil and gold prices.
Trade sanctions can reduce corporate profits.
Political instability disrupts supply chains.
b. Economic Indicators
Investors track:
GDP growth
Inflation
Interest rates
Employment data
Consumer spending
Countries with strong indicators attract foreign capital and generate higher returns.
c. Global Supply Chain Trends
Events like pandemics, port shutdowns, or semiconductor shortages create volatility. Understanding these trends helps investors position themselves better.
d. Currency Strength
A strong foreign currency boosts returns when converted back into the home currency. Conversely, currency depreciation can reduce profits.
e. Technological Advancements
Technology facilitates global trade through:
E-commerce
Digital payments
Blockchain logistics
AI-driven global analytics
Industries adopting modern innovations often grow faster.
5. Risks of Investing in the World Trade Market
While opportunities are high, global investing carries distinct risks.
a. Currency Risk
A profitable foreign investment could still result in loss if the target country’s currency weakens relative to the investor’s home currency.
b. Geopolitical Risk
Wars, coups, border disputes, and political changes can disrupt markets.
c. Regulatory Differences
Each country has unique taxation rules, trading restrictions, and compliance standards.
d. Economic Instability
Recessions, inflation, or corporate bankruptcy in foreign nations can negatively affect investments.
e. Liquidity Risk
Some international markets lack trading volume, making it hard to buy or sell assets quickly.
f. Information Gap
Investors may not fully understand foreign markets due to language, cultural, or informational barriers.
Understanding and mitigating these risks is crucial for long-term success.
6. Strategies for Smart Global Investing
a. Research Countries Before Investing
Consider:
Economic strength
Growth potential
Political stability
Currency trends
Market regulations
b. Diversify Across Regions
Spread investments across:
Developed markets (USA, Europe, Japan)
Emerging markets (India, Brazil, Indonesia)
Frontier markets (Africa, Vietnam)
c. Use Global ETFs for Beginners
They provide:
Automated diversification
Low cost
Easy access
Reduced risk
d. Hedge Currency Exposure
Some global funds offer currency-hedged versions to minimize exchange-rate risk.
e. Keep a Long-Term Perspective
Global markets move slower than domestic ones but yield stable, compounding returns over time.
f. Stay Updated with Global News
Monitor:
Trade agreements
Economic releases
Interest-rate decisions
Commodity price movements
Being informed helps anticipate trends earlier.
7. The Future of the World Trade Market
The next decade will transform global investing due to:
Rise of digital currencies
Expansion of India and Southeast Asia
Major shifts in manufacturing hubs
AI-driven global forecasting
Green energy and carbon-credit trading
Growth of cross-border fintech platforms
Global trade is becoming faster, more digital, and more interconnected, opening significantly larger opportunities for investors worldwide.
Conclusion
Investing in the world trade market allows investors to participate in the global economy, benefit from international growth, and diversify their portfolios beyond domestic boundaries. Although it comes with risks such as currency fluctuations, political uncertainty, and regulatory complexities, strategic planning, informed research, and diversification can help investors achieve strong long-term returns. As the world continues to integrate economically, global markets will increasingly influence investment outcomes, making world trade investing not only an opportunity but a necessity for modern investors.

Global Trade Supply and Demand1. The Foundation of Global Supply and Demand
Supply in Global Trade
Global supply refers to how much of a particular good or service producers around the world can provide. Supply depends on:
Natural resources (oil, metals, agricultural land, minerals)
Industrial capacity (manufacturing plants, energy availability, labor force)
Technology and productivity (automation, robotics, digital infrastructure)
Cost efficiency (labor cost, taxation, energy cost)
Trade policies (tariffs, quotas, subsidies)
Geopolitical stability (war, sanctions, alliances)
For example:
Saudi Arabia influences global oil supply.
China dominates manufactured goods supply.
Brazil contributes heavily to agricultural supply.
Any disruption in these regions, such as war or drought, instantly affects global supply chains.
Demand in Global Trade
Global demand represents how much consumers, businesses, and governments worldwide want to purchase. Demand depends on:
Population growth
Income levels and economic growth
Consumer preferences
Technological adoption
Interest rates and inflation
Government spending
For instance:
Rising incomes in India increase global demand for electronics, oil, and automobiles.
The U.S. has high demand for consumer goods, creating massive trade flows from Asia.
Europe’s shift to green energy increases demand for lithium, cobalt, and rare earth metals.
2. How Global Trade Supply Meets Demand
The world is connected through supply chains, transportation networks, and financial systems. These create a structure where goods move efficiently from areas of high supply to areas of high demand.
Trade Routes and Logistics
Key supply–demand connections rely on:
Shipping lanes (Suez Canal, Panama Canal)
Rail networks (China–Europe rail corridors)
Air freight (high-value goods)
Digital trade platforms
Port infrastructure
When a major route is disrupted (e.g., Suez Canal blockade), supply delays cause global price spikes.
Global Value Chains (GVCs)
Most products today are not made in one country; they involve multiple supply chains:
iPhones: designed in the U.S., assembled in China, components from Japan, Korea, and Taiwan.
Automobiles: global sourcing of steel, electronics, engines, and software.
These interconnected systems allow nations to specialize in what they do best, optimizing global supply.
3. Imbalances Between Supply and Demand
Global trade often experiences gaps where supply does not match demand. These imbalances lead to price volatility and economic consequences.
Excess Supply
Occurs when production exceeds consumption:
Oil surpluses cause price crashes.
Overproduction of steel in China creates global price suppression.
Oversupply in agriculture reduces farmers’ income.
Excess Demand
Occurs when demand outstrips supply:
Semiconductor shortages (2020–2022) stopped automobile production.
High demand for housing materials during economic booms increases lumber and steel prices.
Increased energy consumption leads to shortages and higher fuel prices.
These imbalances often spark inflation, currency fluctuations, and government interventions.
4. Factors Influencing Global Supply and Demand
A. Economic Growth Cycles
During economic expansions, demand for commodities, raw materials, and manufactured goods increases. During recessions, global demand falls, pushing down prices.
B. Technological Changes
Automation, artificial intelligence, and digital tools reduce production cost, increasing supply capacity. Meanwhile, technology creates new demand sectors—electric vehicles, smartphones, green energy infrastructure.
C. Geopolitics
Wars, sanctions, and diplomatic tensions directly affect supply:
Russia–Ukraine war disrupted global grain and energy supply.
U.S.–China trade tensions impacted electronics and chip manufacturing.
Middle East conflicts threaten global oil supply routes.
D. Climate Change
Extreme weather disrupts agricultural supply, energy networks, and shipping infrastructure. Rising temperatures reduce crop yields, creating demand pressure for food imports.
E. Demographics and Urbanization
Countries with young populations (India, Africa) generate massive future demand. Aging societies (Japan, Europe) shift demand to healthcare and services rather than manufacturing goods.
5. Pricing Mechanism in Global Trade
Prices act as a bridge between supply and demand. When demand rises faster than supply, prices increase. When supply rises faster than demand, prices fall.
Commodity Prices
Oil, gold, natural gas, and metals are highly sensitive to global events. They are traded on international exchanges where prices adjust instantly.
Currency Influence
Exchange rates impact trade flows:
A weaker currency boosts exports (cheaper for foreign buyers).
A stronger currency increases imports (cheaper to buy from abroad).
Central banks indirectly shape global supply and demand through monetary policy.
Transportation and Freight Costs
Global freight rates significantly influence trade economics. For example, during the pandemic, container shipping prices rose nearly tenfold, affecting supply and causing inflation worldwide.
6. Global Supply Chain Disruptions
Modern trade depends on smooth logistics and political stability. Disruptions include:
Pandemics (COVID-19 halted production and shipping)
Natural disasters (Earthquakes in Japan disrupted electronics supply)
Strikes (Port strikes slow imports and exports)
Energy crises
Cyberattacks on infrastructure
Such disruptions create domino effects across industries and borders.
7. The Future of Global Supply and Demand
The global trade landscape is currently undergoing transformation. Several trends will shape the future:
A. Nearshoring and Friend-shoring
Companies are moving supply chains closer to home or to politically aligned countries to reduce risk.
B. Automation and Digital Trade
Robotics, 3D printing, and e-commerce reduce dependence on global labor and physical supply chains.
C. Renewable Energy Demand
The shift from fossil fuels to solar, wind, and electric mobility is increasing demand for lithium, nickel, copper, and rare earth metals.
D. Evolving Consumer Preferences
Sustainability, ethical sourcing, and climate-friendly production are becoming decisive factors.
E. Multipolar World Economy
Trade is shifting from U.S.–China dominance to a more diversified pattern involving India, ASEAN, Africa, and Latin America.
Conclusion
Global trade supply and demand form the backbone of the world economy. They determine how goods flow across nations, influence prices, shape geopolitical strategies, and affect the daily lives of billions. The interaction between how much countries can produce and how much the world wants to consume drives growth, development, technology, and innovation.
As globalization evolves, understanding global supply–demand dynamics becomes crucial for governments, businesses, traders, and consumers alike. The countries that manage supply efficiently and meet shifting global demand will remain dominant players in the world market.
ESG & Green Energy Investments1. What ESG Actually Means
ESG refers to a set of standards for evaluating how responsibly and sustainably a company operates. These three dimensions—Environmental, Social, and Governance—serve as a framework to understand non-financial risks that can influence long-term performance.
Environmental (E)
Focuses on how a company interacts with the natural world. Key considerations include:
Carbon emissions and net-zero commitments
Renewable energy usage
Waste management and circular economy practices
Water conservation
Pollution control
Biodiversity impact
Companies that manage environmental risks well are better positioned for regulatory changes, resource scarcity, and the transition to a low-carbon economy.
Social (S)
Covers how a company manages relationships with employees, suppliers, customers, and communities. Factors include:
Labor standards and worker welfare
Diversity and inclusion
Human rights compliance
Customer safety
Community development
Data privacy and cyber security
Strong social practices improve productivity, reduce legal risks, and enhance brand value.
Governance (G)
Refers to corporate leadership and internal controls. Key governance metrics include:
Board independence and diversity
Executive compensation
Anti-corruption policies
Shareholder rights
Ethical conduct
Transparency and accountability
Good governance reduces fraud, mismanagement, and regulatory penalties—factors that directly influence shareholder returns.
2. Why ESG Matters for Investors
There are several reasons why ESG has become integral to investment decision-making:
a. Risk Mitigation
Companies with strong ESG profiles tend to face fewer controversies, regulatory penalties, or reputational setbacks. Climate-related risks—such as extreme weather, carbon taxes, and energy transition timelines—now directly influence asset prices.
b. Superior Financial Performance
Numerous studies show that companies with strong ESG adherence have:
Lower capital costs
Higher operational efficiency
Better long-term profitability
More stable cash flows
Investors increasingly see ESG not as a cost but as a value-creation strategy.
c. Growing Global Regulations
Governments worldwide are mandating sustainability reporting and emissions reduction, pushing ESG integration into standard business practice. For example, the EU’s Corporate Sustainability Reporting Directive (CSRD) and India’s BRSR framework compel listed companies to disclose ESG metrics.
d. Institutional Investor Influence
Pension funds, sovereign wealth funds, insurance companies, and large asset managers now screen investments using ESG criteria. Their portfolios are shifting toward green sectors, influencing global capital flows.
e. Consumer and Market Sentiment
Consumers prefer companies aligned with sustainability. Firms with strong ESG profiles often benefit from brand loyalty and long-term demand stability.
3. Green Energy Investments: The Core of the ESG Transition
Green energy investments refer to capital allocated to renewable and sustainable energy sources such as:
Solar
Wind
Hydro
Geothermal
Biomass
Green hydrogen
Energy storage solutions
Carbon capture and renewable fuels
The energy transition is accelerating as the world moves away from fossil fuels. Several forces drive this shift:
a. Climate Change Imperatives
Global warming concerns and carbon reduction targets under the Paris Agreement have pushed governments to accelerate renewable energy adoption.
b. Declining Renewable Costs
Technology advancements and economies of scale have drastically reduced the cost per unit of solar and wind power, making them competitive with coal and natural gas.
c. Technological Breakthroughs
Innovations in battery storage, smart grids, electric mobility, and green hydrogen are reshaping the energy sector and creating massive investment opportunities.
d. Corporate Clean Energy Demand
Tech giants, manufacturing companies, and industrial firms are increasingly committing to 100% renewable energy to meet ESG goals.
4. Key Green Energy Investment Themes
1. Solar Energy
Solar remains the fastest-growing renewable sector due to falling panel prices and rising adoption across households, industries, and grid-scale plants. Rooftop solar, floating solar, and utility-scale installations represent major avenues for investors.
2. Wind Energy
Both onshore and offshore wind offer strong long-term growth, with offshore wind emerging as a trillion-dollar market driven by advanced turbine designs and coastal infrastructure investment.
3. Green Hydrogen
Seen as the "fuel of the future," green hydrogen can decarbonize heavy industries like steel, chemicals, and shipping. Massive government subsidies globally are accelerating the sector.
4. Electric Vehicles & Charging Infrastructure
EV adoption is surging, supported by clean energy policies and consumer demand. Charging networks, battery manufacturing, and EV components represent high-potential themes.
5. Energy Storage
As renewable usage increases, storage becomes essential to stabilize grids. Lithium-ion batteries, solid-state batteries, and flow batteries are attracting significant investment.
6. Carbon Capture & Utilization
Companies are developing carbon removal technologies to meet net-zero mandates. This includes direct air capture, storage, and carbon-to-fuels technologies.
5. ESG Investing Strategies
Investors approach ESG in several structured ways:
a. Negative Screening
Excluding harmful sectors such as:
Tobacco
Weapons
Coal
Oil & gas
Gambling
Alcohol
b. Positive Screening
Selecting companies with strong ESG scores or leadership in sustainability practices.
c. ESG Integration
Embedding ESG factors into fundamental financial analysis to improve risk-adjusted return potential.
d. Thematic Investing
Focusing on themes such as renewable energy, clean technology, water conservation, electric vehicles, or circular economy.
e. Impact Investing
Investing specifically to achieve measurable social or environmental outcomes alongside financial returns.
f. Best-in-Class Approach
Investing in industry leaders with the highest ESG performance within their sector.
6. Benefits of ESG & Green Energy Investing
Lower long-term risks
Increased portfolio resilience
Exposure to fast-growing sectors
Regulatory advantages
Improved brand value and stakeholder trust
Alignment with global sustainability goals
Potential for long-term outperformance
7. Challenges and Concerns
While ESG investing is powerful, it is not without challenges:
1. Greenwashing
Some companies exaggerate ESG claims without genuine action. Investors must verify data authenticity.
2. Lack of Standardization
Different ESG rating agencies use different methodologies, creating inconsistencies.
3. Short-Term Costs
Sustainability investments often require high upfront capital.
4. Policy Uncertainties
Changes in government regulations can influence renewable project viability.
8. The Future of ESG & Green Energy Investments
The future is characterized by:
Stricter sustainability regulations
Growth of carbon markets
Increased corporate and investor accountability
Scaling of green hydrogen and storage technologies
AI-driven ESG analytics
Trillions of dollars flowing into the global energy transition
ESG and green energy investments are expected to dominate global markets for decades as climate change, technological innovation, and policy support reshape the global financial landscape.

Global Banking & Financial Stability1. Introduction to Global Banking
Global banking refers to financial institutions that operate across multiple countries and offer a wide range of services—including commercial banking, investment banking, wealth management, and cross-border payment systems. These banks connect global markets by facilitating international trade finance, foreign exchange operations, capital flows, and investment activities.
The world’s large banks—such as JPMorgan Chase, HSBC, BNP Paribas, Mitsubishi UFJ, and Citigroup—are systemically important. They hold trillions in assets and operate in dozens of countries. Their global integration enhances economic connectivity, but it also means that shocks can spread quickly across jurisdictions.
2. Importance of Global Banking in the World Economy
Global banking plays a vital role in:
a) Capital Allocation
Banks direct funds to productive sectors by offering loans, underwriting securities, and supporting business expansions. Efficient allocation helps economies grow.
b) Payment and Settlement Systems
Banking infrastructure enables fast and secure cross-border payments. Systems like SWIFT, CHIPS, Fedwire, and TARGET2 ensure the smooth functioning of global financial markets.
c) Risk Diversification
Banks diversify risk by operating across multiple geographies and asset classes. This lowers the impact of localized economic downturns.
d) Foreign Exchange & Global Trade
Banks facilitate forex trading, hedging, and trade finance instruments (LCs, guarantees). Without them, global trade would slow dramatically.
e) Financial Inclusion and Technology
Through digital banking, fintech collaborations, and mobile payments, global banks accelerate financial inclusion.
3. What Is Financial Stability?
Financial stability means the financial system—banks, markets, institutions, and infrastructure—functions smoothly without widespread disruptions. A stable financial environment:
protects savings and investments
maintains confidence in banking systems
supports credit availability
prevents economic recessions caused by financial crises
When financial stability weakens, it manifest in:
bank failures
liquidity shortages
credit crunch
currency crises
stock market crashes
sovereign debt problems
Ensuring stability is therefore a top priority for central banks and regulators around the world.
4. Key Pillars of Global Financial Stability
a) Strong Banking Regulation
Regulatory frameworks such as Basel I, II, and III set global standards for capital adequacy, risk management, leverage ratios, and liquidity.
Basel III introduced:
Higher capital buffers (CET1 requirements)
Liquidity Coverage Ratio (LCR)
Net Stable Funding Ratio (NSFR)
Countercyclical capital buffers
These measures were strengthened after the 2008 financial crisis to protect banks from insolvency.
b) Effective Central Banking
Central banks maintain financial stability through:
monetary policy (interest rate decisions)
lender-of-last-resort facilities
regulation and supervision
market interventions (bond purchases, liquidity infusion)
Institutions like the Federal Reserve, ECB, Bank of England, and Bank of Japan play critical roles in global stability.
c) Deposit Insurance & Resolution Frameworks
Deposit insurance protects small depositors and prevents bank runs. Resolution frameworks allow failing banks to be wound down without taxpayer bailouts.
d) Global Cooperation
Bodies such as:
IMF
World Bank
Financial Stability Board (FSB)
BIS
Coordinate policies, share information, and manage crisis responses.
5. Major Threats to Global Financial Stability
1. Interest Rate Volatility
Rapid changes in interest rates can affect:
bond markets
bank balance sheets
borrowing costs
debt sustainability
Sharp rate hikes, like those in 2022–2024, exposed vulnerabilities in banks holding long-dated government securities.
2. High Global Debt
Global debt—household, corporate, and sovereign—has reached unprecedented levels. Excessive debt reduces economic resilience and raises default risks.
3. Bank Runs and Liquidity Crises
Digital banking has made withdrawals instantaneous. The collapse of Silicon Valley Bank (SVB) in 2023 showed how quickly liquidity crises can unfold in the modern era.
4. Geopolitical Risks
Events like:
US–China tensions
Russia–Ukraine war
Middle East conflicts
lead to currency volatility, commodity price shocks, sanctions, and capital flight.
5. Cybersecurity Threats
Banks face risks from cyberattacks, ransomware, and data breaches. As banking becomes more digital, systemic cyber risks increase.
6. Shadow Banking System
Non-bank financial institutions (NBFCs), hedge funds, P2P lenders, and money market funds can create risks outside traditional banking regulation.
7. Climate and ESG-Related Risks
Physical climate risks, energy transitions, and carbon pricing affect asset valuations, insurance exposures, and lending portfolios.
6. Lessons from Past Financial Crises
a) 2008 Global Financial Crisis
Triggered by:
excessive leverage
subprime mortgage lending
securitization
lack of oversight
It caused the collapse of major institutions (Lehman Brothers), global recession, and massive bailouts. Stronger regulations were introduced afterward.
b) Eurozone Debt Crisis (2010–2012)
Greece, Portugal, Spain, and Italy faced sovereign debt issues. It highlighted the vulnerability of economies tied by a common currency but not by unified fiscal policy.
c) COVID-19 Crisis (2020)
A global economic shutdown triggered liquidity shortages, but coordinated policy actions (rate cuts, QE, stimulus) helped stabilize markets.
d) US Regional Bank Crisis (2023)
Banks with concentrated deposit bases and interest-rate mismatches faced collapse. It reaffirmed the importance of asset-liability management.
7. Strengthening Financial Stability in the Future
1. Advanced Risk Management
Banks are deploying AI, big data, and machine learning to improve credit scoring, fraud detection, and asset quality monitoring.
2. Technology Regulation
Regulating fintechs, digital banks, crypto exchanges, and stablecoins is essential to prevent new systemic risks.
3. Climate-resilient Banking
Stress testing for climate risk and sustainable finance strategies will be vital.
4. Cross-Border Supervisory Cooperation
As banks operate globally, regulators must share real-time data and jointly manage crises.
5. Modernized Payment Infrastructure
Central bank digital currencies (CBDCs) and faster cross-border payments may improve stability by reducing settlement risks.
Conclusion
Global banking is the lifeline of the world economy, facilitating trade, capital flows, and economic development. Financial stability, on the other hand, ensures that the system can absorb shocks, support growth, and maintain public confidence.
While global banking has become more resilient since the 2008 crisis, new challenges—cyber risks, geopolitical tensions, climate risks, leveraged debt, and technological disruptions—continue to test its strength. Ensuring financial stability requires coordinated global regulation, robust central bank policies, technological safeguards, and disciplined risk management.
In an interconnected world, the stability of one nation’s financial system directly affects others. Therefore, maintaining global banking stability is not just an economic necessity—it is essential for global peace, growth, and long-term prosperity.

Crypto Market Trends (Bitcoin, Ethereum, Stablecoins)1. Bitcoin Trends
Bitcoin (BTC), the world’s first and most widely recognized cryptocurrency, remains the benchmark for the entire digital asset market. Several recent trends shape its behavior:
A. Institutional Adoption Accelerates
Institutional involvement has grown consistently, driven by exchange-traded products, corporate investments, and hedge funds using Bitcoin as an alternative asset. The approval of spot Bitcoin ETFs in major economies (primarily the US and a growing list of other countries) has created new channels of capital inflow. These funds have attracted billions of dollars in assets under management, making Bitcoin more accessible to traditional investors.
B. Bitcoin as a Macro-Driven Asset
Bitcoin is increasingly treated like a risk-on macro asset influenced by:
Global interest rates
Inflation expectations
U.S. Federal Reserve monetary policy
Liquidity cycles
During periods of rate cuts or economic uncertainty, Bitcoin often attracts attention as “digital gold” or a hedge against currency debasement. Conversely, when rates rise and liquidity tightens, BTC experiences downward pressure.
C. Halving Cycles and Supply Shock
Bitcoin operates on a fixed supply of 21 million coins, with block rewards halving every four years. Each halving reduces the rate of new BTC entering the market. Historically, these events lead to:
Reduced selling pressure from miners
Increased scarcity-driven demand
Potential long-term bullish cycles
Even after each halving, the narrative of Bitcoin as a scarce, deflationary asset strengthens.
D. Growing Role in Global Money Transfers
Bitcoin usage in cross-border payments has surged due to:
Lower transaction fees via the Lightning Network
Faster settlement times
Limited dependency on traditional banking systems
This trend is especially prominent in countries facing currency crisis, inflation, or capital controls.
E. Market Maturity and Reduced Volatility
Compared to earlier years, Bitcoin’s volatility has begun to moderate as liquidity increases and institutional participation grows. This does not eliminate major price swings, but BTC is gradually moving toward being a more established asset class.
2. Ethereum Trends
Ethereum (ETH) dominates the smart contract and decentralized application ecosystem. It serves as the backbone for decentralized finance (DeFi), NFTs, tokenization, and much more. Ethereum trends include:
A. Transition to Proof of Stake (PoS)
The successful transition from Proof of Work (PoW) to Proof of Stake (PoS)—known as the Merge—has permanently shifted Ethereum’s energy consumption and security model. The PoS upgrade has:
Reduced energy usage by ~99%
Made staking a core yield-generating activity
Enhanced network security through validator decentralization
ETH staking continues to grow, locking a significant portion of supply away from active circulation.
B. Surge in Ethereum Layer-2 Ecosystems
Ethereum’s scalability challenges led to the rise of Layer-2 chains like:
Arbitrum
Optimism
Base
zkSync
StarkNet
These chains:
Reduce transaction fees
Increase processing speed
Expand Ethereum’s usability for retail users
The long-term trend is toward Ethereum becoming the settlement layer while L2s handle high-volume activity.
C. Tokenization of Real-World Assets (RWA)
One of the fastest-growing sectors on Ethereum is asset tokenization. Institutions are issuing blockchain-based representations of:
Government bonds
Real estate
Corporate debt
Money-market funds
Tokenized U.S. Treasury products on Ethereum have grown rapidly, showing real institutional use beyond speculation.
D. Ethereum as the Base Layer for DeFi
Even after market cycles and volatility, Ethereum remains the dominant chain for:
Lending protocols (Aave, Compound)
Decentralized exchanges (Uniswap, Curve)
Price oracles (Chainlink)
Yield staking
Total Value Locked (TVL) tends to rise and fall with overall market sentiment, but Ethereum consistently holds the largest share.
E. Shift Toward Deflationary Supply
After EIP-1559 introduced base fee burning, Ethereum sometimes becomes deflationary, meaning more ETH is burned than issued—especially during periods of high network activity. This creates a long-term bullish supply dynamic similar to Bitcoin’s scarcity.
3. Stablecoin Trends
Stablecoins are the foundation of global crypto liquidity. They provide stability, enable global transactions, and serve as a bridge between traditional finance (TradFi) and decentralised finance (DeFi).
A. Rapid Growth in Market Capitalization
Stablecoins like USDT, USDC, and emerging decentralized alternatives have seen strong growth. They are increasingly used for:
Trading pairs on crypto exchanges
Remittances
Yield generation
On-chain settlement
DeFi collateral
USDT continues to dominate due to its wide availability and high adoption in cross-border markets.
B. Regulatory Tightening and Transparency
Governments worldwide are enforcing stricter oversight of stablecoins. The aim is to ensure:
1:1 reserve backing
Independent audits
Stronger disclosure requirements
These regulations help institutional adoption and reduce risks associated with opaque issuers.
C. Rise of On-chain Payments
Stablecoins are rapidly emerging as a global payments infrastructure. Businesses and fintech companies increasingly use stablecoins for:
Payroll
B2B transfers
E-commerce
Cross-border settlements
Their speed, low cost, and 24/7 availability make them an attractive alternative to SWIFT.
D. Competition from CBDCs
Central banks globally are experimenting with Central Bank Digital Currencies (CBDCs). Although CBDCs will coexist with stablecoins, they may compete in retail and wholesale payments. Stablecoins, however, retain the advantage of flexibility, programmability, and cross-chain mobility.
E. Decentralized Stablecoins Return
Decentralized options like DAI and FRAX are evolving to become more resilient. The trend is toward:
Overcollateralized models
Multi-asset backing
Algorithmic governance with strong safety features
This helps reduce dependence on centralized issuers.
4. Combined Crypto Market Themes
A. Institutionalization of Crypto
Bitcoin, Ethereum, and stablecoins together form the backbone for large institutions entering the market. Their maturity and regulatory clarity provide confidence for long-term investment.
B. Integration with Traditional Finance
Crypto is increasingly merging with traditional financial rails:
Tokenized stocks
Tokenized treasury bonds
Crypto payment cards
Stablecoin-powered banking services
C. Market Cycles Driven by Liquidity
Crypto markets remain heavily influenced by global liquidity. When monetary conditions ease, capital flows into BTC and ETH first, then spreads to altcoins.
D. On-Chain User Growth
Wallet creation, transaction counts, staking participation, and L2 adoption are rising steadily. Crypto is shifting from speculation to real-world usage.
Conclusion
Bitcoin, Ethereum, and stablecoins represent the three fundamental pillars of the modern cryptocurrency ecosystem. Bitcoin leads as a global digital store of value, Ethereum powers decentralized applications and financial innovation, while stablecoins act as the liquidity engine for global on-chain activity. Together, these sectors continue to grow due to institutional adoption, technological advancements, and increased global demand for decentralized alternatives to traditional financial systems. As regulatory clarity emerges and more real-world uses develop, these assets are positioned to drive the next phase of crypto market expansion.
Equity Market Indices (S&P 500, Nasdaq, DAX, Nikkei)1. S&P 500 Index — The Global Benchmark
The Standard & Poor’s 500 Index, commonly known as the S&P 500, is one of the world’s most followed equity indices. It tracks 500 of the largest publicly listed companies in the United States. Unlike the Dow Jones Industrial Average, which uses price weighting, the S&P 500 uses free-float market capitalization weighting, making it a more accurate representation of the U.S. equity market.
Structure and Components
The index spans all major U.S. sectors, including technology, financials, healthcare, consumer discretionary, and energy. Mega-cap companies like Apple, Microsoft, Amazon, and Alphabet often dominate the index due to their large market capitalizations.
Economic Significance
The S&P 500 accounts for over 80% of U.S. total market value, making it a barometer for overall U.S. corporate health. Movements in the index reflect:
Corporate earnings trends
Investor sentiment
Monetary policy expectations
Global macroeconomic factors
Investment and Trading Use
Investors use the S&P 500 for:
Benchmarking fund performance
ETF and index fund investing (e.g., SPY, VOO)
Futures and options trading
Analysts often interpret a rising S&P 500 as a sign of economic expansion, while prolonged declines may indicate recession concerns.
2. Nasdaq Composite & Nasdaq-100 — Tech-Heavy Growth Indicators
The Nasdaq Composite is one of the most technology-heavy indices in the world, tracking over 3,000 stocks listed on the Nasdaq exchange. The more popular trading index, however, is the Nasdaq-100, which includes the top 100 non-financial companies on Nasdaq.
Technology Dominance
The Nasdaq is dominated by:
Technology
Internet services
Biotechnology
Semiconductor companies
Major names include Apple, Microsoft, Nvidia, Meta, and Tesla.
Characteristics and Sensitivity
Because it is tech-heavy, the Nasdaq tends to be:
More volatile than the S&P 500
Highly sensitive to interest rate changes
Influenced strongly by innovation trends, earnings expectations, and regulatory actions
Growth stocks, which dominate the Nasdaq, typically outperform during low-interest-rate environments when borrowing is cheaper and future earnings are more valuable.
Use for Traders
Traders often use the Nasdaq as a sentiment gauge for:
Tech sector strength
Risk appetite in markets
Momentum-driven trading strategies
Nasdaq futures (NQ) and ETFs like QQQ are among the most actively traded instruments globally.
3. DAX (Germany) — Europe’s Industrial Power Index
The DAX (Deutscher Aktienindex) is Germany’s leading stock index, representing 40 blue-chip companies listed on the Frankfurt Stock Exchange. Unlike other indices, the DAX is a performance index, meaning dividends are reinvested, resulting in slightly higher long-term returns.
Composition
The DAX includes major industrial, automotive, chemical, and financial giants such as:
Siemens
Volkswagen
Mercedes-Benz
Bayer
Allianz
SAP
Role in Europe
Germany is Europe’s largest economy, so the DAX essentially acts as a proxy for the health of the Eurozone economy. It reflects:
Manufacturing output
Export competitiveness
Global demand for automobiles and engineering
Euro currency movements
Key Drivers
The DAX is influenced by:
European Central Bank (ECB) policies
Eurozone inflation and GDP
Geopolitical relations with the U.S. & China
Energy prices (Europe is energy-dependent)
During periods of higher global industrial activity, the DAX typically performs strongly due to Germany’s export-led economy.
4. Nikkei 225 — Japan’s Economic Indicator
The Nikkei 225, Japan’s best-known stock index, tracks 225 top companies on the Tokyo Stock Exchange. Unlike most major indices, the Nikkei is price-weighted, similar to the Dow Jones, meaning higher-priced stocks have greater influence regardless of company size.
Sector Mix
Japan’s market includes a mix of:
Automotive companies (Toyota, Honda, Nissan)
Consumer electronics (Sony, Panasonic)
Industrial manufacturers (Fanuc, Hitachi)
Financial institutions
Economic Importance
The Nikkei reflects Japan’s:
Export competitiveness (especially to the U.S. and China)
Yen strength or weakness
Domestic consumption trends
Bank of Japan (BOJ) monetary policy
Japan's prolonged period of low interest rates and deflation has historically shaped the Nikkei’s long-term performance.
Yen Relationship
The Nikkei tends to rise when the Japanese yen weakens, because a weaker yen boosts export revenues. It often behaves inversely to USD/JPY currency movements.
5. How Traders Use These Indices
Market Sentiment Indicators
Each index provides insight into different segments:
S&P 500: overall U.S. economy
Nasdaq: tech and growth sentiment
DAX: European industrial strength
Nikkei: Asian economic trends
Sector Rotation
Investors analyze relative performance to gauge:
Growth vs. value cycles
Domestic vs. international capital flows
Risk-on vs. risk-off behavior
Hedging & Diversification
Indices are widely used for:
Portfolio diversification
Hedging through futures/options
ETF investing across regions
Correlation Behavior
S&P 500 and Nasdaq have high correlation
DAX moves closely with global manufacturing trends
Nikkei correlates strongly with currency markets
Understanding these correlations helps global traders manage risk and time their entries.
6. Global Impact of Index Movements
Because these are major world indices, movements can influence:
Commodity prices (oil, gold)
Currency valuations (USD, EUR, JPY)
Bond markets
Emerging market flows
For example:
A strong S&P 500 often attracts global capital into the U.S.
Weak DAX performance can signal European recession fears
A rising Nikkei can lift Asian equity sentiment
Conclusion
Equity market indices like the S&P 500, Nasdaq, DAX, and Nikkei 225 are more than just collections of stock prices. They are critical indicators of economic health, investor behavior, and global financial stability. Each index reflects the structure of its economy—U.S. technology leadership for Nasdaq, diversified large caps for the S&P 500, industrial might for the DAX, and export-driven growth for the Nikkei. Together, they form the backbone of global equity analysis and remain essential tools for traders, investors, and policymakers worldwide.

GU, UJ & Gold: Calm Before the Storm | Fed, BoJ, BoE AheadThe markets have been stuck in ranges for weeks, GBPUSD, USDJPY, and Gold all moving sideways. In this video, I share a clear perspective on why that’s happening and what could finally trigger a breakout.
Here’s what you’ll gain:
✅A simple breakdown of the range structures on GBPUSD, USDJPY, and Gold.
✅The key economic events next week that could shake the market (Fed, BoJ, BoE, UK CPI & labour data).
✅Likely breakout scenarios and the triggers to watch.
✅How to avoid getting trapped while the price is still consolidating.
This is the “calm before the storm” phase, and knowing how to position yourself ahead of it could make all the difference.
👉 Drop a comment with the pair you’re watching most closely.
Trade smart, trade consciously.
Disclaimer:
Based on experience and what I see on the charts, this is my take. It’s not financial advice, always do your research and consult a licensed advisor before trading.

EURUSD Testing the Wedge, Eyes on Breakdown PotentialPrice action on EURUSD is coiling within a broad ascending wedge, and momentum looks heavy near the upper bound. The repeated rejections at resistance highlight fading bullish energy, and with fundamentals aligning toward USD resilience, the pair could be preparing for a downside break. Let’s break this down step by step.
Current Bias
Bearish, price action signals downside risk as EUR/USD fails to sustain momentum at wedge resistance and approaches critical support.
Key Fundamental Drivers
ECB stance: Recent commentary (Patsalides, Kazaks, Simkus) shows caution. ECB members see risks balanced but stress that the next move could still be higher if needed.
Fed policy: US data (labor cooling, ISM Services expansion, sticky inflation) keeps Fed in cautious easing mode. The dollar still benefits from safe-haven demand and relative growth strength.
Yield spreads: US Treasury yields remain elevated compared to Eurozone bonds, keeping USD attractive.
Macro Context
Interest rates: ECB signals that cuts are not urgent, while the Fed eyes gradual easing. The relative policy stance favors USD stability.
Economic growth: Eurozone growth data remains fragile (Germany flat, France stable, Italy soft). US shows moderate but slowing growth.
Commodity flows: Energy prices are softer, reducing pressure on the Eurozone’s import bill but also reflecting weaker global demand.
Geopolitical: Tariffs, EU-US trade tensions, and energy security risks remain an overhang.
Primary Risk to the Trend
A dovish Fed pivot or softer US CPI could weaken the USD, pushing EUR/USD higher through wedge resistance. Conversely, if Eurozone inflation flares up again, the ECB could delay cuts, temporarily supporting the euro.
Most Critical Upcoming News/Event
US CPI release – key for Fed trajectory.
ECB meeting minutes and Lagarde’s speeches – signals on rate path.
Eurozone PMIs – fresh check on growth momentum.
Leader/Lagger Dynamics
EUR/USD is a leader within euro crosses, often setting directional bias for EUR/JPY, EUR/GBP, and EUR/CHF. It also tracks USD momentum, so it can act as a lagger to US data-driven moves that first show up in DXY.
Key Levels
Support Levels: 1.1692, 1.1585
Resistance Levels: 1.1746, 1.1788
Stop Loss (SL): 1.1788 (above wedge top)
Take Profit (TP): 1.1585 (major downside target if wedge breaks)
Summary: Bias and Watchpoints
EURUSD is tilting bearish as it stalls at wedge resistance and fundamentals lean toward USD strength. The bias points to a potential break lower, with downside targets near 1.1692 and ultimately 1.1585 if momentum accelerates. A stop loss above 1.1788 protects against false breakouts. Traders should keep a close eye on US CPI and ECB communication, as these will dictate whether this wedge finally resolves to the downside or extends consolidation. For now, the watchpoint is clear: hold bias bearish, with 1.1585 as the key profit zone.

USDJPYas i live in japan but not much as i trade on this pair, here is what i see potentional move aftre brinking the resistent or support, can catch up the trend follow.
the line may make youu clear image, this analysis is base on weekly frame to 4H
weekly low.
weekly high
leave your comment or any qustion in the comment.

BTCUSDi am looking for 1 sharpe retest and quick short on btcusd, as on major higher and high 3 major attempt on weekly time frame. simple draw line you may understand the reason as trend line has a huge gap beetween market that gap considerd to be filed up... if btc continued go high by end of this year. let me know your opinion in the comment. trade with confirmation only.

XAUUSD Bullish Continuation Setup? Gold (XAU/USD) – 1H Technical Outlook
Price action on the hourly chart is developing within a well-defined ascending channel, supported by dynamic trendlines that have consistently provided higher highs (HH) and higher lows (HL), confirming the underlying bullish structure.
The Key Support and Resistance Zone around 3,330–3,350 USD has proven to be a pivotal area, acting as both a consolidation base and a springboard for bullish impulses. The most recent Multi-Confluence Support and Pivot Area aligns with dynamic channel support, reinforcing its technical significance.
Volume Profile (Flow Profile) data remains overall bearish, indicating that a majority of trading activity has occurred at lower levels. However, the profile is beginning to exhibit early signs of accumulation, which often precedes directional reversals in market sentiment.
From a structural perspective, maintaining price action above the 3,328–3,350 USD support range would sustain the bullish bias, with upside potential toward Channel High Resistance near 3,400 USD, and an extended target into the Target Area around 3,420 USD.
Conversely, a decisive break below the Invalidation Zone (~3,310 USD) would undermine the bullish channel structure, increasing the probability of a deeper retracement.
Outlook:
Bias: Bullish continuation, contingent on support holding.
Key Support: 3,328–3,350 USD
Immediate Resistance: ~3,400 USD
Primary Target: ~3,420 USD
Invalidation Level: ~3,310 USD
This setup suggests that, while buyers retain structural control, confirmation from price action and volume behavior will be critical in validating the next bullish leg.

Gold Traders Pay Attention! Major Moves Incoming ? XAU/USD is setting up for a monster move — and all the signs are lining up! 👇
This is a perfect storm of technical confluence you don’t want to miss:
📊 After weeks of consolidation, gold has just broken out of a downtrend, retested the zone, and is now sitting on a major decision point. This zone is packed with:
✅ A dynamic trendline flip (was resistance, now acting as support)
✅ 200 EMA cushioning the retest
✅ 50% Fibonacci retracement aligning perfectly
✅ High-volume node from the volume profile = big player interest
✅ Mid-Bollinger Band offering bounce potential
✅ Strong bullish market structure forming
All eyes are on this green circle zone— a critical battle between bulls and bears. If bulls win here, we could see a powerful move straight into the upper resistance zone, possibly breaking previous June highs! 🦍💥
This is what smart money setups look like — multiple confirmations, clean structure, and asymmetric reward potential. 🔑📈
Tag a gold trader who needs to see this, and drop a ⚡️ if you're locked in on this breakout setup!
VANTAGE:XAUUSD FOREXCOM:XAUUSD EIGHTCAP:XAUUSD
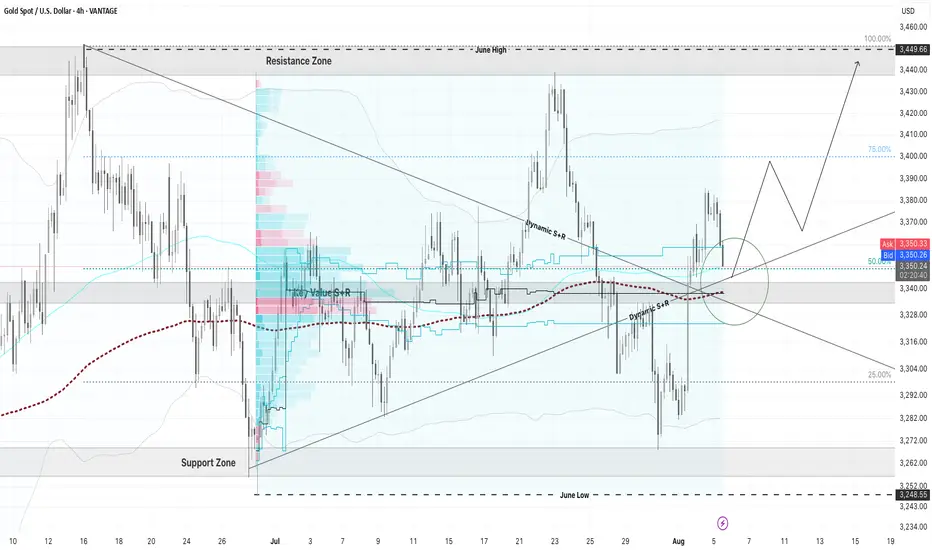
GBPUSD: Bearish Momentum vs. Fundamental Repricing – Key LevelsGBPUSD is at a critical juncture, balancing a clear technical breakdown with a fundamental backdrop favoring near-term volatility. The pair has slipped from its rising wedge structure and is now testing key retracement zones while markets reprice expectations for Fed rate cuts after weak US jobs data. Traders are closely watching whether this bearish momentum will extend toward the 1.3128 support or if a rebound from oversold conditions could trigger a corrective bounce.
Technical Analysis (8H Chart)
Pattern: Clear breakdown from a rising wedge, confirming bearish bias.
Current Level: Price sits near 1.3278, struggling to reclaim the 1.3300 resistance zone.
Key Support Zones:
1.3128 (61.8% Fibonacci retracement) – main bearish target.
1.2945 (78.6% retracement) – extended downside target if selling pressure deepens.
Resistance Levels:
1.3300 (immediate resistance, prior support now flipped).
1.3380 (secondary resistance if a retracement rally occurs).
Projection: Likely bearish continuation toward 1.3128, with a potential retest of 1.3300 before continuation.
Fundamental Analysis
Bias: Bearish in the short term, but Fed policy and risk sentiment remain key drivers.
Key Fundamentals:
USD: Weak NFP (73K), higher unemployment (4.2%), and downward revisions boost Fed cut bets (~75% for September), typically a USD-negative factor.
GBP: BOE maintains a cautious stance due to sticky inflation but lacks clear hawkish conviction as growth slows.
Tariffs: US tariffs add a mild negative weight on GBP trade sentiment.
Risks:
Hot US CPI could slow Fed cut bets, supporting USD.
Hawkish BOE comments could limit GBP downside.
Global risk sentiment shifts could either favor USD (risk-off) or weaken it further (risk-on).
Key Events:
US CPI and PPI for USD direction.
BOE policy updates and UK CPI.
US jobless claims and Fed commentary.
Leader/Lagger Dynamics
GBP/USD is a lagger, mainly reacting to USD shifts. However, its moves directly influence GBP crosses such as GBP/JPY and GBP/CHF.
Summary: Bias and Watchpoints
GBP/USD remains in a bearish phase, targeting 1.3128 with a potential corrective bounce toward 1.3300 first. The primary driver is the technical breakdown, while fundamentals add volatility around US CPI and BOE policy. If CPI surprises lower, the bearish outlook could reverse into a short-term rebound; if CPI is hot, downside momentum could extend. You should monitor USD-driven events closely as GBP/USD sets the tone for broader GBP movements.
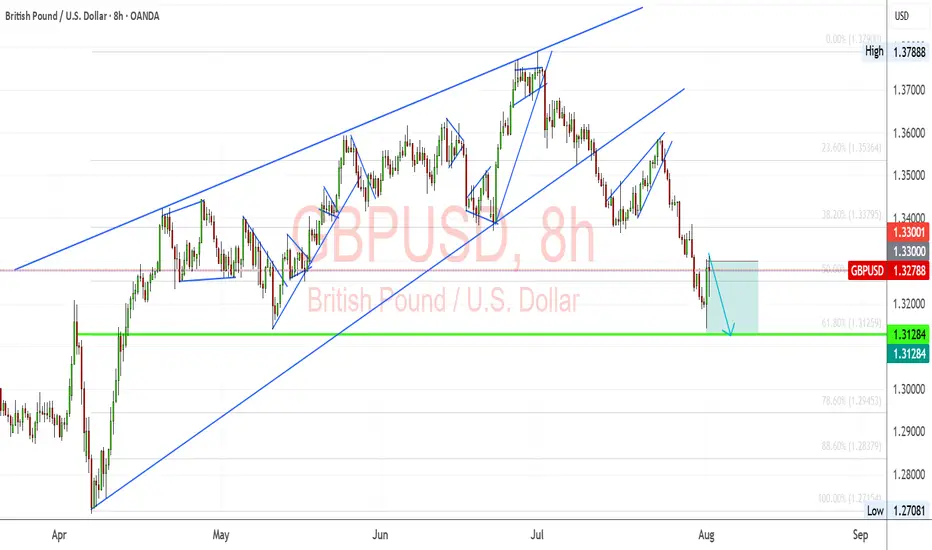
NZDCHF – Bullish Breakout Sets Stage for ReversalNZDCHF has broken decisively out of a long-term descending channel, signaling a potential trend reversal. Price action confirmed multiple bullish flags within the falling structure, followed by a clean breakout and higher low retest, supporting a bullish continuation bias.
Currently, the pair is stabilizing just above prior resistance turned support around 0.4760–0.4780, forming a potential launchpad for the next leg higher.
Upside Targets:
TP1: 0.48336
TP2: 0.48844
TP3: 0.49319
Invalidation Zone:
A drop below 0.4720 would invalidate the breakout structure and expose the downside.
Fundamental Drivers:
🇳🇿 NZD Strength: RBNZ remains relatively hawkish compared to other central banks, and the Kiwi may gain from improving risk sentiment and easing global recession fears.
🇨🇭 CHF Weakness: Swiss Franc is under mild pressure as safe-haven flows weaken amid improving tone on US-China-EU trade headlines and fading ECB rate cut bets.
🗓️ Macro Flow: Upcoming risk events (Fed comments, trade updates, and NZ economic prints) could inject momentum into the pair, especially if risk appetite improves.
Bias: ✅ Bullish (Buy)
Confidence: ★★★★☆
Watch for: Clean hold above 0.4770 zone + bullish momentum continuation.

Why EUR/USD Dropped: A Step-by-Step Breakdown for Learners📉 Overview:
The EUR/USD has recently approached a key resistance zone near 1.17726, showing signs of a potential rejection after a bullish rally. The price is currently hovering around 1.17468, forming a short-term bearish setup that could lead to a retracement or reversal.
⸻
⚙ Key Technical Zones:
• 🔼 Resistance: 1.17500 – 1.17726
Price was strongly rejected after testing this area. This level has historically acted as a supply zone.
• 🔽 Support: 1.15500 – 1.16000
This is a historically significant demand zone, where price previously consolidated and reversed.
• 🎯 Target Zone: 1.16308
Marked as a potential take-profit level based on prior price structure and volume profile imbalance.
⸻
🧠 Indicators & Tools:
• Bollinger Bands: Price touched the upper band in overbought conditions, suggesting a possible mean reversion.
• Volume Profile (VRVP): Indicates declining volume near resistance, pointing to weak buyer momentum.
• Price Action: Bearish engulfing candle and strong rejection wick at resistance, confirming selling pressure.
⸻
🧭 Market Bias:
📌 Short-Term Bearish
A short opportunity is forming based on the rejection from resistance and overextension of price.
⸻
🧩 Possible Scenario:
1. Breakdown below 1.17061 (mid-level support) could trigger acceleration to the downside.
2. 1.16500 and 1.16308 are ideal short targets before reevaluation for continuation or bounce.
⸻
🛑 Risk Management Tips:
• Consider SL above 1.17800 (previous high).
• Monitor for confirmation before entry (e.g., bearish candle close below 1.17000).
• Adjust size and risk-reward ratio appropriately.