GBP/USD –> Double Head and Shoulders PatternHello guys.
On the daily chart, we can clearly see two Head and Shoulders (H&S) formations shaping the market structure -> a larger green H&S and a smaller red H&S inside it.
🔹 Green Head and Shoulders
The green H&S pattern was already completed earlier, and its neckline has been broken to the upside, signaling the start of a potential medium-term bullish trend. The pattern’s measured target points toward the 1.3900 zone, which remains the broader bullish objective.
🔹 Red Head and Shoulders
Recently, a smaller red H&S pattern formed inside this structure. The head of the red pattern tested the Supply & Demand (S&D) zone that was created by the previous (green) H&S pattern.
The neckline of the red H&S, around 1.3542, is now a crucial bullish level. A confirmed breakout above this neckline would likely trigger a continuation move toward 1.36685, which is the projected target of the red pattern.
🔹 Key Levels to Watch
1.3542 → Breakout confirmation zone
1.36685 → Target of the red H&S pattern
1.3900 → Final target of the green H&S pattern
If price holds above 1.3542, the bullish structure remains valid, and momentum could strengthen toward 1.36685 and 1.3900 in extension.
Disclaimer: As part of ThinkMarkets’ Influencer Program, I am sponsored to share and publish their charts in my analysis.
Forexsignal

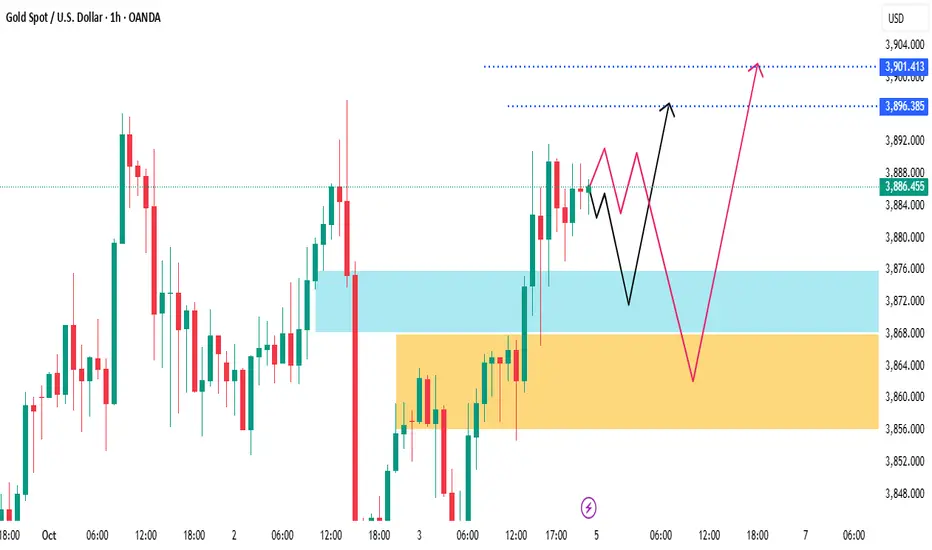
Gold Price Setup: Pullback Before Breakout ?🔎 Key Elements Identified:
Current Price: $3,886.455
Zones:
Blue Zone (~$3,872–$3,880): Minor support zone — recent breakout retest area.
Orange Zone (~$3,856–$3,868): Strong demand zone — deeper retracement area.
Resistance Targets:
$3,896.385: Local resistance.
$3,901.413: Extended upside target.
🛠️ Price Projections:
Black Path (Shallow Pullback):
Small dip into blue zone.
Reversal and break above $3,896 → Target: $3,901.
Red Path (Deeper Pullback):
Deeper drop into orange demand zone (~$3,860).
Strong bullish reversal expected → Same final target: $3,901+.
Bearish Movement Coming UpPotential move to the downside, waiting for price to make it up to at least 50% of the operative range, aligning with an Bearish OB.

EUR/USD: Bearish Drop to 1.168?FX:EURUSD is signaling a bearish move on the 4-hour chart , with an entry zone between 1.17750-1.17950 near a resistance level.
The target at 1.168 aligns with key support, offering a clear downside play. Set a stop loss on a close above 1.1825 to manage risk effectively. 🌟
A break below 1.1770 with strong volume could confirm this drop, driven by USD strength and Euro weakness. Watch U.S. data releases! 💡
📝 Trade Plan:
✅ Entry Zone: 1.17750 – 1.17950 (resistance area)
❌ Stop Loss: Daily close above 1.1825 to manage risk
🎯 Target: 1.168 (key support zone)
Ready for this move? Drop your take below! 👇

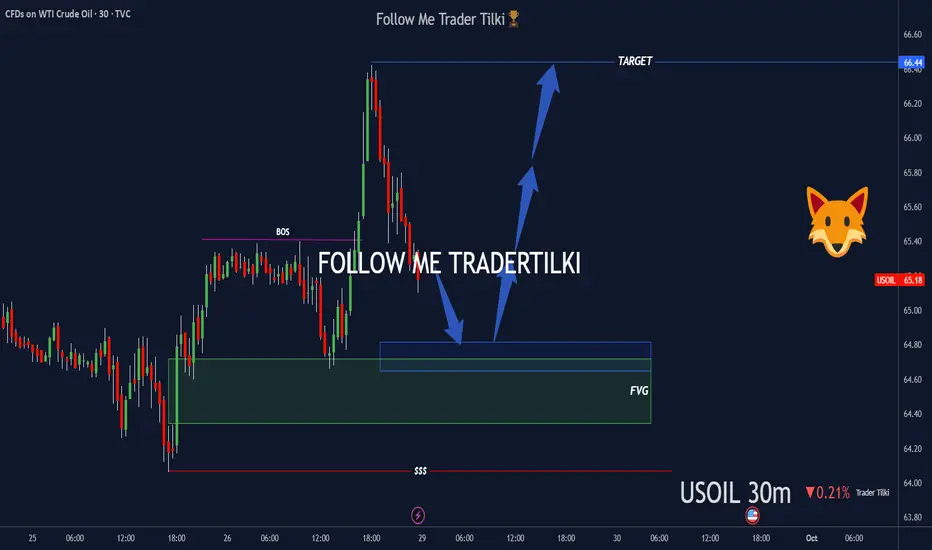
30-minute USOIL Key Buy Zones AnalysisHello Guys,
I’ve prepared a USOIL analysis for you.
I’m watching two buy zones on USOIL:
🔹 First buy zone: 64.70
🔹 Second buy zone: 64.35 or 64,00
From these levels, I’ll definitely open buy positions and take my shot.
🎯 Target level: 66.40
Every like is my biggest motivation to keep sharing these analyses.
Thanks to everyone supporting me!
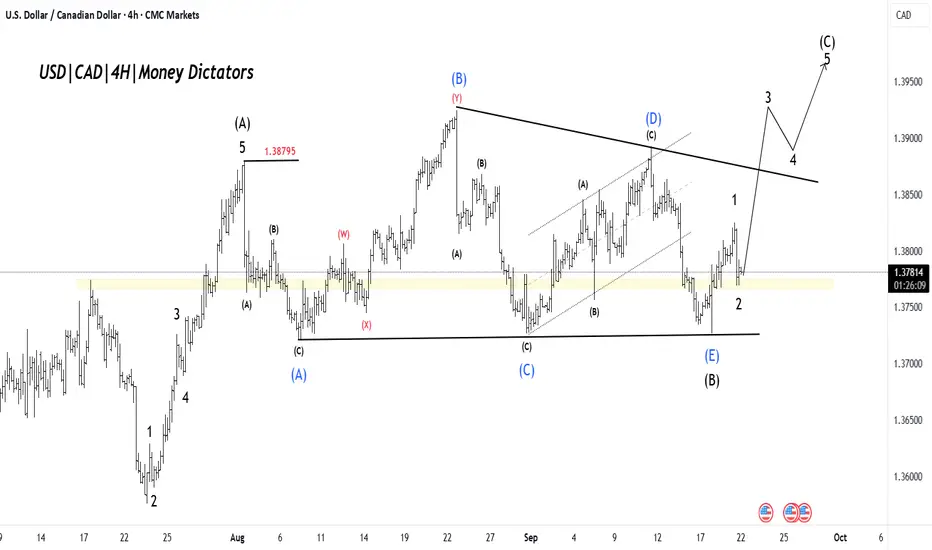
USDCAD: Impulse Wave Points to Higher LevelsUSD/CAD Price is showing the early stages of a bullish (C) leg after a large corrective sequence. The chart labels show a completed corrective (B) low at the horizontal support and an impulsive 1–2 sequence unfolding for the new upward leg. Bias: bullish while price holds above the demand zone/wave-2 low.
The market completed an ABC correction that found support on the horizontal lower boundary. That corrective phase looks finished; we should now be in wave (C) up, the final leg of the correction.
Short-term momentum has flipped, with buyers stepping in at support. This favors trend-following longs into the extension leg (wave 3 → 5)
Target 1 (T1): 1.38408
Target 2 (T2): 1.38810
Stop-Loss (SL): 1.37195
AUDJPY ProjectionWe started from a daily source level which makes up of the support and resistance levels. We used that that frame the bear movement into a buy decisional levels, when we confirm it, we will be able to start looking for buy opportunities

USD/HKD Forex. US Dollar getting stronger vs Honk Kong DollarStrong weekly demand level at $7.779 on USD/HKD forex cross-pair. We're expecting the US Dollar to get much stronger against the Hong Kong dollar in the following days and weeks. You can use this weekly imbalance to trade or use the smaller timeframes to take intraday and scalping Forex long positions.

EURUSD Daily Forecast -Fun Coupon Fri - Q3 | W39 | D26 | Y25|📅 Q3 | W39 | D26 | Y25|
📊 EURUSD Daily Forecast
Fun Coupon Fri
🔍 Analysis Approach:
I’m applying Smart Money Concepts, focusing on:
Identifying Points of Interest on the Higher Time Frames (HTFs) 🕰️
Using those POIs to define a clear trading range 📐
Refining those zones on Lower Time Frames (LTFs) 🔎
Waiting for a Break of Structure (BoS) for confirmation ✅
This method allows me to stay precise, disciplined, and aligned with the market narrative, rather than chasing price.
💡 My Motto:
"Capital management, discipline, and consistency in your trading edge."
A positive risk-to-reward ratio, paired with a high win rate, is the backbone of any solid trading plan 📈🔐
⚠️ Losses?
They’re part of the mathematical game of trading 🎲
They don’t define you — they’re necessary, they happen, and we move forward 📊➡️
🙏 I appreciate you taking the time to review my Daily Forecast.
Stay sharp, stay consistent, and protect your capital
— FRNGT 🚀
FX:EURUSD

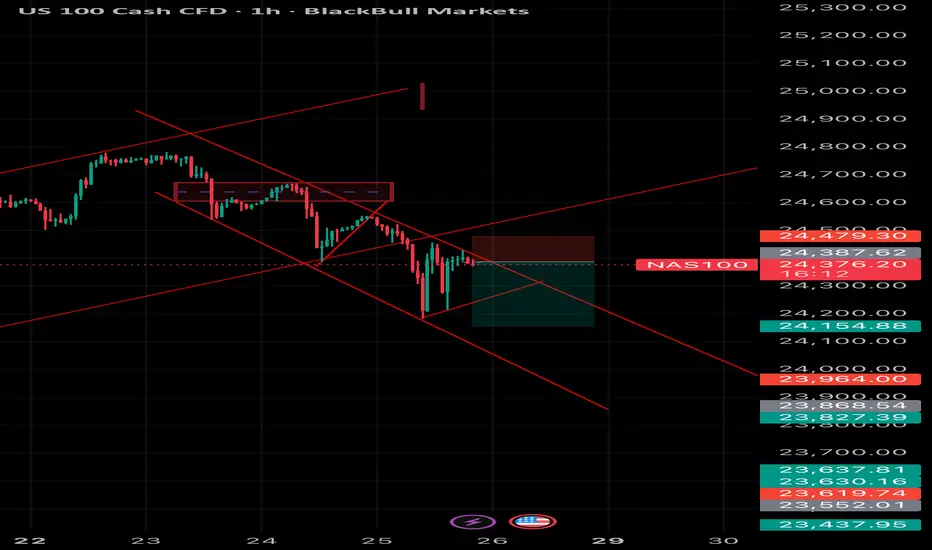
NAS100 Technical Analysis 1 Hour Chart📉 NAS100 Technical Analysis (1H Chart)
NAS100 is trading around 24,374 and continues to respect a strong descending channel, signaling bearish momentum.
• Trend: Price rejected the previous supply zone (24,470 – 24,500) and failed to break above resistance, confirming sellers are still in control.
• Entry Zone: The retest of broken support turned resistance around 24,387 – 24,479 shows bearish rejection with downside continuation likely.
• Target Levels:
• First target: 24,154 (mid-channel support)
• Next target zone: 23,960 – 23,827 (lower channel support)
• Invalidation: A clean 1H close above 24,500 would invalidate this bearish structure and could trigger a corrective move higher.
👉 Short-term bias remains bearish while under 24,500 with room for continuation toward 24,150 – 23,900.
US30 Technical Analysis 1 Hour chart 📉 US30 Technical Analysis (1H Chart)
US30 is currently trading at 45,936 and remains inside a well-defined descending channel, showing strong bearish momentum.
• Trend: Price broke below the previous support (around 46,105 – 46,133) and retested it as resistance, confirming bearish continuation.
• Entry Zone: The rejection candle around the retest zone suggests sellers are still in control.
• Target Levels:
• First support: 45,911
• Next bearish target zone: 45,774 – 45,590 (lower channel support)
• Invalidation: A clean break and 1H close above 46,133 would invalidate the bearish setup and open room for bullish correction.
👉 Bias remains bearish as long as price stays under 46,100. Short-term downside continuation expected toward 45,700 – 45,600.

GBPUSD Short Trade Plan – PRZ in Sight!Today I want to review a short setup on the GBPUSD ( FX:GBPUSD ) pair .
GBPUSD is currently near the Resistance zone($1.360-$1.351) and Support lines .
The question is, can GBPUSD break the Support lines!?
GBPUSD started to decline with a lot of momentum over the past week and this is a good sign for a break of the support lines .
According to Elliott Wave theory , GBPUSD appears to be completing microwave 4 , and given the bearish momentum , we can expect microwave 5 to break the support lines .
I expect GBPUSD to fall at least to the Potential Reversal Zone(PRZ) .
Stop Loss(SL): 1.3600 USD
Please respect each other's ideas and express them politely if you agree or disagree.
British Pound / U.S Dollar Analysis (GBPUSD), 4-hour time frame.
Be sure to follow the updated ideas.
Do not forget to put a Stop loss for your positions (For every position you want to open).
Please follow your strategy and updates; this is just my Idea, and I will gladly see your ideas in this post.
Please do not forget the ✅' like '✅ button 🙏😊 & Share it with your friends; thanks, and Trade safe.

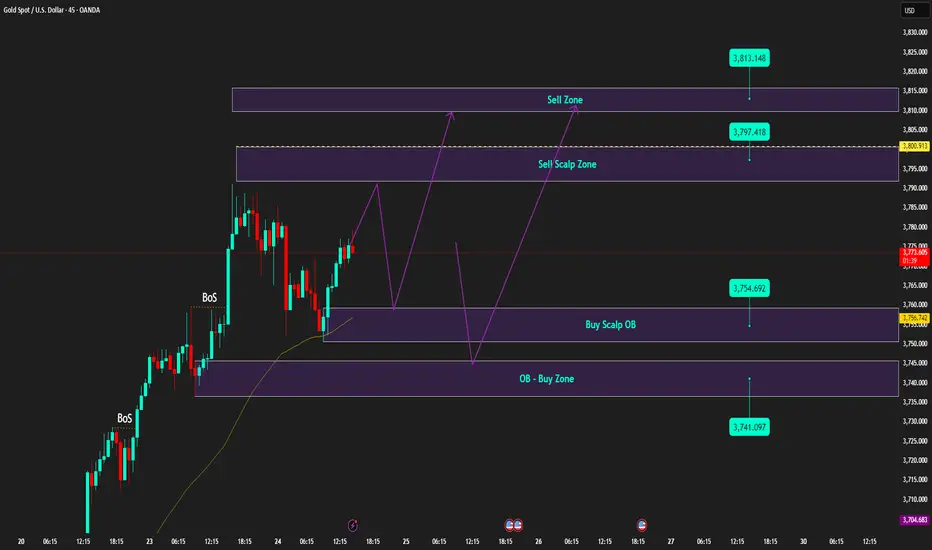
Gold shakes violently | Priority Buy on dip to support🟡 XAU/USD – 24/09 | Captain Vincent ⚓
🔎 Captain’s Log – Context & News
Geopolitics : Trump unexpectedly supported Ukraine reclaiming full territory and called on NATO to be tougher on Russia → defensive sentiment returned, supporting Gold.
US Economy : Housing data due today, no FED speeches.
Earlier: Weak US PMI + dovish FED tone → no momentum for a prolonged downtrend.
Price Action : Gold dropped more than 20 points overnight, then quickly rebounded to 3,76x → likely profit-taking pressure at higher levels.
⏩ Captain’s Summary : Main trend stays bullish, but the voyage will remain choppy as Gold absorbs profit-taking near resistance.
📈 Captain’s Chart – Technical Analysis (M45)
Golden Harbor (Support / Buy Zone)
Buy Scalp OB: 3,754 – 3,757
OB Harbor: 3,741 – 3,744
Storm Breaker (Resistance / Sell Zone)
Sell Scalp Zone: 3,797 – 3,800
Higher Sell Zone: 3,813 – 3,815
Market Structure
After the deep drop, Gold rebounded and held above 3,76x.
Bullish trend remains intact, but waves of volatility may occur near higher resistance zones.
🎯 Captain’s Map – Trade Plan
✅ Buy (priority)
Buy Scalp OB
Entry: 3,754 – 3,757
SL: 3,747
TP: 3,762 – 3,767 – 3,772 – 3,777 – 3,782
Buy Zone OB
Entry: 3,741 – 3,744
SL: 3,732
TP: 3,749 – 3,754 – 3,759 – 3,764 – 3,769
⚡ Sell (short scalp – lower RR)
Sell Scalp Zone
Entry: 3,797 – 3,800
SL: 3,806
TP: 3,795 – 3,790 – 3,785 – 3,780 – 3,775
Higher Sell Zone
Entry: 3,813 – 3,815
SL: 3,823
TP: 3,810 – 3,805 – 3,800 – 3,795 – 3,790
⚓ Captain’s Note
“The Golden ship rocked violently overnight but still anchored firmly at Golden Harbor 🏝️ (3,754 – 3,741) . Profit-taking waves may still rise at Storm Breaker 🌊 (3,797 – 3,815) , suitable for short Quick Boarding 🚤 scalps. Yet the main voyage continues north – Buy the Dip remains the compass to follow the strong winds.”
📢 If you find the Captain’s Log useful, don’t forget to Follow for the latest signals.
💬 Got your own view on Gold? Share it in the comments and join the crew discussion!
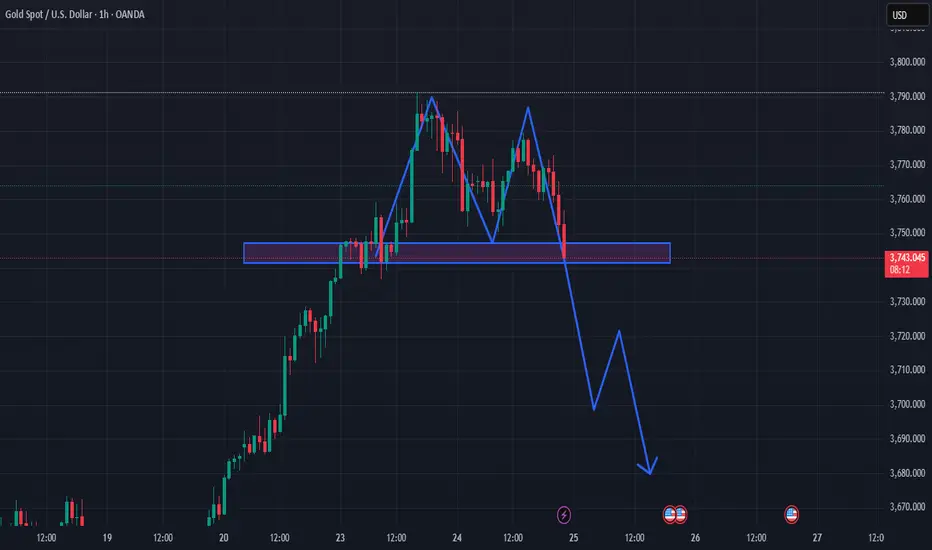
: likely to panic-sell once support breaks, triggering stop-loss1. Price Structure
Previous trend: strong uptrend (from the 20th to the 23rd).
After reaching the ~3,790 peak: the market formed two lower highs → a sign of weakness.
The price is now retesting the key support zone around 3,740 – 3,750 (blue box).
2. Technical Pattern
This looks like a Double Top / variant of Head & Shoulders, signaling a bearish reversal.
The blue box area is the neckline – if broken, the pattern completes and the downtrend scenario has high probability.
3. Price Scenarios
If the 3,740 support breaks decisively:
Price may drop quickly towards 3,700 – 3,710 (nearest support).
Further down, it could retest the 3,670 – 3,680 area, as shown by your blue arrow.
If the 3,740 support holds:
Price could bounce back, forming a sideways consolidation before the next move.
However, the probability of a strong recovery is lower, as buying momentum has weakened.
4. Market Sentiment
Retail traders: likely to panic-sell once support breaks, triggering stop-loss cascades.
Big players / institutions: may take advantage around 3,700 to accumulate again after “stop-loss hunting” retailers.
👉 Conclusion: This is a short-term bearish scenario.
For existing long positions, consider taking profit / protecting capital if support breaks.
For dip buyers, it’s safer to wait for a positive reaction around 3,700 – 3,680.
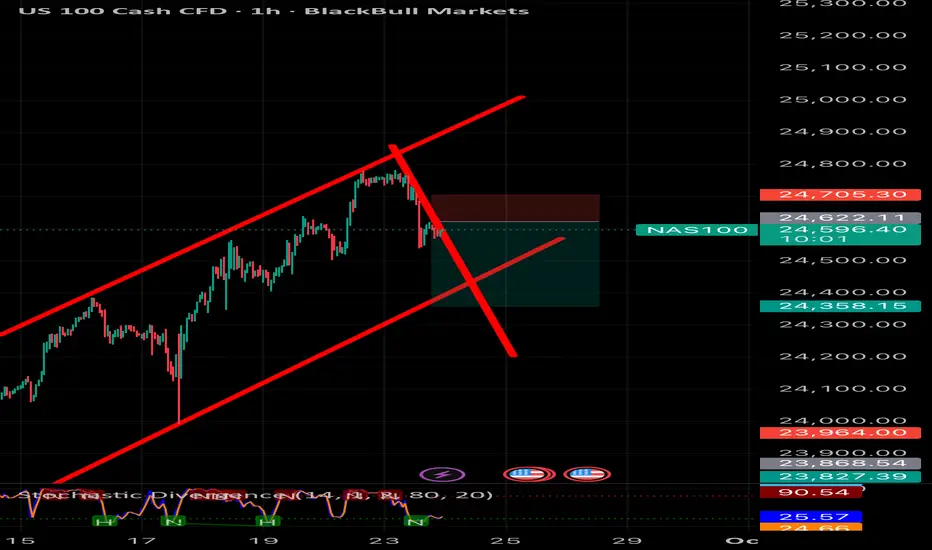
NAS100 rising wedge breakdown short setup The NAS100 recently broke down from a rising wedge formation on the 1H chart, signaling potential bearish momentum. After failing to hold above 24,700, price rejected the upper channel and is now trading below the wedge support.
Here’s my thought process:
• Pattern: Rising wedge, a bearish reversal pattern.
• Rejection Zone: Price failed at 24,705 resistance, confirming sellers stepped in.
• Breakdown Confirmation: A clean break below wedge support increases bearish bias.
XAU/USD: Demand Zone Long Setup After Resistance Rejection ?Technical Analysis Breakdown:
🔹 1. Price Structure:
Strong bullish breakout occurred around 09:00 with a wide-bodied green candle, indicating high buying interest.
Price consolidated in a tight range under resistance (~3,782.996 – 3,784.000), suggesting accumulation or distribution.
Followed by a strong bearish rejection (2 large red candles), confirming a liquidity sweep and rejection from resistance.
🔹 2. Supply & Demand Zones:
Demand Zone: Marked between 3,743.367 and 3,748.000 (highlighted in light blue).
Price previously reacted here and then rallied aggressively—indicating strong buying interest.
Entry Position: Placed slightly above the demand zone, betting on a bounce.
Stop Loss: Below the demand zone (~3,737.837) – to avoid deeper liquidity sweeps.
Take Profit: Near previous resistance/consolidation (~3,759.914).
🔹 3. Candlestick Behavior:
The recent bearish momentum shows a liquidity grab or stop hunt below minor lows before touching the demand zone.
The current candle shows a potential reversal wick, indicating possible buying pressure returning.

Bullish bounce off pullback support?The Aussie (AUD/USD) is falling towards the pivot, which acts as a pullback support and could bounce to the 1st resistance.
Pivot: 0.6544
1st Support: 0.6399
1st Resistance: 0.6794
Disclaimer:
The above opinions given constitute general market commentary, and do not constitute the opinion or advice of IC Markets or any form of personal or investment advice.
Any opinions, news, research, analyses, prices, other information, or links to third-party sites contained on this website are provided on an "as-is" basis, are intended only to be informative, is not an advice nor a recommendation, nor research, or a record of our trading prices, or an offer of, or solicitation for a transaction in any financial instrument and thus should not be treated as such. The information provided does not involve any specific investment objectives, financial situation and needs of any specific person who may receive it. Please be aware, that past performance is not a reliable indicator of future performance and/or results. Past Performance or Forward-looking scenarios based upon the reasonable beliefs of the third-party provider are not a guarantee of future performance. Actual results may differ materially from those anticipated in forward-looking or past performance statements. IC Markets makes no representation or warranty and assumes no liability as to the accuracy or completeness of the information provided, nor any loss arising from any investment based on a recommendation, forecast or any information supplied by any third-party.

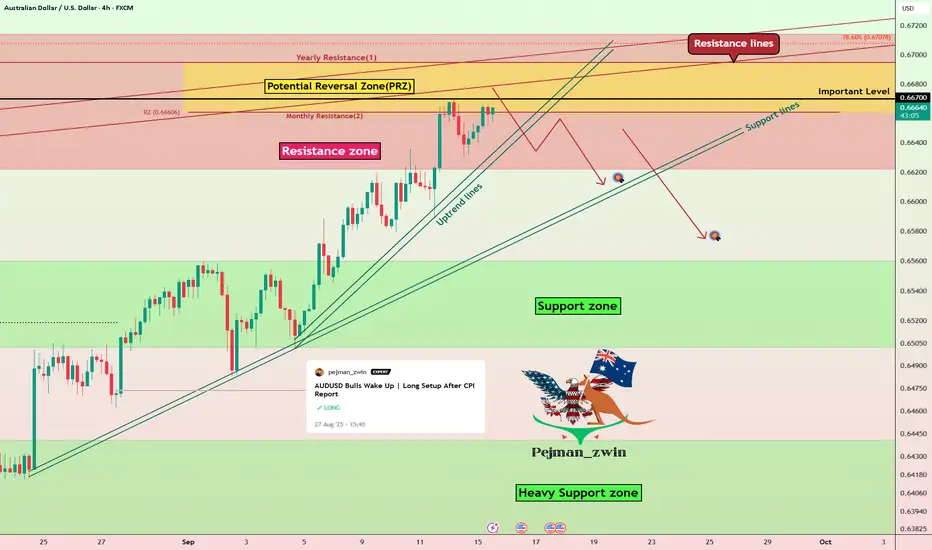
Short Setup on AUDUSD | Key Level at $0.667 TestedToday I want to share with you a Short position on the AUDUSD ( OANDA:AUDUSD ) pair. In the previous idea on AUDUSD, I managed to find the first part of this uptrend rally .
AUDUSD is currently trading in the Resistance zone($0.6714-$0.6622) and Potential Reversal Zone(PRZ) and near the Resistance lines .
Also, one of the reasons why I took this Short position on the AUDUSD pair is that the AUDUSD is approaching $0.667 , which is an important number in previous rallies (in terms of trading volume ) on the daily and weekly time frames.
I expect AUDUSD NOT to break the $0.667 level without a correction (at least), so a drop to $0.6614(First Target) is at least possible .
Second Target: $0.6580
Stop Loss(SL): $0.6723
Please respect each other's ideas and express them politely if you agree or disagree.
Australian Dollar/U.S.Dollar Analyze (AUDUSD), 4-hour time frame.
Be sure to follow the updated ideas.
Do not forget to put a Stop loss for your positions (For every position you want to open).
Please follow your strategy and updates; this is just my Idea, and I will gladly see your ideas in this post.
Please do not forget the ✅' like '✅ button 🙏😊 & Share it with your friends; thanks, and Trade safe.
GBPJPY H1 | Potential bearish drop offGBP/JPY is reacting off the sell entry which has been identified as an overlap resistance and could drop from this level to the downside.
Buy entry is at 199.97, which acts as an overlap resistance.
Stop loss is at 200.70, which is a multi-swing high resistance.
Take profit is at 199.25, which is a pullback support that aligns with the 78.6% Fibonacci retracement.
High Risk Investment Warning
Trading Forex/CFDs on margin carries a high level of risk and may not be suitable for all investors. Leverage can work against you.
Stratos Markets Limited (tradu.com ):
CFDs are complex instruments and come with a high risk of losing money rapidly due to leverage. 65% of retail investor accounts lose money when trading CFDs with this provider. You should consider whether you understand how CFDs work and whether you can afford to take the high risk of losing your money.
Stratos Europe Ltd (tradu.com ):
CFDs are complex instruments and come with a high risk of losing money rapidly due to leverage. 66% of retail investor accounts lose money when trading CFDs with this provider. You should consider whether you understand how CFDs work and whether you can afford to take the high risk of losing your money.
Stratos Global LLC (tradu.com ):
Losses can exceed deposits.
Please be advised that the information presented on TradingView is provided to Tradu (‘Company’, ‘we’) by a third-party provider (‘TFA Global Pte Ltd’). Please be reminded that you are solely responsible for the trading decisions on your account. There is a very high degree of risk involved in trading. Any information and/or content is intended entirely for research, educational and informational purposes only and does not constitute investment or consultation advice or investment strategy. The information is not tailored to the investment needs of any specific person and therefore does not involve a consideration of any of the investment objectives, financial situation or needs of any viewer that may receive it. Kindly also note that past performance is not a reliable indicator of future results. Actual results may differ materially from those anticipated in forward-looking or past performance statements. We assume no liability as to the accuracy or completeness of any of the information and/or content provided herein and the Company cannot be held responsible for any omission, mistake nor for any loss or damage including without limitation to any loss of profit which may arise from reliance on any information supplied by TFA Global Pte Ltd.
The speaker(s) is neither an employee, agent nor representative of Tradu and is therefore acting independently. The opinions given are their own, constitute general market commentary, and do not constitute the opinion or advice of Tradu or any form of personal or investment advice. Tradu neither endorses nor guarantees offerings of third-party speakers, nor is Tradu responsible for the content, veracity or opinions of third-party speakers, presenters or participants.

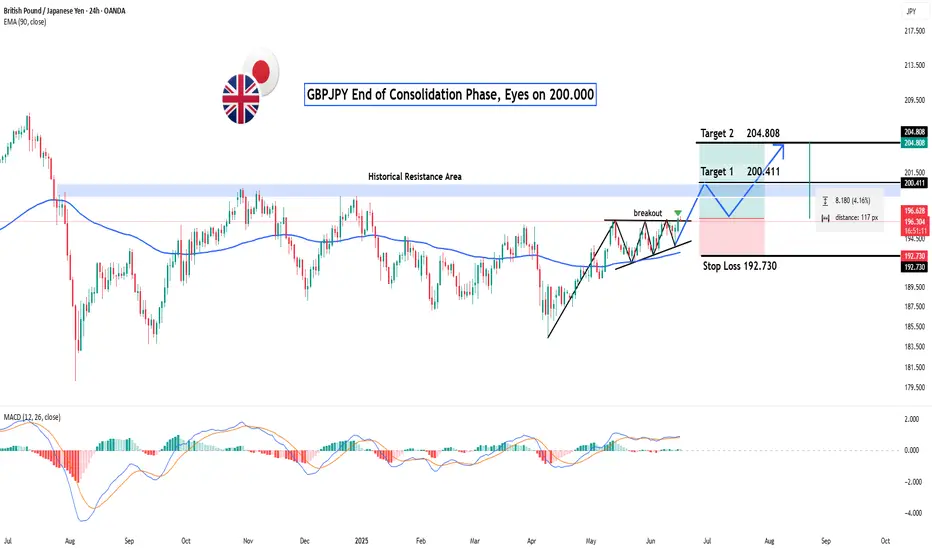
GBPJPY: End of Consolidation Phase, Eyes on 200.000?Hey Realistic Traders!
Could this be the beginning of a major bullish wave ?
Let’s Break It Down..
On the daily timeframe, GBPJPY has formed a Symmetrical Triangle Pattern, followed by a bullish breakout, a classic technical signal that typically marks the end of a consolidation phase and the start of a new bullish trend. This move is further confirmed by the appearance of a strong bullish candlestick, reflecting a surge in buying momentum.
Supporting this bullish scenario, the MACD indicator has also formed a bullish crossover, where the MACD line crosses above the signal line. This crossover is widely regarded as a momentum shift from bearish to bullish, strengthening the case for continued upward movement.
Given these technical signals, the price is likely to advance toward the first target at 200.411, with a potential extension to 204.808.
This bullish outlook remains valid as long as the price holds above the key stop-loss level at 192.730.
Support the channel by engaging with the content, using the rocket button, and sharing your opinions in the comments below.
Disclaimer: "Please note that this analysis is solely for educational purposes and should not be considered a recommendation to take a long or short position on OANDA:GBPJPY ".
XAUUSD – Bullish Bias Targeting Buy-Side LiquidityOn the 1H timeframe, my perspective on Gold (XAUUSD) remains bullish, with the main target being the buy-side liquidity above current price.
Price has recently formed a bullish Fair Value Gap (FVG), which may serve as support and a potential launch point for further upside. If price holds here, we could see continuation toward higher levels. For entry, I’ll be waiting for lower timeframe reaction and confirmation.
However, it’s also important to note the sell-side liquidity resting just below the FVG. There is a possibility that price may first sweep this liquidity, tap into the underlying bullish order block, and then begin the upward move.
For this reason, I am watching two key areas:
1️⃣ The current bullish FVG as initial support.
2️⃣ The deeper bullish order block, should liquidity below be cleared.
In both cases, my bias remains bullish, but execution will depend on LTF confirmation at these zones.
💌It is my honor to share your comments with me💌
🔎 DYOR
💡Wait for the update!

Q3 W38 D16 Y25 Pre NY OutlookQ3 W38 D16 Y25 – Pre-NY Outlook
Today’s chart analysis will focus on:
EURGBP
AUDUSD
GBPUSD
GBPJPY
This is simply a forecast of price action and how I plan to react if and when the market presents opportunities.
Stay disciplined, trade what you see — not what you feel.
FRGNT

gold setup 4h analysis Here’s the simplified view for XAU/USD (Gold) 4H chart you shared:
---
📈 Best Buy Setup
Entry: Above 3,675 – 3,680 (only if price breaks and closes above this resistance).
Stop Loss (SL): Below 3,650.
Take Profit (TP):
TP1 → 3,700
TP2 → 3,720 – 3,730
➡ Reason: Breakout continuation in the uptrend.
---
📉 Best Sell Setup
Entry: If price rejects 3,675 – 3,680 with bearish confirmation candle.
Stop Loss (SL): Above 3,695.
Take Profit (TP):
TP1 → 3,600 – 3,610
TP2 → 3,575 – 3,550 (trendline support).
➡ Reason: Failed breakout → pullback to trendline.
---
🔑 Best option now → Wait for confirmation.
If it breaks up, go long (buy).
If it rejects, go short (sell).
