USDCAD H4 | Heading Into 50% Fibonacci ResistanceMomentum: Bearish
Price is currently moving toward the sell entry level, positioned slightly above the 50% Fibonacci retracement.
Sell Entry: 1.4037
Pullback resistance
Aligned just above the 50% Fibonacci retracement
Stop Loss: 1.4096
Swing high resistance
Positioned slightly below the 78.6% Fibonacci retracement
Take Profit: 1.3982
Strong overlap support
Aligned with the 50% Fibonacci retracement
High Risk Investment Warning
Stratos Markets Limited (tradu.com ), Stratos Europe Ltd (tradu.com ):
CFDs are complex instruments and come with a high risk of losing money rapidly due to leverage. 70% of retail investor accounts lose money when trading CFDs with this provider. You should consider whether you understand how CFDs work and whether you can afford to take the high risk of losing your money.
Stratos Global LLC (tradu.com ): Losses can exceed deposits.
Please be advised that the information presented on TradingView is provided to Tradu (‘Company’, ‘we’) by a third-party provider (‘TFA Global Pte Ltd’). Please be reminded that you are solely responsible for the trading decisions on your account. Any information and/or content is intended entirely for research, educational and informational purposes only and does not constitute investment or consultation advice or investment strategy. The information is not tailored to the investment needs of any specific person and therefore does not involve a consideration of any of the investment objectives, financial situation or needs of any viewer that may receive it. Past performance is not a reliable indicator of future results. Actual results may differ materially from those anticipated in forward-looking or past performance statements. We assume no liability as to the accuracy or completeness of any of the information and/or content provided herein and the Company cannot be held responsible for any omission, mistake nor for any loss or damage including without limitation to any loss of profit which may arise from reliance on any information supplied by TFA Global Pte Ltd.
Forexsignals

EURUSD H4 | Falling Towards Key SupportMomentum: Bullish
The price is currently falling toward the buy entry, which aligns with the 38.2% Fibonacci retracement level. This confluence strengthens the potential for a bullish reaction.
Buy Entry: 1.1583
Strong overlap support
38.2% Fibonacci retracement
Stop Loss: 1.1547
Pullback support
61.8% Fibonacci retracement
Take Profit: 1.1665
Swing-high resistance
High Risk Investment Warning
Stratos Markets Limited (tradu.com ), Stratos Europe Ltd (tradu.com ):
CFDs are complex instruments and come with a high risk of losing money rapidly due to leverage. 70% of retail investor accounts lose money when trading CFDs with this provider. You should consider whether you understand how CFDs work and whether you can afford to take the high risk of losing your money.
Stratos Global LLC (tradu.com ): Losses can exceed deposits.
Please be advised that the information presented on TradingView is provided to Tradu (‘Company’, ‘we’) by a third-party provider (‘TFA Global Pte Ltd’). Please be reminded that you are solely responsible for the trading decisions on your account. Any information and/or content is intended entirely for research, educational and informational purposes only and does not constitute investment or consultation advice or investment strategy. The information is not tailored to the investment needs of any specific person and therefore does not involve a consideration of any of the investment objectives, financial situation or needs of any viewer that may receive it. Past performance is not a reliable indicator of future results. Actual results may differ materially from those anticipated in forward-looking or past performance statements. We assume no liability as to the accuracy or completeness of any of the information and/or content provided herein and the Company cannot be held responsible for any omission, mistake nor for any loss or damage including without limitation to any loss of profit which may arise from reliance on any information supplied by TFA Global Pte Ltd.

EURUSD – Bullish Order Flow Targeting Equal Highs & Old HighHello traders,
On the 4H timeframe, EURUSD continues to show clear bullish order flow, moving consistently from internal liquidity toward external liquidity.
Price is currently reacting to the bullish Fair Value Gap (FVG), and as long as this area holds, I expect continuation to the upside.
📌 Targets:
• 1.16560 – equal highs (first target)
• 1.16688 – old high / draw on liquidity (final target)
The structure is simple:
Price takes internal liquidity → reacts from bullish PD Arrays → seeks external liquidity.
As long as bullish FVG support holds, I remain bullish on EURUSD.
💌It is my honor to share your comments with me💌
🔎 DYOR
💡Wait for the update!

Gold Technical Rebound to FVG, Prioritise WATCHING FOR SELL at 4📊 Market Structure
Gold has completed a strong decline from the peak of 4.21x, leaving consecutive Break of Structure (BoS), confirming a short-term bearish structure.
The drop through the Breakout zone of 4.10x indicates a dominant selling force.
Currently, the price is bouncing from the Premium Zone 4.05x, aligning with the technical rebound behaviour after a strong sell-off.
The BUY side is merely pulling the price back to the abandoned liquidity zones (FVG 4.12x – 4.15x) before the SELL side can regain control.
The upper FVG zone is where the price often returns to fill after a steep fall. This is also the confluence zone between:
FVG (Fair Value Gap)
Old candle body Breaker
Fibonacci Premium
→ The risk of selling at these zones is very high.
💎 Key Technical Zones
Rebound zone for Sell
FVG 1: 4.101 – 4.126
FVG 2 (Strong Confluence): 4.126 – 4.150
Support zone – target to hit
Premium Zone $$$: 4.050 – 4.052
Lower FVG: 4.030 – 4.035
High probability price scenario: Rebound to FVG → reaction → continue to decline to 4.03x.
🎯 Trading Plan – Prioritise SELL
1️⃣ SELL Setup – High Probability
Wait for price to rebound to the above FVG zones:
Entry SELL:
4.118 – 4.126
Can add orders at higher: 4.140 – 4.150
Stop-loss: above 4.158
TP1: 4.101
TP2: 4.050
TP3: 4.030
✔️ This is a trend-following setup, selling at premium, adhering to SMC principles.
✔️ The current price is just beginning the rebound, not yet meeting BUY conditions.
2️⃣ BUY Setup – Only activate on deep Discount
Entry BUY: 4.030 – 4.035 (Lower FVG)
SL: below 4.020
TP: 4.070 – 4.100
→ BUY is only for counter-trend traders and must wait for a clear discount.
🧠 Vincent’s View
The market is in a distribution – decline phase, every rebound aims to pull liquidity.
As long as the price does not close above 4.150, SELL remains the optimal strategy for the day.
Observe closely when the price hits 4.12x – 4.15x, this is a “high-risk” zone for the BUY side and a “great opportunity” for the SELL side.
“Sell where the liquidity lives — that’s where institutions strike.” ⚜️
⏰ Timeframe: 1H
📅 Update: 17/11/2025
✍️ Analysis by: Captain Vincent

Hellena | GOLD (4H): LONG to resistance area of 4382.Colleagues, in the last forecast I made a markup of corrective movement (ABC), but the price broke important resistance levels and it means that the price is still in the impulse, namely in the wave “5” of higher order and wave “3” of medium order.
I believe that soon we will see a correction in wave “4”, then an upward movement to the resistance area of 4382.
The correction in wave “4” may reach the support area of 4075, but I still recommend to work with pending orders and look out for long positions.
Fundamental context
The gold market continues to benefit from favourable conditions: demand for safe-haven assets is increasing amid global uncertainty and a weaker US dollar. At the same time, central banks’ purchases of gold remain at record highs, providing a strong structural base for further upside. Despite the recent pullback, the key drivers — low real interest rates and reserve-diversification efforts — remain intact.
Manage your capital correctly and competently! Only enter trades based on reliable patterns!

EUR/USD Breakout Setup Toward 1.16000EUR/USD is trading within an ascending channel, showing multiple breakouts and strong support bounces along the trend line. Price has recently touched the upper resistance and is now expected to pull back, with a potential downside target around 1.16000 if the trend-line break occurs.

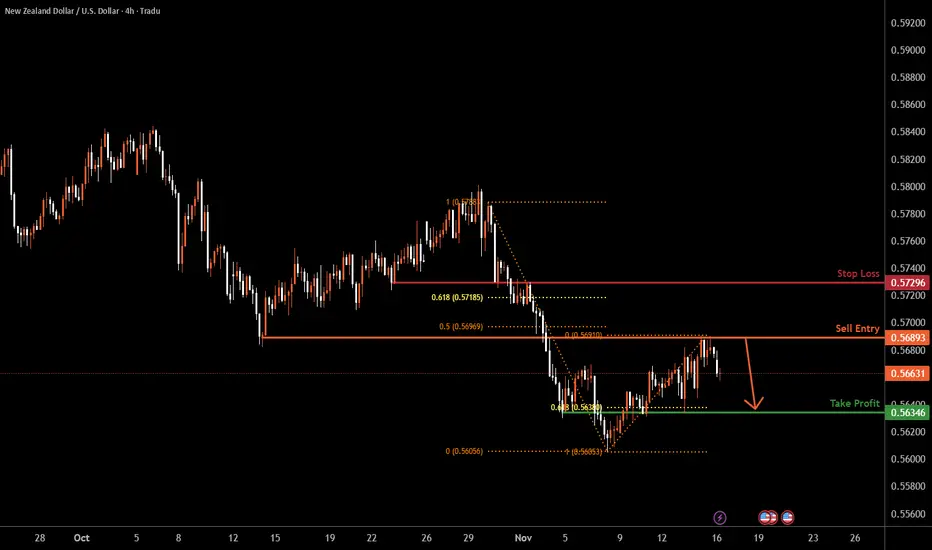
NZDUSD H4 | Bearish Drop OffMomentum: Bearish
The price has rejected the sell entry level, which sits slightly below the 50% Fibonacci retracement.
Sell Entry: 0.4589
Pullback resistance
Positioned slightly below the 50% Fibonacci retracement
Stop Loss: 0.5729
Pullback resistance
Placed slightly above the 61.8% Fibonacci retracement
Take Profit: 0.5634
Strong pullback support
Aligned with the 61.8% Fibonacci retracement
High Risk Investment Warning
Stratos Markets Limited (tradu.com ), Stratos Europe Ltd (tradu.com ):
CFDs are complex instruments and come with a high risk of losing money rapidly due to leverage. 70% of retail investor accounts lose money when trading CFDs with this provider. You should consider whether you understand how CFDs work and whether you can afford to take the high risk of losing your money.
Stratos Global LLC (tradu.com ): Losses can exceed deposits.
Please be advised that the information presented on TradingView is provided to Tradu (‘Company’, ‘we’) by a third-party provider (‘TFA Global Pte Ltd’). Please be reminded that you are solely responsible for the trading decisions on your account. Any information and/or content is intended entirely for research, educational and informational purposes only and does not constitute investment or consultation advice or investment strategy. The information is not tailored to the investment needs of any specific person and therefore does not involve a consideration of any of the investment objectives, financial situation or needs of any viewer that may receive it. Past performance is not a reliable indicator of future results. Actual results may differ materially from those anticipated in forward-looking or past performance statements. We assume no liability as to the accuracy or completeness of any of the information and/or content provided herein and the Company cannot be held responsible for any omission, mistake nor for any loss or damage including without limitation to any loss of profit which may arise from reliance on any information supplied by TFA Global Pte Ltd.
Potential bearish drop?WTI Oil (XTI/USD) has rejected off the pivot and could drop to the 1st support which acts as a swing high resistance.
Pivot: 62.22
1st Support: 54.92
1st Resistance: 65.94
Disclaimer:
The opinions given above constitute general market commentary and do not constitute the opinion or advice of IC Markets or any form of personal or investment advice.
Any opinions, news, research, analyses, prices, other information, or links to third-party sites contained on this website are provided on an "as-is" basis, are intended to be informative only, and are not advice, a recommendation, research, a record of our trading prices, an offer of, or solicitation for, a transaction in any financial instrument and thus should not be treated as such. The information provided does not involve any specific investment objectives, financial situation, or needs of any specific person who may receive it. Please be aware that past performance is not a reliable indicator of future performance and/or results. Past performance or forward-looking scenarios based upon the reasonable beliefs of the third-party provider are not a guarantee of future performance. Actual results may differ materially from those anticipated in forward-looking or past performance statements. IC Markets makes no representation or warranty and assumes no liability as to the accuracy or completeness of the information provided, nor any loss arising from any investment based on a recommendation, forecast, or any information supplied by any third party.

Bullish bounce off key support?Loonie (USD/CAD) is falling towards the pivot which has been identified as an overlap support and could bounce to the 1st resistance.
Pivot: 1.3920
1st Support: 1.3752
1st Resistance: 1.4138
Disclaimer:
The opinions given above constitute general market commentary and do not constitute the opinion or advice of IC Markets or any form of personal or investment advice.
Any opinions, news, research, analyses, prices, other information, or links to third-party sites contained on this website are provided on an "as-is" basis, are intended to be informative only, and are not advice, a recommendation, research, a record of our trading prices, an offer of, or solicitation for, a transaction in any financial instrument and thus should not be treated as such. The information provided does not involve any specific investment objectives, financial situation, or needs of any specific person who may receive it. Please be aware that past performance is not a reliable indicator of future performance and/or results. Past performance or forward-looking scenarios based upon the reasonable beliefs of the third-party provider are not a guarantee of future performance. Actual results may differ materially from those anticipated in forward-looking or past performance statements. IC Markets makes no representation or warranty and assumes no liability as to the accuracy or completeness of the information provided, nor any loss arising from any investment based on a recommendation, forecast, or any information supplied by any third party.

Bullish momentum to extend?USD/JPY has already bounced off the pivot, which is a pullback support and could rise to the 1st resistance which is a swing high resistance.
Pivot: 153.07
1st Support: 150.80
1st Resistance: 158.44
Disclaimer:
The opinions given above constitute general market commentary and do not constitute the opinion or advice of IC Markets or any form of personal or investment advice.
Any opinions, news, research, analyses, prices, other information, or links to third-party sites contained on this website are provided on an "as-is" basis, are intended to be informative only, and are not advice, a recommendation, research, a record of our trading prices, an offer of, or solicitation for, a transaction in any financial instrument and thus should not be treated as such. The information provided does not involve any specific investment objectives, financial situation, or needs of any specific person who may receive it. Please be aware that past performance is not a reliable indicator of future performance and/or results. Past performance or forward-looking scenarios based upon the reasonable beliefs of the third-party provider are not a guarantee of future performance. Actual results may differ materially from those anticipated in forward-looking or past performance statements. IC Markets makes no representation or warranty and assumes no liability as to the accuracy or completeness of the information provided, nor any loss arising from any investment based on a recommendation, forecast, or any information supplied by any third party.

Bearish continuation setup?Kiwi (NZD/USD) is rising towards the pivot and could reverse to the 1st support, which has been identified as a pullback support.
Pivot: 0.5719
1st Support: 0.5596
1st Resistance: 0.5793
Disclaimer:
The opinions given above constitute general market commentary and do not constitute the opinion or advice of IC Markets or any form of personal or investment advice.
Any opinions, news, research, analyses, prices, other information, or links to third-party sites contained on this website are provided on an "as-is" basis, are intended to be informative only, and are not advice, a recommendation, research, a record of our trading prices, an offer of, or solicitation for, a transaction in any financial instrument and thus should not be treated as such. The information provided does not involve any specific investment objectives, financial situation, or needs of any specific person who may receive it. Please be aware that past performance is not a reliable indicator of future performance and/or results. Past performance or forward-looking scenarios based upon the reasonable beliefs of the third-party provider are not a guarantee of future performance. Actual results may differ materially from those anticipated in forward-looking or past performance statements. IC Markets makes no representation or warranty and assumes no liability as to the accuracy or completeness of the information provided, nor any loss arising from any investment based on a recommendation, forecast, or any information supplied by any third party.

Bearish reversal off pullback resistance?Cable (GBP?USD) is rising towards the pivot, which acts as a pullback resistance that aligns with the 50% Fibonacci retracement and could reverse to the 1st support which is an overlap support.
Pivot: 1.3345
1st Support: 1.3038
1st Reistance: 1.3581
Disclaimer:
The opinions given above constitute general market commentary and do not constitute the opinion or advice of IC Markets or any form of personal or investment advice.
Any opinions, news, research, analyses, prices, other information, or links to third-party sites contained on this website are provided on an "as-is" basis, are intended to be informative only, and are not advice, a recommendation, research, a record of our trading prices, an offer of, or solicitation for, a transaction in any financial instrument and thus should not be treated as such. The information provided does not involve any specific investment objectives, financial situation, or needs of any specific person who may receive it. Please be aware that past performance is not a reliable indicator of future performance and/or results. Past performance or forward-looking scenarios based upon the reasonable beliefs of the third-party provider are not a guarantee of future performance. Actual results may differ materially from those anticipated in forward-looking or past performance statements. IC Markets makes no representation or warranty and assumes no liability as to the accuracy or completeness of the information provided, nor any loss arising from any investment based on a recommendation, forecast, or any information supplied by any third party.

Bullish bounce off?EUR/USD is falling towards the pivot and could bounce to the 1st resistance.
Pivot: 1.1520
1st Support: 1.1370
1st Resistance: 1.1799
Disclaimer:
The opinions given above constitute general market commentary and do not constitute the opinion or advice of IC Markets or any form of personal or investment advice.
Any opinions, news, research, analyses, prices, other information, or links to third-party sites contained on this website are provided on an "as-is" basis, are intended to be informative only, and are not advice, a recommendation, research, a record of our trading prices, an offer of, or solicitation for, a transaction in any financial instrument and thus should not be treated as such. The information provided does not involve any specific investment objectives, financial situation, or needs of any specific person who may receive it. Please be aware that past performance is not a reliable indicator of future performance and/or results. Past performance or forward-looking scenarios based upon the reasonable beliefs of the third-party provider are not a guarantee of future performance. Actual results may differ materially from those anticipated in forward-looking or past performance statements. IC Markets makes no representation or warranty and assumes no liability as to the accuracy or completeness of the information provided, nor any loss arising from any investment based on a recommendation, forecast, or any information supplied by any third party.

EUR/USD – Falling Wedge Breakout | Bulls Eye Key Resistance ZoneTICKMILL:EURUSD The EUR/USD Pair , Price has been trading within a Wedge Pattern on the H1 chart, forming consistent higher highs and higher lows. Price action is now testing the upper boundary of the Pattern, signalling a possible breakout.
✅Market Context:
1️⃣Strong Upward Structure Inside the Pattern.
2️⃣Buyers are showing strength near Resistance.
3️⃣Breakout above the Trendline indicates Momentum continuation toward higher zones.
✅Trade Plan:
Entry: Buy after Confirmed Breakout above the Resistance (H1 candle close above trendline or retest of the breakout).
💰Take Profit (TP): At the Key Zone – a Major Resistance area identified ahead.
🛑Stop Loss (SL): Below the Pattern Structure.
🟢 Technical Outlook:
Pattern: Falling Wedge (Bullish Reversal)
Confirmation: Breakout & Retest
Targets: 1.1650 → 1.1770
Support Zone: 1.1500 – 1.1450
Momentum: Bullish bias gaining strength
✅Psychological Discipline :
1️⃣Stick to plan – No Revenge Trades.
2️⃣Accept losing trades as Part of the Strategy.
3️⃣Risk only 1–2% of your account balance per trade.
📊 Fundamental View:
The Euro is gaining momentum after recent comments from ECB officials indicating cautious optimism around inflation stability. Meanwhile, the USD faces mild pressure as traders anticipate possible rate cuts by the Federal Reserve in the coming months. Market sentiment currently favors risk assets, giving EUR/USD short-term upside potential.
✅ Support this analysis with a
LIKE 👍 | COMMENT 💬 | FOLLOW 🔔
It helps a lot & keeps the ideas coming!
⚠️ Disclaimer: This analysis is for educational purposes only and does not constitute financial advice. Forex trading involves high risk. Trade only with capital you can afford to lose and always do your own research.

Bullish bounce off key support?The US Dollar Index (DXY) is declining toward the pivot level and may rebound toward the 1st resistance.
Pivot: 98.67
1st Support: 97.85
1st Resistance: 100.07
Disclaimer:
The opinions given above constitute general market commentary and do not constitute the opinion or advice of IC Markets or any form of personal or investment advice.
Any opinions, news, research, analyses, prices, other information, or links to third-party sites contained on this website are provided on an "as-is" basis, are intended to be informative only, and are not advice, a recommendation, research, a record of our trading prices, an offer of, or solicitation for, a transaction in any financial instrument and thus should not be treated as such. The information provided does not involve any specific investment objectives, financial situation, or needs of any specific person who may receive it. Please be aware that past performance is not a reliable indicator of future performance and/or results. Past performance or forward-looking scenarios based upon the reasonable beliefs of the third-party provider are not a guarantee of future performance. Actual results may differ materially from those anticipated in forward-looking or past performance statements. IC Markets makes no representation or warranty and assumes no liability as to the accuracy or completeness of the information provided, nor any loss arising from any investment based on a recommendation, forecast, or any information supplied by any third party.

BTCUSD – 1D FVG Retest Completed | BTC is showing classic bearish continuation structure after failing to reclaim the 1D Fair Value Gap (FVG) and rejecting cleanly from the imbalance zone.
Price is now sitting just above the key support around $92,825, and this level is acting as the final line before a larger macro sell-off begins.
📌 Key Points From the Chart
1️⃣ 1D FVG Rejection (Primary Bearish Signal)
Price tapped directly into the purple 1D FVG, showing a wick-to-wick mitigation.
The rejection from this area confirms:
✔️ Smart Money filling inefficiency
✔️ No bullish displacement
✔️ Supply still in full control
This is a textbook continuation pattern in a downtrend.
2️⃣ $92,825 – Last Support Before Breakdown
This level has been tested multiple times, making it both:
➡️ Major psychological level
➡️ Short-term liquidity pool
If price holds below this zone → bearish momentum accelerates.
3️⃣ Liquidity Sweeps Expected Before Breakdown
The projected path shows:
A slight push up into local liquidity
Quick rejection
Break of structure
Continuation towards macro demand
This pattern often appears before strong dumps.
4️⃣ HTF Trend Still Bearish
Both structure and momentum indicate:
🔻 Lower highs
🔻 Lower lows
🔻 No bullish displacement
🔻 No HTF demand breakup
BTC remains in a distribution / markdown phase.
5️⃣ Next Macro Target → $86,145
This is where:
✔️ HTF liquidity rests
✔️ Major demand zone sits
✔️ Previous inefficiency aligns
This level is extremely attractive for Smart Money.
📉 Summary
BTC remains bearish unless bulls break back above the 1D FVG.
Rejecting from imbalance + losing $92,825 = clear path towards $86,145.

USDJPY | Breakout Retest → Targeting Major Supply Zone (157.80)USDJPY has confirmed a strong bullish continuation structure on the daily timeframe after breaking above the key resistance zone around 153.50 – 154.30.
This level has now flipped into a fresh demand zone, acting as a valid retest area for continuation.
🔍 Why This Move Matters:
Daily Break of Structure (BOS): Bullish market structure remains intact
Demand Retest: Price tapped into the previous breakout zone (153.50–154.30)
Liquidity Shift: Sell-side liquidity taken → Buy-side liquidity now targeted
Higher Timeframe Trend: Strongly bullish since October; aggressive momentum
🎯 Upside Targets:
154.30 → First continuation objective (already tapped)
157.80 → Major supply zone + HTF liquidity cluster
158.00 → Top of weekly supply
Price is likely to accumulate above 154.30 and build higher lows before pushing toward the 157.80 supply block.
📈 Bullish Scenario:
If price holds above 153.50, continuation toward 157.80 remains highly probable.
Market structure indicates trend continuation, not reversal.
📚 Concepts Used:
Market Structure | BOS | Liquidity | HTF Zones | Demand/Supply Flip | Trend Continuation | FX Macro Trend

XAUUSD | Rejection From Premium Zone — Targeting Sell-Side LiqGold has pulled into a premium retracement zone (0.5–0.618 Fib) aligning perfectly with the Daily Wick 50% + previous structure flip level (4,122 zone).
This zone acted as a strong supply block, causing an immediate reaction, confirming bearish order flow.
Price is currently forming distribution under the premium zone, signaling potential continuation downward.
🔍 Detailed Breakdown:
HTF Bias: Bearish below 4,122
Retracement: Into 0.5–0.618 Fib + Daily Wick 50%
Zone of Interest: 4,122 – 4,110 (strong rejection zone)
Current Structure: Lower highs forming → distribution
Liquidity Targets:
4,027 (first liquidity pocket)
4,005 (major sell-side liquidity)
4,000 – 3,995 (extended target if momentum accelerates)
📉 Bearish Confirmation:
A clean rejection from the premium zone + multiple liquidity sweeps at the top indicates smart money shifting direction.
📌 What I’m Watching:
If XAU retests the 4,110–4,122 zone and fails to break above structure →
Expecting a clean sell-off into sell-side liquidity levels.
📚 Concepts Used: Liquidity | Imbalance | SMC | Premium vs Discount | Fib Retracement | Market Structure Shift

US100 | Bullish Reversal From Demand Zone — Targeting 25,200 LiqUS100 has reacted strongly from the 24,400–24,900 major demand zone, showing a sharp rejection and reclaiming structure. Price is now building momentum toward the 25,200 buy-side liquidity level.
A clean consolidation + breakout pattern is forming just below liquidity, indicating potential continuation to the upside.
Market Breakdown:
HTF Bias: Bullish
Demand Zone: 24,400 – 24,900
Intraday Target: 25,201 liquidity zone
Extended Target: 25,722 (major buy-side liquidity)
Confirmation: Break & retest above 25,100
Invalidation: Clean break below 24,950

GBPJPY M30 | Bearish Reversal Off Key ResistanceMomentum: Bearish
Price is currently moving toward the sell entry level, which aligns with the 50% Fibonacci retracement, a key technical factor reinforcing the bearish setup.
Sell Entry: 203.47
Strong overlap resistance
50% Fibonacci retracement alignment
Stop Loss: 203.99
Positioned above the swing-high resistance
Take Profit: 202.89
Strong pullback support zone
High Risk Investment Warning
Stratos Markets Limited (tradu.com ), Stratos Europe Ltd (tradu.com ):
CFDs are complex instruments and come with a high risk of losing money rapidly due to leverage. 70% of retail investor accounts lose money when trading CFDs with this provider. You should consider whether you understand how CFDs work and whether you can afford to take the high risk of losing your money.
Stratos Global LLC (tradu.com ): Losses can exceed deposits.
Please be advised that the information presented on TradingView is provided to Tradu (‘Company’, ‘we’) by a third-party provider (‘TFA Global Pte Ltd’). Please be reminded that you are solely responsible for the trading decisions on your account. Any information and/or content is intended entirely for research, educational and informational purposes only and does not constitute investment or consultation advice or investment strategy. The information is not tailored to the investment needs of any specific person and therefore does not involve a consideration of any of the investment objectives, financial situation or needs of any viewer that may receive it. Past performance is not a reliable indicator of future results. Actual results may differ materially from those anticipated in forward-looking or past performance statements. We assume no liability as to the accuracy or completeness of any of the information and/or content provided herein and the Company cannot be held responsible for any omission, mistake nor for any loss or damage including without limitation to any loss of profit which may arise from reliance on any information supplied by TFA Global Pte Ltd.

USDCHF H4 | Bullish Reversal Off Key SupportMomentum: Bearish
The price is reacting off the buy entry, which has been identified as an overlap support level.
Buy Entry: 0.7982
Strong overlap support
Stop Loss: 0.7933
Pullback support
Positioned slightly above the 78.6% Fibonacci retracement
Take Profit: 0.8067
Pullback resistance
Positioned slightly above the 50% Fibonacci retracement
Stratos Markets Limited (tradu.com ), Stratos Europe Ltd (tradu.com ):
CFDs are complex instruments and come with a high risk of losing money rapidly due to leverage. 70% of retail investor accounts lose money when trading CFDs with this provider. You should consider whether you understand how CFDs work and whether you can afford to take the high risk of losing your money.
Stratos Global LLC (tradu.com ): Losses can exceed deposits.
Please be advised that the information presented on TradingView is provided to Tradu (‘Company’, ‘we’) by a third-party provider (‘TFA Global Pte Ltd’). Please be reminded that you are solely responsible for the trading decisions on your account. Any information and/or content is intended entirely for research, educational and informational purposes only and does not constitute investment or consultation advice or investment strategy. The information is not tailored to the investment needs of any specific person and therefore does not involve a consideration of any of the investment objectives, financial situation or needs of any viewer that may receive it. Past performance is not a reliable indicator of future results. Actual results may differ materially from those anticipated in forward-looking or past performance statements. We assume no liability as to the accuracy or completeness of any of the information and/or content provided herein and the Company cannot be held responsible for any omission, mistake nor for any loss or damage including without limitation to any loss of profit which may arise from reliance on any information supplied by TFA Global Pte Ltd.

Aussie H4 | Could We See A Reversal From Here?Momentum: Bearish
The price is moving upward toward the sell entry, which is positioned slightly below the 78.6% Fibonacci retracement, adding significant strength to this resistance level.
Sell Entry: 0.6572
Pullback resistance
Slightly below the 78.6% Fibonacci retracement
Stop Loss: 0.6619
Multi swing high resistance
Take Profit: 0.6517
Overlap support
High Risk Investment Warning
Stratos Markets Limited (tradu.com ), Stratos Europe Ltd (tradu.com ):
CFDs are complex instruments and come with a high risk of losing money rapidly due to leverage. 70% of retail investor accounts lose money when trading CFDs with this provider. You should consider whether you understand how CFDs work and whether you can afford to take the high risk of losing your money.
Stratos Global LLC (tradu.com ): Losses can exceed deposits.
Please be advised that the information presented on TradingView is provided to Tradu (‘Company’, ‘we’) by a third-party provider (‘TFA Global Pte Ltd’). Please be reminded that you are solely responsible for the trading decisions on your account. Any information and/or content is intended entirely for research, educational and informational purposes only and does not constitute investment or consultation advice or investment strategy. The information is not tailored to the investment needs of any specific person and therefore does not involve a consideration of any of the investment objectives, financial situation or needs of any viewer that may receive it. Past performance is not a reliable indicator of future results. Actual results may differ materially from those anticipated in forward-looking or past performance statements. We assume no liability as to the accuracy or completeness of any of the information and/or content provided herein and the Company cannot be held responsible for any omission, mistake nor for any loss or damage including without limitation to any loss of profit which may arise from reliance on any information supplied by TFA Global Pte Ltd.

ETH Support Bounce With Target at 3250Ethereum is trading above a key support level after a strong downward move. Price is showing early signs of a potential bullish correction, with projections pointing toward a possible recovery target around $3250. A break above minor resistance could confirm upward momentum.
