EURUSDHello Traders! 👋
What are your thoughts on EURUSD?
The pair is moving within an ascending channel, but after reaching a resistance zone, it has entered a corrective phase.
We expect the correction and sideways range to continue until the price reaches the support area.
From there, a bullish reaction could trigger the next upward move toward higher resistance levels.
As long as EUR/USD trades inside the channel and above the support, the bullish outlook remains valid.
Don’t forget to like and share your thoughts in the comments! ❤️
Forexsignals

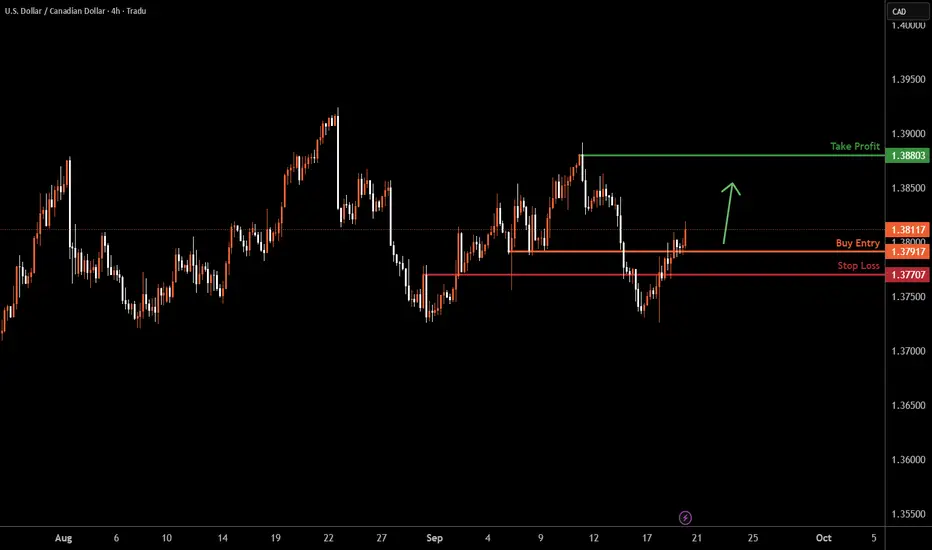
USDCAD H4 | Bullish reversalUSD/CAD has bounced off the buy entry which is an overlap support and could rise from this leve to the upside.
Buy entry is at 1.3791, which is a pullback support.
Stop loss is at 1.3770, whichis a pullback support.
Take profit is at 1.3880, which acts as a swing high resistance.
High Risk Investment Warning
Trading Forex/CFDs on margin carries a high level of risk and may not be suitable for all investors. Leverage can work against you.
Stratos Markets Limited (tradu.com ):
CFDs are complex instruments and come with a high risk of losing money rapidly due to leverage. 65% of retail investor accounts lose money when trading CFDs with this provider. You should consider whether you understand how CFDs work and whether you can afford to take the high risk of losing your money.
Stratos Europe Ltd (tradu.com ):
CFDs are complex instruments and come with a high risk of losing money rapidly due to leverage. 66% of retail investor accounts lose money when trading CFDs with this provider. You should consider whether you understand how CFDs work and whether you can afford to take the high risk of losing your money.
Stratos Global LLC (tradu.com ):
Losses can exceed deposits.
Please be advised that the information presented on TradingView is provided to Tradu (‘Company’, ‘we’) by a third-party provider (‘TFA Global Pte Ltd’). Please be reminded that you are solely responsible for the trading decisions on your account. There is a very high degree of risk involved in trading. Any information and/or content is intended entirely for research, educational and informational purposes only and does not constitute investment or consultation advice or investment strategy. The information is not tailored to the investment needs of any specific person and therefore does not involve a consideration of any of the investment objectives, financial situation or needs of any viewer that may receive it. Kindly also note that past performance is not a reliable indicator of future results. Actual results may differ materially from those anticipated in forward-looking or past performance statements. We assume no liability as to the accuracy or completeness of any of the information and/or content provided herein and the Company cannot be held responsible for any omission, mistake nor for any loss or damage including without limitation to any loss of profit which may arise from reliance on any information supplied by TFA Global Pte Ltd.
The speaker(s) is neither an employee, agent nor representative of Tradu and is therefore acting independently. The opinions given are their own, constitute general market commentary, and do not constitute the opinion or advice of Tradu or any form of personal or investment advice. Tradu neither endorses nor guarantees offerings of third-party speakers, nor is Tradu responsible for the content, veracity or opinions of third-party speakers, presenters or participants.
NZDUSD H4 | Potential bearish dropThe Kiwi (NZD/USD) has reacted off the sell entry and could drop from this level to the downside.
Sell entry is at 0.5909, which is an overlap resistance.
Stop loss is at 0.5949, which is a pullback resistance.
Take profit is at 0.5805, which is a swing low support.
High Risk Investment Warning
Trading Forex/CFDs on margin carries a high level of risk and may not be suitable for all investors. Leverage can work against you.
Stratos Markets Limited (tradu.com ):
CFDs are complex instruments and come with a high risk of losing money rapidly due to leverage. 65% of retail investor accounts lose money when trading CFDs with this provider. You should consider whether you understand how CFDs work and whether you can afford to take the high risk of losing your money.
Stratos Europe Ltd (tradu.com ):
CFDs are complex instruments and come with a high risk of losing money rapidly due to leverage. 66% of retail investor accounts lose money when trading CFDs with this provider. You should consider whether you understand how CFDs work and whether you can afford to take the high risk of losing your money.
Stratos Global LLC (tradu.com ):
Losses can exceed deposits.
Please be advised that the information presented on TradingView is provided to Tradu (‘Company’, ‘we’) by a third-party provider (‘TFA Global Pte Ltd’). Please be reminded that you are solely responsible for the trading decisions on your account. There is a very high degree of risk involved in trading. Any information and/or content is intended entirely for research, educational and informational purposes only and does not constitute investment or consultation advice or investment strategy. The information is not tailored to the investment needs of any specific person and therefore does not involve a consideration of any of the investment objectives, financial situation or needs of any viewer that may receive it. Kindly also note that past performance is not a reliable indicator of future results. Actual results may differ materially from those anticipated in forward-looking or past performance statements. We assume no liability as to the accuracy or completeness of any of the information and/or content provided herein and the Company cannot be held responsible for any omission, mistake nor for any loss or damage including without limitation to any loss of profit which may arise from reliance on any information supplied by TFA Global Pte Ltd.
The speaker(s) is neither an employee, agent nor representative of Tradu and is therefore acting independently. The opinions given are their own, constitute general market commentary, and do not constitute the opinion or advice of Tradu or any form of personal or investment advice. Tradu neither endorses nor guarantees offerings of third-party speakers, nor is Tradu responsible for the content, veracity or opinions of third-party speakers, presenters or participants.

NZDJPY: Oversold Market Confirmed 🇳🇿🇯🇵
There is a high chance that NZDJPY will pullback from the
underlined horizontal daily demand zone.
A formation of a bullish imbalance candle on an hourly time frame
suggests a strong buying pressure from that.
Goal - 83.3
❤️Please, support my work with like, thank you!❤️
I am part of Trade Nation's Influencer program and receive a monthly fee for using their TradingView charts in my analysis.

AUDUSD H4 | Falling towards major supportThe Aussie (AUD/USD) is falling towards the buy entry which is a pullback support that aligns with the 61.8% and the 50% Fibonacci retracement and could bounce from this levl to the take profit.
Buy entr yis at 0.6567, which is a pullback support that aligns with the 61.8% and the 50% Fibonacci retracement.
Stop loss is sy 0.6511, which hs a pullback support that is slightly below the 61.8% FIbonacci retracement.
Take profit is at 0.6636, which is a pullback resistance.
High Risk Investment Warning
Trading Forex/CFDs on margin carries a high level of risk and may not be suitable for all investors. Leverage can work against you.
Stratos Markets Limited (tradu.com ):
CFDs are complex instruments and come with a high risk of losing money rapidly due to leverage. 65% of retail investor accounts lose money when trading CFDs with this provider. You should consider whether you understand how CFDs work and whether you can afford to take the high risk of losing your money.
Stratos Europe Ltd (tradu.com ):
CFDs are complex instruments and come with a high risk of losing money rapidly due to leverage. 66% of retail investor accounts lose money when trading CFDs with this provider. You should consider whether you understand how CFDs work and whether you can afford to take the high risk of losing your money.
Stratos Global LLC (tradu.com ):
Losses can exceed deposits.
Please be advised that the information presented on TradingView is provided to Tradu (‘Company’, ‘we’) by a third-party provider (‘TFA Global Pte Ltd’). Please be reminded that you are solely responsible for the trading decisions on your account. There is a very high degree of risk involved in trading. Any information and/or content is intended entirely for research, educational and informational purposes only and does not constitute investment or consultation advice or investment strategy. The information is not tailored to the investment needs of any specific person and therefore does not involve a consideration of any of the investment objectives, financial situation or needs of any viewer that may receive it. Kindly also note that past performance is not a reliable indicator of future results. Actual results may differ materially from those anticipated in forward-looking or past performance statements. We assume no liability as to the accuracy or completeness of any of the information and/or content provided herein and the Company cannot be held responsible for any omission, mistake nor for any loss or damage including without limitation to any loss of profit which may arise from reliance on any information supplied by TFA Global Pte Ltd.
The speaker(s) is neither an employee, agent nor representative of Tradu and is therefore acting independently. The opinions given are their own, constitute general market commentary, and do not constitute the opinion or advice of Tradu or any form of personal or investment advice. Tradu neither endorses nor guarantees offerings of third-party speakers, nor is Tradu responsible for the content, veracity or opinions of third-party speakers, presenters or participants.

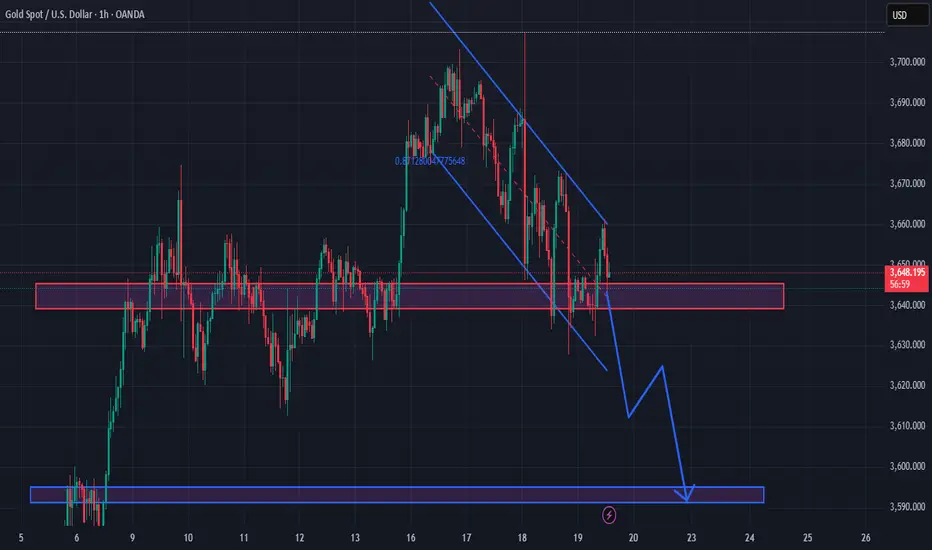
Take-profit near 3,610 first, and extended target around 3,590.1. Current Trend
Price is moving inside a down channel, marked by the two blue trendlines.
Each time price touches the upper edge of the channel, it gets rejected and turns lower, showing sellers are in control.
Key resistance zone: around 3,645 – 3,655 (red box), which has been tested multiple times but failed to hold.
2. Key Levels
Short-term resistance: 3,650 – 3,655. Unless a breakout occurs, the bearish momentum remains dominant.
Support target: 3,590 – 3,600 (blue box below). This is a previous low and a strong demand zone.
3. Price Scenarios
Main scenario (preferred): Price continues moving inside the down channel → breaks below 3,640 → gradually drops toward 3,600 – 3,590.
Alternative scenario: If there’s a strong breakout above 3,655 with a solid H1 close, the short-term trend may reverse upward, targeting 3,670 – 3,680.
4. Trading View
With the current trend: bias remains Sell within the down channel, with stop-loss above 3,660.
Take-profit near 3,610 first, and extended target around 3,590.
USDJPY H4 | Bullish bounce off 61.8% Fibonacci supportUSD/JPY is falling towards the buy entry, which is a pullback support that aligns with the 61.8% Fibonacci retracement and oculd bounce to the upside.
Buy entry is at 146.58, which is a pullback support that aligns with the 61.8% Fibonacci retracement.
Stop loss is at 145.75, which is a pullback support.
Take profit is at 148.78, which is a pullback resistance that lines up with the 127.2% Fibonacci extension.
High Risk Investment Warning
Trading Forex/CFDs on margin carries a high level of risk and may not be suitable for all investors. Leverage can work against you.
Stratos Markets Limited (tradu.com ):
CFDs are complex instruments and come with a high risk of losing money rapidly due to leverage. 65% of retail investor accounts lose money when trading CFDs with this provider. You should consider whether you understand how CFDs work and whether you can afford to take the high risk of losing your money.
Stratos Europe Ltd (tradu.com ):
CFDs are complex instruments and come with a high risk of losing money rapidly due to leverage. 66% of retail investor accounts lose money when trading CFDs with this provider. You should consider whether you understand how CFDs work and whether you can afford to take the high risk of losing your money.
Stratos Global LLC (tradu.com ):
Losses can exceed deposits.
Please be advised that the information presented on TradingView is provided to Tradu (‘Company’, ‘we’) by a third-party provider (‘TFA Global Pte Ltd’). Please be reminded that you are solely responsible for the trading decisions on your account. There is a very high degree of risk involved in trading. Any information and/or content is intended entirely for research, educational and informational purposes only and does not constitute investment or consultation advice or investment strategy. The information is not tailored to the investment needs of any specific person and therefore does not involve a consideration of any of the investment objectives, financial situation or needs of any viewer that may receive it. Kindly also note that past performance is not a reliable indicator of future results. Actual results may differ materially from those anticipated in forward-looking or past performance statements. We assume no liability as to the accuracy or completeness of any of the information and/or content provided herein and the Company cannot be held responsible for any omission, mistake nor for any loss or damage including without limitation to any loss of profit which may arise from reliance on any information supplied by TFA Global Pte Ltd.
The speaker(s) is neither an employee, agent nor representative of Tradu and is therefore acting independently. The opinions given are their own, constitute general market commentary, and do not constitute the opinion or advice of Tradu or any form of personal or investment advice. Tradu neither endorses nor guarantees offerings of third-party speakers, nor is Tradu responsible for the content, veracity or opinions of third-party speakers, presenters or participants.

USDCHF H4 | Bearish continuation below resistanceThe Swissie (USD/CHF) is rising towards the sell entry which acts as an overlap resistance that aligns with the 61.8% Fibonacci retracement and oculd reverse from this level to the take profit.
Sell entry is 0.7985, which is an overlap resistance that aligns with the 61.8% Fibonacci retracement.
Stop loss is at 0.8066, which is a pullback resistance.
Take profit is at 0.7855, which is a pullback support.
High Risk Investment Warning
Trading Forex/CFDs on margin carries a high level of risk and may not be suitable for all investors. Leverage can work against you.
Stratos Markets Limited (tradu.com ):
CFDs are complex instruments and come with a high risk of losing money rapidly due to leverage. 65% of retail investor accounts lose money when trading CFDs with this provider. You should consider whether you understand how CFDs work and whether you can afford to take the high risk of losing your money.
Stratos Europe Ltd (tradu.com ):
CFDs are complex instruments and come with a high risk of losing money rapidly due to leverage. 66% of retail investor accounts lose money when trading CFDs with this provider. You should consider whether you understand how CFDs work and whether you can afford to take the high risk of losing your money.
Stratos Global LLC (tradu.com ):
Losses can exceed deposits.
Please be advised that the information presented on TradingView is provided to Tradu (‘Company’, ‘we’) by a third-party provider (‘TFA Global Pte Ltd’). Please be reminded that you are solely responsible for the trading decisions on your account. There is a very high degree of risk involved in trading. Any information and/or content is intended entirely for research, educational and informational purposes only and does not constitute investment or consultation advice or investment strategy. The information is not tailored to the investment needs of any specific person and therefore does not involve a consideration of any of the investment objectives, financial situation or needs of any viewer that may receive it. Kindly also note that past performance is not a reliable indicator of future results. Actual results may differ materially from those anticipated in forward-looking or past performance statements. We assume no liability as to the accuracy or completeness of any of the information and/or content provided herein and the Company cannot be held responsible for any omission, mistake nor for any loss or damage including without limitation to any loss of profit which may arise from reliance on any information supplied by TFA Global Pte Ltd.
The speaker(s) is neither an employee, agent nor representative of Tradu and is therefore acting independently. The opinions given are their own, constitute general market commentary, and do not constitute the opinion or advice of Tradu or any form of personal or investment advice. Tradu neither endorses nor guarantees offerings of third-party speakers, nor is Tradu responsible for the content, veracity or opinions of third-party speakers, presenters or participants.

GBPUSD H4 | Setup for bearish dropThe Cable (GBP/USD) has broken out of the sell entry, which is an overlap support and oculd drop from this level to the downside.
Sell entry is at 1.3545, which is an overlap support.
Stop loss is at 1.3665, which acts as a swing high resistance.
Take profit is at 1.3394, which is a pullback support.
High Risk Investment Warning
Trading Forex/CFDs on margin carries a high level of risk and may not be suitable for all investors. Leverage can work against you.
Stratos Markets Limited (tradu.com ):
CFDs are complex instruments and come with a high risk of losing money rapidly due to leverage. 65% of retail investor accounts lose money when trading CFDs with this provider. You should consider whether you understand how CFDs work and whether you can afford to take the high risk of losing your money.
Stratos Europe Ltd (tradu.com ):
CFDs are complex instruments and come with a high risk of losing money rapidly due to leverage. 66% of retail investor accounts lose money when trading CFDs with this provider. You should consider whether you understand how CFDs work and whether you can afford to take the high risk of losing your money.
Stratos Global LLC (tradu.com ):
Losses can exceed deposits.
Please be advised that the information presented on TradingView is provided to Tradu (‘Company’, ‘we’) by a third-party provider (‘TFA Global Pte Ltd’). Please be reminded that you are solely responsible for the trading decisions on your account. There is a very high degree of risk involved in trading. Any information and/or content is intended entirely for research, educational and informational purposes only and does not constitute investment or consultation advice or investment strategy. The information is not tailored to the investment needs of any specific person and therefore does not involve a consideration of any of the investment objectives, financial situation or needs of any viewer that may receive it. Kindly also note that past performance is not a reliable indicator of future results. Actual results may differ materially from those anticipated in forward-looking or past performance statements. We assume no liability as to the accuracy or completeness of any of the information and/or content provided herein and the Company cannot be held responsible for any omission, mistake nor for any loss or damage including without limitation to any loss of profit which may arise from reliance on any information supplied by TFA Global Pte Ltd.
The speaker(s) is neither an employee, agent nor representative of Tradu and is therefore acting independently. The opinions given are their own, constitute general market commentary, and do not constitute the opinion or advice of Tradu or any form of personal or investment advice. Tradu neither endorses nor guarantees offerings of third-party speakers, nor is Tradu responsible for the content, veracity or opinions of third-party speakers, presenters or participants.

EURUSD H4 | Bearish drop confirmed after break of supportThe Fiber (EUR/USD) has reacted off the sell entry, which is a pullback resistance and oculd potentially drop from this level to he downside.
Sell entry is at 1.1807, which is a pullback resistance.
Stop loss is at 1.1867, which is a pullback resistance.
Take profit is at 1.1692, which is a pullback support.
High Risk Investment Warning
Trading Forex/CFDs on margin carries a high level of risk and may not be suitable for all investors. Leverage can work against you.
Stratos Markets Limited (tradu.com ):
CFDs are complex instruments and come with a high risk of losing money rapidly due to leverage. 65% of retail investor accounts lose money when trading CFDs with this provider. You should consider whether you understand how CFDs work and whether you can afford to take the high risk of losing your money.
Stratos Europe Ltd (tradu.com ):
CFDs are complex instruments and come with a high risk of losing money rapidly due to leverage. 66% of retail investor accounts lose money when trading CFDs with this provider. You should consider whether you understand how CFDs work and whether you can afford to take the high risk of losing your money.
Stratos Global LLC (tradu.com ):
Losses can exceed deposits.
Please be advised that the information presented on TradingView is provided to Tradu (‘Company’, ‘we’) by a third-party provider (‘TFA Global Pte Ltd’). Please be reminded that you are solely responsible for the trading decisions on your account. There is a very high degree of risk involved in trading. Any information and/or content is intended entirely for research, educational and informational purposes only and does not constitute investment or consultation advice or investment strategy. The information is not tailored to the investment needs of any specific person and therefore does not involve a consideration of any of the investment objectives, financial situation or needs of any viewer that may receive it. Kindly also note that past performance is not a reliable indicator of future results. Actual results may differ materially from those anticipated in forward-looking or past performance statements. We assume no liability as to the accuracy or completeness of any of the information and/or content provided herein and the Company cannot be held responsible for any omission, mistake nor for any loss or damage including without limitation to any loss of profit which may arise from reliance on any information supplied by TFA Global Pte Ltd.
The speaker(s) is neither an employee, agent nor representative of Tradu and is therefore acting independently. The opinions given are their own, constitute general market commentary, and do not constitute the opinion or advice of Tradu or any form of personal or investment advice. Tradu neither endorses nor guarantees offerings of third-party speakers, nor is Tradu responsible for the content, veracity or opinions of third-party speakers, presenters or participants.

Potential bullish bounce?USD/JPY is falling towards the pivot, which aligns with he 38.2% Fibonacci retracement and oculd bounce to the 1st resistance.
Pivot: 147.07
1st Support: 145.87
1st Resistance: 149
Disclaimer:
The above opinions given constitute general market commentary, and do not constitute the opinion or advice of IC Markets or any form of personal or investment advice.
Any opinions, news, research, analyses, prices, other information, or links to third-party sites contained on this website are provided on an "as-is" basis, are intended only to be informative, is not an advice nor a recommendation, nor research, or a record of our trading prices, or an offer of, or solicitation for a transaction in any financial instrument and thus should not be treated as such. The information provided does not involve any specific investment objectives, financial situation and needs of any specific person who may receive it. Please be aware, that past performance is not a reliable indicator of future performance and/or results. Past Performance or Forward-looking scenarios based upon the reasonable beliefs of the third-party provider are not a guarantee of future performance. Actual results may differ materially from those anticipated in forward-looking or past performance statements. IC Markets makes no representation or warranty and assumes no liability as to the accuracy or completeness of the information provided, nor any loss arising from any investment based on a recommendation, forecast or any information supplied by any third-party.

Bullish bounce setup?EUR/GBP is falling towards the pivot and oculd bounce to the 1st resistance which acts as a swing high resistance.
Pivot: 0.8678
1st Support: 0.8658
1st Resistance: 0.8712
Disclaimer:
The above opinions given constitute general market commentary, and do not constitute the opinion or advice of IC Markets or any form of personal or investment advice.
Any opinions, news, research, analyses, prices, other information, or links to third-party sites contained on this website are provided on an "as-is" basis, are intended only to be informative, is not an advice nor a recommendation, nor research, or a record of our trading prices, or an offer of, or solicitation for a transaction in any financial instrument and thus should not be treated as such. The information provided does not involve any specific investment objectives, financial situation and needs of any specific person who may receive it. Please be aware, that past performance is not a reliable indicator of future performance and/or results. Past Performance or Forward-looking scenarios based upon the reasonable beliefs of the third-party provider are not a guarantee of future performance. Actual results may differ materially from those anticipated in forward-looking or past performance statements. IC Markets makes no representation or warranty and assumes no liability as to the accuracy or completeness of the information provided, nor any loss arising from any investment based on a recommendation, forecast or any information supplied by any third-party.

Bullish continuation above key support?EUR/CAD is falling towards the pivot, which serves as a pullback support that aligns with the 50% Fibonacci retracement and could bounce back to the 1st resistance, which acts as a pullback resistance.
Pivot: 1.61864
1st Support: 1.61261
1st Resistance: 1.63589
Disclaimer:
The above opinions given constitute general market commentary, and do not constitute the opinion or advice of IC Markets or any form of personal or investment advice.
Any opinions, news, research, analyses, prices, other information, or links to third-party sites contained on this website are provided on an "as-is" basis, are intended only to be informative, is not an advice nor a recommendation, nor research, or a record of our trading prices, or an offer of, or solicitation for a transaction in any financial instrument and thus should not be treated as such. The information provided does not involve any specific investment objectives, financial situation and needs of any specific person who may receive it. Please be aware, that past performance is not a reliable indicator of future performance and/or results. Past Performance or Forward-looking scenarios based upon the reasonable beliefs of the third-party provider are not a guarantee of future performance. Actual results may differ materially from those anticipated in forward-looking or past performance statements. IC Markets makes no representation or warranty and assumes no liability as to the accuracy or completeness of the information provided, nor any loss arising from any investment based on a recommendation, forecast or any information supplied by any third-party.

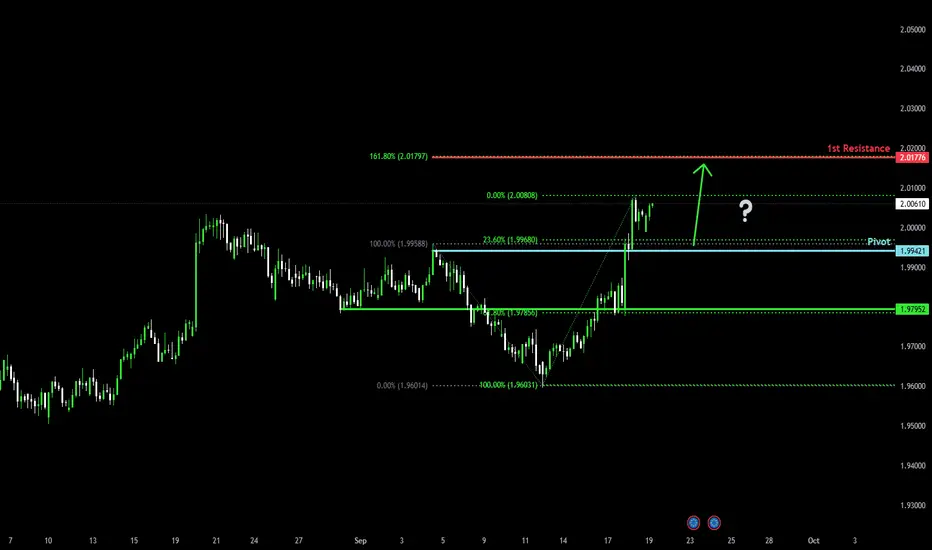
Bullish momentum to extend?EUR/NZD is falling toward the pivot and oculd bounce to the 1st resistance which aligns with the 161.80% Fibonacci extension.
Pivot: 1.99421
1st Support: 1.97952
1st Resistance: 2.01776
Disclaimer:
The above opinions given constitute general market commentary, and do not constitute the opinion or advice of IC Markets or any form of personal or investment advice.
Any opinions, news, research, analyses, prices, other information, or links to third-party sites contained on this website are provided on an "as-is" basis, are intended only to be informative, is not an advice nor a recommendation, nor research, or a record of our trading prices, or an offer of, or solicitation for a transaction in any financial instrument and thus should not be treated as such. The information provided does not involve any specific investment objectives, financial situation and needs of any specific person who may receive it. Please be aware, that past performance is not a reliable indicator of future performance and/or results. Past Performance or Forward-looking scenarios based upon the reasonable beliefs of the third-party provider are not a guarantee of future performance. Actual results may differ materially from those anticipated in forward-looking or past performance statements. IC Markets makes no representation or warranty and assumes no liability as to the accuracy or completeness of the information provided, nor any loss arising from any investment based on a recommendation, forecast or any information supplied by any third-party.
Why Spot Forex is the First Choice for Retail Traders1. Understanding Spot Forex
Before exploring the reasons for its popularity, it’s important to understand what spot forex really is.
Definition: Spot forex is the purchase or sale of one currency for another, with settlement occurring “on the spot” (usually within two business days, but in practice, retail brokers provide immediate execution).
Currency pairs: Trades happen in pairs like EUR/USD, GBP/JPY, or USD/INR. The first currency (base) is being bought or sold against the second (quote).
Objective: Traders aim to profit from the fluctuations in exchange rates between currencies.
Unlike futures or options, where contracts are traded, spot forex involves the direct exchange at current prices. For retail traders, brokers provide contracts via platforms that simulate this process with tight spreads, leverage, and easy order execution.
2. Historical Growth of Retail Forex
Until the late 1990s, forex was largely the playground of banks, hedge funds, and large corporations managing cross-border exposures. Retail investors had little or no access because:
Minimum transaction sizes were too large.
Trading required specialized knowledge and infrastructure.
Pricing was not transparent to the public.
However, the rise of online trading platforms around the year 2000 changed everything. Brokers like OANDA, FXCM, and later a flood of global platforms, introduced small contract sizes, user-friendly software (like MetaTrader), and access to leverage. Suddenly, anyone with an internet connection could participate.
By the mid-2000s, millions of retail traders had entered the forex market, with Asia, Europe, and later Africa becoming hotspots for new traders. Today, forex is the largest segment of retail online trading, far surpassing traditional stock trading in many regions.
3. Core Advantages of Spot Forex for Retail Traders
3.1 Liquidity and Market Size
Forex is the world’s most liquid market, with trillions of dollars traded daily. This liquidity brings several benefits:
Tight spreads: Bid-ask spreads are minimal, especially on major pairs like EUR/USD.
Instant execution: Orders can be filled within milliseconds.
No market manipulation (at retail scale): Because the market is so vast, individual retail traders or even brokers cannot manipulate prices significantly.
For beginners, this means fair pricing, ease of entry and exit, and reduced slippage compared to thinly traded assets.
3.2 24-Hour Market
Unlike stock exchanges that operate within specific hours, forex trading runs 24 hours a day, five days a week. From the Sydney open on Monday morning to the New York close on Friday evening, trading never stops.
This round-the-clock access is particularly attractive for retail traders who often trade part-time:
A student can trade after classes.
A working professional can trade after office hours.
A freelancer can pick sessions that match their schedule.
Flexibility is a major reason why forex fits into people’s lives more easily than stock markets with rigid timings.
3.3 Leverage and Low Capital Requirement
One of the most powerful attractions of forex is leverage. Brokers allow traders to control positions much larger than their deposit. For example:
With leverage of 1:100, a trader can control $10,000 worth of currency with just $100 margin.
Some brokers even offer leverage as high as 1:500 or more.
This means retail traders don’t need large starting capital. Someone with $500 can participate meaningfully in the market, unlike in stocks where buying even a few shares of large companies can consume the entire amount.
Of course, leverage is a double-edged sword (covered later), but its availability makes forex highly accessible.
3.4 Low Transaction Costs
Forex brokers earn mainly from spreads (the difference between buy and sell prices), which are often as low as 0.1 to 1 pip for major pairs. Compared to stock brokers who charge commissions or commodity markets with exchange fees, forex is cost-efficient.
No clearing fees, exchange fees, or government stamp duties make the cost structure simpler and lighter for retail traders.
3.5 Variety of Currency Pairs
Forex offers a wide menu of tradable instruments:
Majors: EUR/USD, GBP/USD, USD/JPY, USD/CHF.
Minors: EUR/GBP, AUD/JPY, GBP/CHF.
Exotics: USD/TRY, USD/ZAR, USD/INR.
This variety allows traders to pick pairs that suit their trading style. Some prefer stable majors with tight spreads, while others thrive on the volatility of exotic currencies.
3.6 Advanced Technology & Platforms
The retail forex industry has benefited enormously from trading technology. Platforms like MetaTrader 4 (MT4), MetaTrader 5 (MT5), and cTrader provide:
One-click execution.
Real-time charts.
Custom indicators and automated trading (Expert Advisors).
Mobile apps for trading on the go.
Such sophisticated tools, often free, are a huge reason forex became the default choice for retail traders.
4. Practical Reasons Retail Traders Prefer Spot Forex
4.1 Easy Account Setup
Opening a forex trading account is often easier than opening a stock brokerage account. With online KYC, low minimum deposits (sometimes as low as $10), and demo accounts, the barrier to entry is minimal.
4.2 Demo Accounts for Practice
Unlike many stock or commodity brokers, forex brokers almost always provide free demo accounts with virtual money. This allows beginners to practice strategies without financial risk, making the learning curve smoother.
4.3 Global Access
Forex is a truly global market. Whether you live in India, Nigeria, Brazil, or Europe, you can access the same currency pairs and pricing as traders in New York or London. This universality is rare in other asset classes.
5. Psychological & Behavioral Appeal
5.1 The Thrill of Leverage
For many beginners, the ability to control large amounts with small deposits is exhilarating. The idea of turning $100 into $1,000 in a short span appeals strongly to retail traders, even though the risks are equally high.
5.2 Freedom and Independence
Forex gives traders the sense of being their own boss. No middle managers, no clients to report to—just you, your strategy, and the market. This independence attracts people seeking financial freedom.
5.3 Quick Feedback Loop
Unlike long-term stock investing, forex provides immediate feedback. A trader knows within minutes or hours whether a trade is working, which keeps engagement high.
6. Risks and Misconceptions
It would be incomplete to discuss forex’s appeal without addressing its risks.
6.1 Overuse of Leverage
Leverage magnifies profits and losses. Many retail traders blow up accounts by over-leveraging, thinking they can get rich overnight.
6.2 Emotional Trading
The fast pace and 24-hour availability often lead to overtrading, revenge trading, or lack of discipline. Psychology plays a huge role in whether traders succeed or fail.
6.3 Broker Risks
Not all brokers are regulated. Many retail traders in emerging markets fall prey to fraudulent brokers promising unrealistic leverage or bonuses.
Despite these challenges, the majority of traders still flock to forex because the potential rewards outweigh perceived risks in their minds.
Conclusion
Spot forex has become the first choice for retail traders because it combines accessibility, liquidity, low costs, global reach, and technological sophistication in a way that no other market does. For individuals with limited capital, flexible schedules, and a desire for independence, forex is the natural starting point.
Yes, the risks are real—particularly misuse of leverage and emotional trading—but the sheer scale of opportunities continues to draw millions of retail traders each year.
For beginners and seasoned traders alike, the spot forex market remains not only the largest financial arena but also the most democratic—open to anyone, anywhere, with the willingness to learn and the discipline to trade.
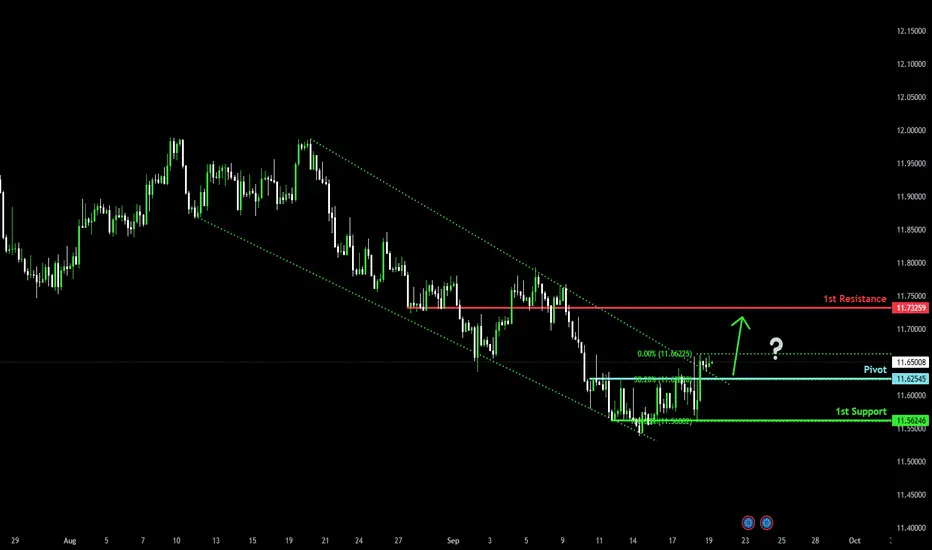
Bullish reversal at key support?EUR/NOK is falling towards the pivot which acts as a pullback support that aligns with th 38.2% Fibonacci retracement and could bounce to the 1st resistance.
Pivot: 11.62545
1st Support: 11.56246
1st Resistance: 11.73259
Disclaimer:
The above opinions given constitute general market commentary, and do not constitute the opinion or advice of IC Markets or any form of personal or investment advice.
Any opinions, news, research, analyses, prices, other information, or links to third-party sites contained on this website are provided on an "as-is" basis, are intended only to be informative, is not an advice nor a recommendation, nor research, or a record of our trading prices, or an offer of, or solicitation for a transaction in any financial instrument and thus should not be treated as such. The information provided does not involve any specific investment objectives, financial situation and needs of any specific person who may receive it. Please be aware, that past performance is not a reliable indicator of future performance and/or results. Past Performance or Forward-looking scenarios based upon the reasonable beliefs of the third-party provider are not a guarantee of future performance. Actual results may differ materially from those anticipated in forward-looking or past performance statements. IC Markets makes no representation or warranty and assumes no liability as to the accuracy or completeness of the information provided, nor any loss arising from any investment based on a recommendation, forecast or any information supplied by any third-party.
Bearish reversal off major resistance?CAD/CHF is rising towards the pivot which is an overlap resistance, and could reverse to the 1st support.
Pivot: 0.57794
1st Support: 0.57164
1st Resistance: 0.58228
Disclaimer:
The above opinions given constitute general market commentary, and do not constitute the opinion or advice of IC Markets or any form of personal or investment advice.
Any opinions, news, research, analyses, prices, other information, or links to third-party sites contained on this website are provided on an "as-is" basis, are intended only to be informative, is not an advice nor a recommendation, nor research, or a record of our trading prices, or an offer of, or solicitation for a transaction in any financial instrument and thus should not be treated as such. The information provided does not involve any specific investment objectives, financial situation and needs of any specific person who may receive it. Please be aware, that past performance is not a reliable indicator of future performance and/or results. Past Performance or Forward-looking scenarios based upon the reasonable beliefs of the third-party provider are not a guarantee of future performance. Actual results may differ materially from those anticipated in forward-looking or past performance statements. IC Markets makes no representation or warranty and assumes no liability as to the accuracy or completeness of the information provided, nor any loss arising from any investment based on a recommendation, forecast or any information supplied by any third-party.

Could we see a bullish reversal from here?USD/CHF is reacting off the resistance level, which is a pullback resistance and could potentially rise from this level to our take profit.
Entry: 0.7918
Why we like it:
There is a pullback resistance level.
Stop loss: 0.7855
Why we like it:
There is a pullback support.
Take profit: 0.7999
Why we like it:
There is an overlap resistance that is slightly above the 61.8% Fibonacci retracement.
Enjoying your TradingView experience? Review us!
Please be advised that the information presented on TradingView is provided to Vantage (‘Vantage Global Limited’, ‘we’) by a third-party provider (‘Everest Fortune Group’). Please be reminded that you are solely responsible for the trading decisions on your account. There is a very high degree of risk involved in trading. Any information and/or content is intended entirely for research, educational and informational purposes only and does not constitute investment or consultation advice or investment strategy. The information is not tailored to the investment needs of any specific person and therefore does not involve a consideration of any of the investment objectives, financial situation or needs of any viewer that may receive it. Kindly also note that past performance is not a reliable indicator of future results. Actual results may differ materially from those anticipated in forward-looking or past performance statements. We assume no liability as to the accuracy or completeness of any of the information and/or content provided herein and the Company cannot be held responsible for any omission, mistake nor for any loss or damage including without limitation to any loss of profit which may arise from reliance on any information supplied by Everest Fortune Group.

Bearish reversal off 61.8% Fibonacci resistance?USD/CAD is rising towards the resistance level, which is an overlap resistance that aligns with the 61.8% Fibonacci retracement and could reverse from this level to our take profit.
Entry: 1.3831
Why we like it:
There is an overlap resistance that aligns with the 61.8% Fibonacci retracement.
Stop loss: 1.3879
Why we like it:
There is a pullback resistance.
Take profit: 1.3729
Why we like it:
There is a pullback support level.
Enjoying your TradingView experience? Review us!
Please be advised that the information presented on TradingView is provided to Vantage (‘Vantage Global Limited’, ‘we’) by a third-party provider (‘Everest Fortune Group’). Please be reminded that you are solely responsible for the trading decisions on your account. There is a very high degree of risk involved in trading. Any information and/or content is intended entirely for research, educational and informational purposes only and does not constitute investment or consultation advice or investment strategy. The information is not tailored to the investment needs of any specific person and therefore does not involve a consideration of any of the investment objectives, financial situation or needs of any viewer that may receive it. Kindly also note that past performance is not a reliable indicator of future results. Actual results may differ materially from those anticipated in forward-looking or past performance statements. We assume no liability as to the accuracy or completeness of any of the information and/or content provided herein and the Company cannot be held responsible for any omission, mistake nor for any loss or damage including without limitation to any loss of profit which may arise from reliance on any information supplied by Everest Fortune Group.

Potential bearish drop?GBP/USD is rising towards the resistance level, which is a pullback resistance and could reverse from this level to our take profit.
Entry: 1.3584
Why we like it:
There is a pullback resistance level.
Stop loss: 1.3669
Why we like it:
There is a pullback resistance.
Take profit: 1.3457
Why we like it:
There is a pullback support that is slightly below the 61.8% Fibonacci retracement.
Enjoying your TradingView experience? Review us!
Please be advised that the information presented on TradingView is provided to Vantage (‘Vantage Global Limited’, ‘we’) by a third-party provider (‘Everest Fortune Group’). Please be reminded that you are solely responsible for the trading decisions on your account. There is a very high degree of risk involved in trading. Any information and/or content is intended entirely for research, educational and informational purposes only and does not constitute investment or consultation advice or investment strategy. The information is not tailored to the investment needs of any specific person and therefore does not involve a consideration of any of the investment objectives, financial situation or needs of any viewer that may receive it. Kindly also note that past performance is not a reliable indicator of future results. Actual results may differ materially from those anticipated in forward-looking or past performance statements. We assume no liability as to the accuracy or completeness of any of the information and/or content provided herein and the Company cannot be held responsible for any omission, mistake nor for any loss or damage including without limitation to any loss of profit which may arise from reliance on any information supplied by Everest Fortune Group.

Bullish bounce off 61.8% Fibonacci support?EUR/USD is falling towards the support level, which is a pullback support that aligns with the 61.8% Fibonacci retracement and could bounce from this level to our take profit.
Entry: 1.1728
Why we like it:
There is a pullback support that aligns with the 61.8% Fibonacci retracement.
Stop loss: 1.1613
Why we like it:
There is a pullback. support.
Take profit: 1.1866
Why we like it:
There is a pullback resistance.
Enjoying your TradingView experience? Review us!
Please be advised that the information presented on TradingView is provided to Vantage (‘Vantage Global Limited’, ‘we’) by a third-party provider (‘Everest Fortune Group’). Please be reminded that you are solely responsible for the trading decisions on your account. There is a very high degree of risk involved in trading. Any information and/or content is intended entirely for research, educational and informational purposes only and does not constitute investment or consultation advice or investment strategy. The information is not tailored to the investment needs of any specific person and therefore does not involve a consideration of any of the investment objectives, financial situation or needs of any viewer that may receive it. Kindly also note that past performance is not a reliable indicator of future results. Actual results may differ materially from those anticipated in forward-looking or past performance statements. We assume no liability as to the accuracy or completeness of any of the information and/or content provided herein and the Company cannot be held responsible for any omission, mistake nor for any loss or damage including without limitation to any loss of profit which may arise from reliance on any information supplied by Everest Fortune Group.

AUDJPY Strong cyclical Sell SignalLast time we made a call on the AUDJPY pair was 6 months ago (March 28, see chart below), giving a sell signal that quickly hit our 91.000 Target:
This time we have the price trading near the Top (Higher Highs trend-line) of a 4-month Channel Up but in the past 2 days has seen a minor pull-back on its 4H MA50 (blue trend-line).
This can be explained cyclically as based on the previous two Higher Highs and using the Time Cycles, the pattern topped exactly 2 days ago (just under the 1.382 Fib extension) and is technically in need of a correction towards its 0.5 Fibonacci retracement level.
As a result, and since the 1D RSI also dipped below its MA (consistent with both previous tops), we turn bearish on this pair, targeting 96.500.
-------------------------------------------------------------------------------
** Please LIKE 👍, FOLLOW ✅, SHARE 🙌 and COMMENT ✍ if you enjoy this idea! Also share your ideas and charts in the comments section below! This is best way to keep it relevant, support us, keep the content here free and allow the idea to reach as many people as possible. **
-------------------------------------------------------------------------------
💸💸💸💸💸💸
👇 👇 👇 👇 👇 👇

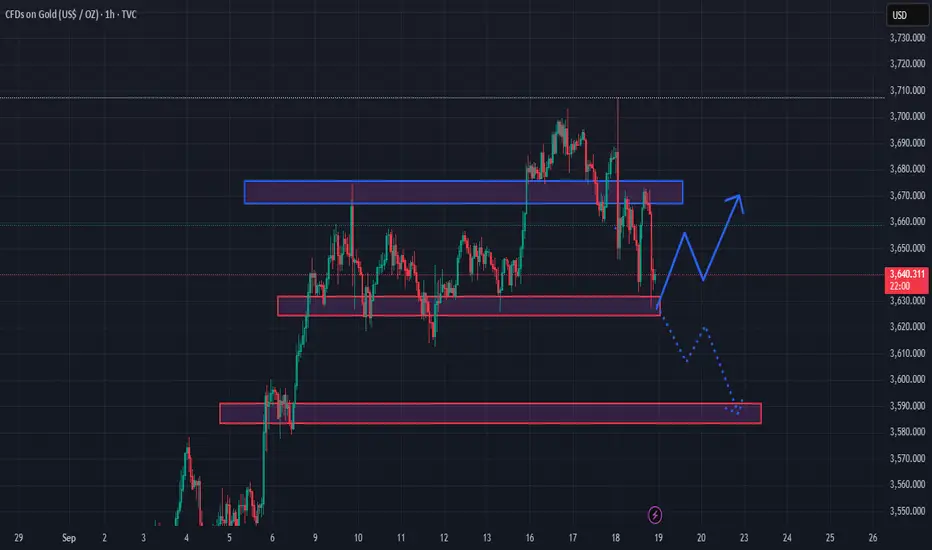
This is a price zone that has been rejected many times, strong s1. Key Supply & Demand Zones
Supply zone (resistance): around 3,680 – 3,700 (blue box). This is a level where price was rejected multiple times, showing strong selling pressure.
Near-term demand (support): around 3,630 – 3,640 (thin red box just below the current price).
Deeper support: around 3,590 – 3,600 (lower red box), where price previously bounced strongly.
2. Possible Scenarios
Bullish scenario (solid blue arrow):
If price holds the 3,630 – 3,640 support → it may rebound and retest the resistance at 3,670 – 3,690. A strong breakout above 3,700 would confirm continuation to the upside.
Bearish scenario (dotted blue arrow):
If price breaks below 3,630 → it could fall toward 3,590 – 3,600. This is a stronger demand zone where new buying pressure may appear.
3. Trading Notes
On H1, the main trend is still sideways – ranging between 3,590 and 3,700.
Short-term setups could be:
Buy around 3,630 – 3,640 (SL below 3,625, TP 3,670 – 3,690).
Sell around 3,680 – 3,690 (SL above 3,705, TP back to 3,640).
For clear breakouts (high volume, strong candles):
Above 3,700 → bullish bias.
Below 3,590 → bearish bias.