GBP/USD – Retest Breakdown Trendline Before BoE Decision📊 Market Context
GBP/USD has rebounded above 1.3600 during the European session on Thursday, finding fresh demand as the USD softened following recent Fed positioning. Traders are now focused on the Bank of England’s (BoE) rate decision later today, with expectations for no change in interest rates—but the market remains sensitive to any shift in tone.
🔢 Technical Outlook (H1)
FOMC Bearish Candle Confirmation: Price broke the ascending channel and confirmed bearish momentum.
Retest Breakdown Trendline – SELL ZONE: Around 1.36660, a potential area to rejoin the downtrend if rejection occurs.
Targets:
🎯 Target 1: 1.35401
🎯 Target 2: 1.35020 – Major support and Fibonacci confluence zone.
A clean break below 1.3580 will strengthen the bearish view, while reclaiming 1.3666 could invalidate the short-term bearish setup.
⚠ Trading Notes
Watch for volatility around the BoE announcement—tight stops and smaller sizing are recommended.
Wait for candlestick confirmation at the SELL ZONE before entering positions.
Maintain flexibility—unexpected BoE guidance could flip sentiment rapidly.
💬 Discussion
📈 Will GBP/USD respect the retest zone and slide toward 1.35020, or will the BoE decision spark a bullish breakout? Share your outlook and charts below to compare strategies!
Forexsignals

Gold price analysis September 18✏️ #XAUUSD – Gold Price Analysis Today
After the interest rate data was released, gold returned to test the important support zone and quickly saw buying pressure again. As long as the 3657 zone remains stable, the uptrend is likely to continue. The 3675 resistance zone will be the first challenge – if broken, the price could surge and move towards the target of 3720, even extending the rally to higher levels.
Conversely, if 3657 is broken, gold could retreat to a deeper consolidation zone with the next support around 3620.
📉 Notable Trading Zones
🔸 BUY when price reacts at 3657
🔸 BUY around deep support zone 3620
⭐ Target: 3720
🔺 Support: 3657 – 3620 – 3600
🔻 Resistance: 3675 – 3699 – 3720

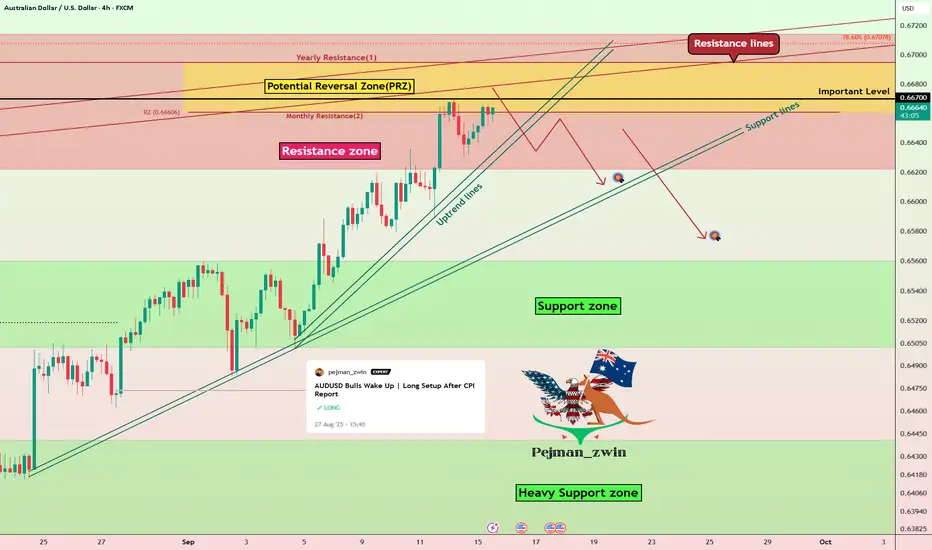
Short Setup on AUDUSD | Key Level at $0.667 TestedToday I want to share with you a Short position on the AUDUSD ( OANDA:AUDUSD ) pair. In the previous idea on AUDUSD, I managed to find the first part of this uptrend rally .
AUDUSD is currently trading in the Resistance zone($0.6714-$0.6622) and Potential Reversal Zone(PRZ) and near the Resistance lines .
Also, one of the reasons why I took this Short position on the AUDUSD pair is that the AUDUSD is approaching $0.667 , which is an important number in previous rallies (in terms of trading volume ) on the daily and weekly time frames.
I expect AUDUSD NOT to break the $0.667 level without a correction (at least), so a drop to $0.6614(First Target) is at least possible .
Second Target: $0.6580
Stop Loss(SL): $0.6723
Please respect each other's ideas and express them politely if you agree or disagree.
Australian Dollar/U.S.Dollar Analyze (AUDUSD), 4-hour time frame.
Be sure to follow the updated ideas.
Do not forget to put a Stop loss for your positions (For every position you want to open).
Please follow your strategy and updates; this is just my Idea, and I will gladly see your ideas in this post.
Please do not forget the ✅' like '✅ button 🙏😊 & Share it with your friends; thanks, and Trade safe.
GBP/USD - Channel Breakout @ H1 (BoE Interest Rate Today)CMCMARKETS:GBPUSD GBP/USD - Channel Breakout with strong volume and today BoE Interest Rate, it gives high movement.
"The Fed is still signalling more rate cuts, but at the same time still sees okay growth, which is a positive combination for share markets"
The Fed reduced rates by a quarter point on Wednesday, as expected, and indicated it will steadily lower borrowing costs for the rest of this year, initially sending the dollar plunging.
Support by Likes and Comments.
Thank you.

EUR/USD Long | Demand Zone + QML + Fibonacci Extension🚀 EUR/USD Long Setup – Demand zone + QML + Fib confluence! Targeting 1.1938 with a clean 1:4 RR. Waiting for H1 close above 1.1830 for confirmation. 📈
📊 Pair: EUR/USD (H1 timeframe)
📈 Bias: Bullish continuation
After a strong bullish impulse from 1.1780, price has retraced back into the Demand Zone (DB) and retested the QML (Quasimodo Level). Liquidity sweep and rejection candles suggest buyers are stepping back in.
Trade Setup:
Entry: 1.1812 (confirmation entry)
Stop Loss: 1.1789 (below DB)
Take Profit: 1.1938 (Fibonacci 1.618 extension)
Risk–Reward Ratio: ~1:4
Confluences:
✔ Demand zone (DB) holding strong
✔ QML retest providing bullish reaction
✔ Higher-highs / Higher-lows market structure intact
✔ Fibonacci extension levels aligning with liquidity targets (1.1918 – 1.1938)
⚠️ Note: Best confirmation will come from H1 candle close above 1.1830. Avoid Scheduled News Hours.

GBPUSD: Watching for Long Setup After Sweep + BOSMarket Context
Price swept liquidity below previous lows and has shown a strong impulsive move back up, breaking short-term structure to the upside. This signals a possible shift in momentum back to bullish.
Key Technicals
Liquidity sweep below recent lows
Bullish BOS on the 1H timeframe
Price retracing back into a demand zone
Demand zone aligns with 38.2–50% Fibonacci retracement
Looking for price reaction inside this confluence area
Trade Plan
Wait for price to return into the 1H demand zone (green box)
Look for rejection/confirmation candle near the 50 EMA
Buy only if price stays above the EMA and confirms from the zone
Target: Liquidity above recent highs around 1.37260
Invalidation: Clean close below the sweep low
Psychology Note
Patience here is key. Don’t chase the market—let price come to your zone. A professional trader treats setups like a sniper: calm, focused, and waiting. Remember, no trade is better than a forced trade. The edge comes from discipline, not constant action.

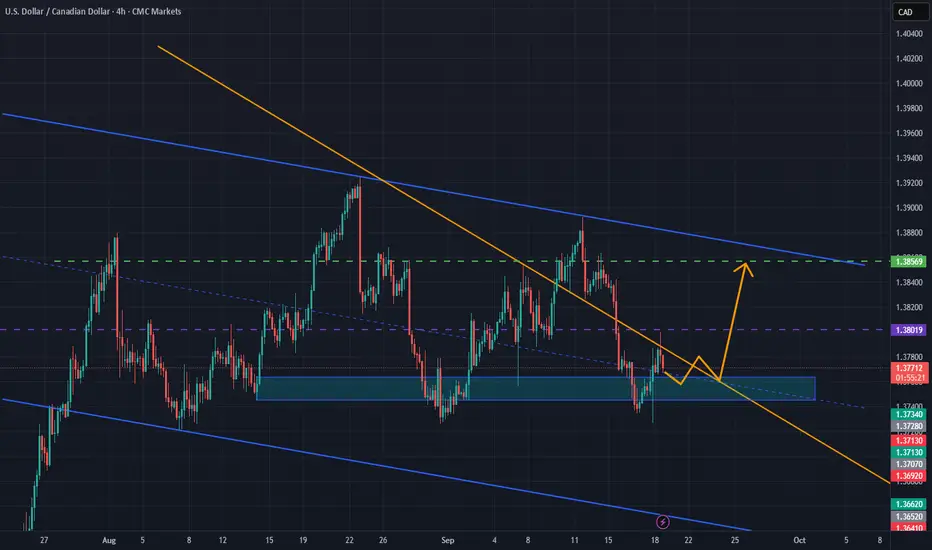
USD/CAD: Range-Bound with Recovery Attempt from Key SupportUSD/CAD continues to trade within a defined sideways channel, following a strong rejection near the 1.3925 resistance zone. The recent formation of a lower high has pushed price into the 1.3764–1.3693 support area, where buyers are attempting to hold the line.
A bounce from this demand zone could lead to a short-term recovery toward 1.3850, but the overall structure remains corrective. A clear break above the descending trendline would be needed to shift the momentum back in favor of the bulls and confirm a broader reversal.
GBPUSD H1 – Fibonacci Play: Ready for the Next Big Leg?GBPUSD is consolidating after its recent rally, and Fibonacci retracements highlight two critical buy zones for potential entries:
BUY ZONE 1: 1.36100 – SL 1.35600
SL: R/R - 1/2 - 1/3
BUY ZONE 2: 1.35500 – SL 1.35200
SL: R/R - 1/2 - 1/3
A potential dip into these zones could offer strong upside opportunities, with an extended Fibonacci reference pointing to 1.37200 as the next bullish target.
If price respects these supports, a rally toward 1.36699 → 1.37200 is on the table. A break below these zones, however, could delay the bullish scenario—so manage your risk carefully.
⚠ Key Levels to Watch
Immediate Resistance: 1.36699
Short-Term Supports: 1.36100 / 1.35500
Long-Term Target: 1.37200 (Extended Fibo)
💬 Your Turn
📈 Which Fibo zone are you watching for your entry—1.36100 or 1.35500? Share your view in the comments and let’s compare setups!

CHFJPY: Strong Bullish Pattern 🇨🇭🇯🇵
CHFJPY is currently updating the All-Time High, breaking
a neckline of a cup & handle pattern.
Looks like an uptrend is going to continue.
Next resistance - 186.85
❤️Please, support my work with like, thank you!❤️
I am part of Trade Nation's Influencer program and receive a monthly fee for using their TradingView charts in my analysis.

Bearish Outlook: AUDUSD on Track Toward 0.66210Good day everyone, Ken here!
I’ve been following AUDUSD rather closely, and it’s enjoyed a strong bullish move recently. Yet in my experience, such rallies rarely continue unchecked, and I sense this one may be nearing its peak.
There are subtle signs of sellers beginning to position themselves. My attention is firmly on the 0.66210 area – a level I consider crucial. Should price provide a clear confirmation here, not merely through candle formations but also through volume behaviour, I would view it as a potential entry point.
Naturally, the bullish scenario hasn’t vanished entirely. But for it to hold, buyers will need to demonstrate far greater conviction than they’ve shown so far.
That’s my perspective for now. How do you see it – do you share this view, or does the chart tell you a different story?

NZDUSD H4 | Could the Kiwi bounce from hereBased on the H4 chart analysis, we could see the price fell to the buy entry which is an overlap support that aligns with the 61.8% Fibonacci retracement and could bounce from this level to the take profit.
Buy entry is at 0.5883, which is an overlap support that aligns with the 61.8% Fibonacci retracement.
Stop loss is at 0.5823, which is a pullback support.
Take profit is at 0.5944, which is a pullback resistance.
High Risk Investment Warning
Trading Forex/CFDs on margin carries a high level of risk and may not be suitable for all investors. Leverage can work against you.
Stratos Markets Limited (tradu.com ):
CFDs are complex instruments and come with a high risk of losing money rapidly due to leverage. 65% of retail investor accounts lose money when trading CFDs with this provider. You should consider whether you understand how CFDs work and whether you can afford to take the high risk of losing your money.
Stratos Europe Ltd (tradu.com ):
CFDs are complex instruments and come with a high risk of losing money rapidly due to leverage. 66% of retail investor accounts lose money when trading CFDs with this provider. You should consider whether you understand how CFDs work and whether you can afford to take the high risk of losing your money.
Stratos Global LLC (tradu.com ):
Losses can exceed deposits.
Please be advised that the information presented on TradingView is provided to Tradu (‘Company’, ‘we’) by a third-party provider (‘TFA Global Pte Ltd’). Please be reminded that you are solely responsible for the trading decisions on your account. There is a very high degree of risk involved in trading. Any information and/or content is intended entirely for research, educational and informational purposes only and does not constitute investment or consultation advice or investment strategy. The information is not tailored to the investment needs of any specific person and therefore does not involve a consideration of any of the investment objectives, financial situation or needs of any viewer that may receive it. Kindly also note that past performance is not a reliable indicator of future results. Actual results may differ materially from those anticipated in forward-looking or past performance statements. We assume no liability as to the accuracy or completeness of any of the information and/or content provided herein and the Company cannot be held responsible for any omission, mistake nor for any loss or damage including without limitation to any loss of profit which may arise from reliance on any information supplied by TFA Global Pte Ltd.
The speaker(s) is neither an employee, agent nor representative of Tradu and is therefore acting independently. The opinions given are their own, constitute general market commentary, and do not constitute the opinion or advice of Tradu or any form of personal or investment advice. Tradu neither endorses nor guarantees offerings of third-party speakers, nor is Tradu responsible for the content, veracity or opinions of third-party speakers, presenters or participants.

Bullish bounce off support?The Aussie (AUD/USD) is falling towards the pivot and oculd bounce to the 1st resistance.
Pivot: 0.6619
1st Support: 0.6568
1st Resistance: 0.6689
Disclaimer:
The above opinions given constitute general market commentary, and do not constitute the opinion or advice of IC Markets or any form of personal or investment advice.
Any opinions, news, research, analyses, prices, other information, or links to third-party sites contained on this website are provided on an "as-is" basis, are intended only to be informative, is not an advice nor a recommendation, nor research, or a record of our trading prices, or an offer of, or solicitation for a transaction in any financial instrument and thus should not be treated as such. The information provided does not involve any specific investment objectives, financial situation and needs of any specific person who may receive it. Please be aware, that past performance is not a reliable indicator of future performance and/or results. Past Performance or Forward-looking scenarios based upon the reasonable beliefs of the third-party provider are not a guarantee of future performance. Actual results may differ materially from those anticipated in forward-looking or past performance statements. IC Markets makes no representation or warranty and assumes no liability as to the accuracy or completeness of the information provided, nor any loss arising from any investment based on a recommendation, forecast or any information supplied by any third-party.

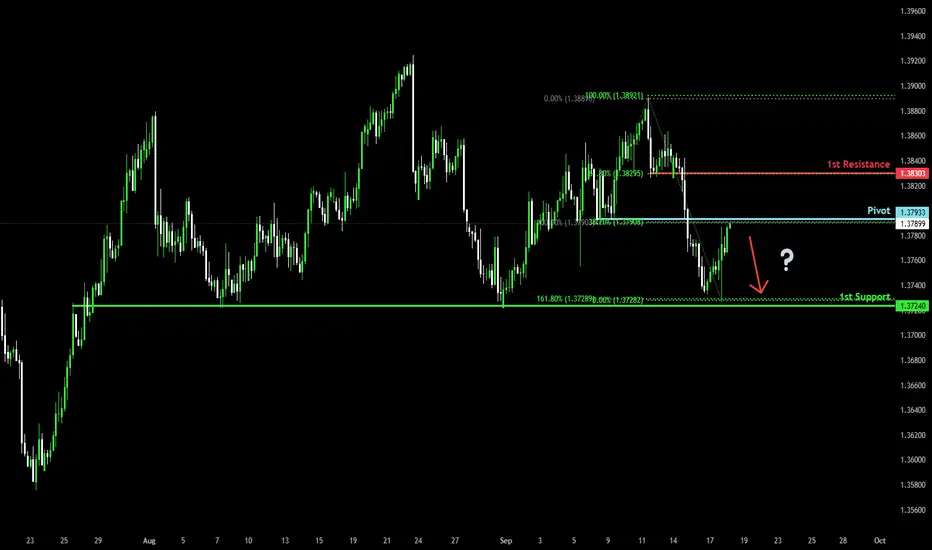
Could the Loonie reverse from here?The price is rising towards the pivot which acts as a pullback resistance that aligns with the 38.2% Fibonacci retracement and could reverse to the 1st support.
Pivot: 1.3793
1st Support: 1.3724
1st Resistance: 1.3830
Disclaimer:
The above opinions given constitute general market commentary, and do not constitute the opinion or advice of IC Markets or any form of personal or investment advice.
Any opinions, news, research, analyses, prices, other information, or links to third-party sites contained on this website are provided on an "as-is" basis, are intended only to be informative, is not an advice nor a recommendation, nor research, or a record of our trading prices, or an offer of, or solicitation for a transaction in any financial instrument and thus should not be treated as such. The information provided does not involve any specific investment objectives, financial situation and needs of any specific person who may receive it. Please be aware, that past performance is not a reliable indicator of future performance and/or results. Past Performance or Forward-looking scenarios based upon the reasonable beliefs of the third-party provider are not a guarantee of future performance. Actual results may differ materially from those anticipated in forward-looking or past performance statements. IC Markets makes no representation or warranty and assumes no liability as to the accuracy or completeness of the information provided, nor any loss arising from any investment based on a recommendation, forecast or any information supplied by any third-party.
Bearish reversal off 50% Fibonacci resistance?The Swissie (USD/CHF) is rising towards the pivot and could reverse to the 1st support.
Pivot: 0.7917
1st Support: 0.7851
1st Resistance: 0.7986
Disclaimer:
The above opinions given constitute general market commentary, and do not constitute the opinion or advice of IC Markets or any form of personal or investment advice.
Any opinions, news, research, analyses, prices, other information, or links to third-party sites contained on this website are provided on an "as-is" basis, are intended only to be informative, is not an advice nor a recommendation, nor research, or a record of our trading prices, or an offer of, or solicitation for a transaction in any financial instrument and thus should not be treated as such. The information provided does not involve any specific investment objectives, financial situation and needs of any specific person who may receive it. Please be aware, that past performance is not a reliable indicator of future performance and/or results. Past Performance or Forward-looking scenarios based upon the reasonable beliefs of the third-party provider are not a guarantee of future performance. Actual results may differ materially from those anticipated in forward-looking or past performance statements. IC Markets makes no representation or warranty and assumes no liability as to the accuracy or completeness of the information provided, nor any loss arising from any investment based on a recommendation, forecast or any information supplied by any third-party.

Bullish continuation setup?The Cable (GBP/USD) is falling towards the pivot which acts as a pullback support and oculd bounce to the 1st resistance.
Pivot: 1.3576
1st Support: 1.3514
1st Resistance: 1.3691
Disclaimer:
The above opinions given constitute general market commentary, and do not constitute the opinion or advice of IC Markets or any form of personal or investment advice.
Any opinions, news, research, analyses, prices, other information, or links to third-party sites contained on this website are provided on an "as-is" basis, are intended only to be informative, is not an advice nor a recommendation, nor research, or a record of our trading prices, or an offer of, or solicitation for a transaction in any financial instrument and thus should not be treated as such. The information provided does not involve any specific investment objectives, financial situation and needs of any specific person who may receive it. Please be aware, that past performance is not a reliable indicator of future performance and/or results. Past Performance or Forward-looking scenarios based upon the reasonable beliefs of the third-party provider are not a guarantee of future performance. Actual results may differ materially from those anticipated in forward-looking or past performance statements. IC Markets makes no representation or warranty and assumes no liability as to the accuracy or completeness of the information provided, nor any loss arising from any investment based on a recommendation, forecast or any information supplied by any third-party.

EUR/USD Bullish Continuation in Play — How High Can It Go?💶 EUR/USD “THE FIBRE” | Forex Money Liquidity Hunt Plan (Swing/Day Trade) 📊💼
📈 Trading Plan: Bullish Bias
Setup: Demand Zone 🔥 + Heikin Ashi Doji reversal confirmed 🟢 + Re-Accumulation spotted (buyers stepping in).
Narrative: Market showing strong intent from bulls, eyeing higher liquidity pools 🏦.
🎯 Entry Strategy (Layering Method)
We don’t chase — we layer! 🧑💼
Multiple limit orders (layered entries) can be set around these levels:
1.16500
1.16750
1.17000
1.17250
1.17500
(Traders may adjust / expand layering based on their style ✅).
🛡️ Stop Loss Guidance
Example SL: 1.16000 (below demand zone structure).
⚠️ Note: Adjust based on your own risk tolerance + strategy — flexibility is key.
🎯 Target Zone
Key Resistance: ~1.19500 ⚔️
Momentum shows overbought risk + possible liquidity trap in that area 🚨.
Best practice: Secure profits early, scale out gradually.
🔑 Key Notes for Traders
This is not financial advice 🚫. Manage risk, adapt levels, and trade safe.
Targets/SL shared are reference points only — every trader is responsible for their own execution.
🌍 Related Pairs to Watch
OANDA:EURGBP : Often mirrors EUR strength but reacts slower — useful for cross confirmation.
FX:USDJPY : Inverse correlation with risk appetite; USD weakness here may boost EUR/USD.
TVC:DXY (US Dollar Index): Always track! If TVC:DXY drops, EUR/USD usually pushes higher.
✨ “If you find value in my analysis, a 👍 and 🚀 boost is much appreciated — it helps me share more setups with the community!”
#EURUSD #Forex #SwingTrade #DayTrading #HeikinAshi #LiquidityHunt #LayeringStrategy #TradingPlan #PriceAction #DemandZone

GBP/USD – Detailed Trading Plan: Entry and Exit Levels💷📈 GBP/USD "THE CABLE" – Forex Market Making Plan (Swing/Day Trade) 🚀
📊 Plan
🔹 Current scenario: Bullish trend confirmed – Heikin Ashi bullish reversal candle + pullback to LSMA + re-accumulation.
🔹 Entry strategy: "layers" method 🪜 (multiple limit orders).
Buy Limit 1️⃣ @ 1.34500
Buy Limit 2️⃣ @ 1.35000
Buy Limit 3️⃣ @ 1.35500
Buy Limit 4️⃣ @ 1.36000
(You can add more levels depending on your strategy).
🛑 Stop-loss
My protective level: @1.33700 📉
👉 After the breakout of the specified zone, the stop is fixed.
⚠️ Dear traders, adjust SL yourself depending on your system and risk.
🎯 Profit targets
Primary Target: 1.37500
Secondary Target: 1.39000
💡 A resistance zone is formed at these levels + the market may become overbought, so take profits in time!
🔑 Key points
✅ Confirmed bullish Heikin Ashi signal.
✅ LSMA shows re-accumulation.
✅ Layering strategy provides flexibility in risk management.
🌍 Correlations and related pairs to observe
FX:EURUSD – often moves in sync with GBP/USD.
TVC:DXY (Dollar Index) – inverse correlation, dollar weakens → GBP/USD grows.
OANDA:GBPJPY – “bullish cross” confirms the strength of the pound.
OANDA:EURGBP – an additional indicator of the balance of the pound and the euro.
✨ “If you find value in my analysis, a 👍 and 🚀 boost is much appreciated - it helps me share more setups with the community!”
#GBPUSD #Forex #SwingTrade #DayTrade #HeikinAshi #Cable #TradingPlan #PriceAction #ForexAnalysis #FX

World gold prices continuously reverseThe Federal Open Market Committee (FOMC) meeting, which began on Tuesday morning, will conclude on Wednesday afternoon (US time) with a statement and press conference by US Federal Reserve (FED) Chairman Jerome Powell. The FOMC is expected to cut the key interest rate by 0.25 percentage points - the first since November last year.
The new FED forecast may also show a slowdown in US economic growth and a rise in unemployment. At the press conference, Chairman Powell will have to answer many questions not only about the economic outlook and interest rates but also about the independence of the FED.
Global stock markets generally rose slightly overnight, while US index futures forecast a mixed opening. In other developments, the Cyberspace Administration of China is said to have asked companies like Alibaba and ByteDance to cancel orders for Nvidia's RTX Pro 6000D chips - a line of chips designed to avoid restrictions on exporting AI technology to China.
The move comes as the US and China have just announced progress in trade negotiations in Madrid (Spain).

ANFIBO | BTCUSD in my view todayHello guys! It's me, Anfibo.
Here is my Strategic and Market Sentiment Perspective :
I agree with the view that BITSTAMP:BTCUSD is currently in a compression phase. The market seems to be waiting for a catalyst (potentially economic data or macro news) to break out of this consolidation zone.
>>> Key observations:
Trading volume has shown signs of decline over the past few sessions, reflecting investor sentiment of waiting on the sidelines rather than taking strong action.
Funding rates and overall market sentiment remain positive but not overly euphoric, which is a healthy signal supporting the case for a sustainable upward move.
On the Daily timeframe, the primary trend remains bullish, and the current sideways movement appears to be a technical correction within the broader uptrend.
>>> Strategic approach for today:
> For short-term traders: consider accumulating small positions around the support levels of 115,200 – 114,400, with stop-loss orders set below 114,000 to manage downside risk.
> For medium-term investors: it is more prudent to wait for a confirmed breakout above the 117,000 – 118,000 resistance zone before scaling into larger positions, targeting the 120,000 – 123,000 levels.
Have a beautiful day!

XAUUSDOverall, gold prices remain in a strong uptrend, but in the short term, if the price fails to break above 3704, there is a possibility of a downside, so consider selling in the red zone.
🔥Trading futures, forex, CFDs and stocks carries a risk of loss.
Please consider carefully whether such trading is suitable for you.
>>GooD Luck 😊
❤️ Like and subscribe to never miss a new idea!

Falling towards major support?The Fiber (EUR/USD) is falling towards the pivot which acts as a pullback support that is slightly above the 61.8% Fibonacci retracement and could bounce to the 1st resistance.
Pivot: 1.1768
1st Support: 1.1678
1st Resistance: 1.1895
Disclaimer:
The above opinions given constitute general market commentary, and do not constitute the opinion or advice of IC Markets or any form of personal or investment advice.
Any opinions, news, research, analyses, prices, other information, or links to third-party sites contained on this website are provided on an "as-is" basis, are intended only to be informative, is not an advice nor a recommendation, nor research, or a record of our trading prices, or an offer of, or solicitation for a transaction in any financial instrument and thus should not be treated as such. The information provided does not involve any specific investment objectives, financial situation and needs of any specific person who may receive it. Please be aware, that past performance is not a reliable indicator of future performance and/or results. Past Performance or Forward-looking scenarios based upon the reasonable beliefs of the third-party provider are not a guarantee of future performance. Actual results may differ materially from those anticipated in forward-looking or past performance statements. IC Markets makes no representation or warranty and assumes no liability as to the accuracy or completeness of the information provided, nor any loss arising from any investment based on a recommendation, forecast or any information supplied by any third-party.

Bearish reversal off pullback resistanceUS Dollar Index (DXY) is rising towards the pivot which acts as a pullback resistance and could reverse to the 1st support.
Pivot: 97.36
1st Support: 96.47
1st Resistance: 98.12
Disclaimer:
The above opinions given constitute general market commentary, and do not constitute the opinion or advice of IC Markets or any form of personal or investment advice.
Any opinions, news, research, analyses, prices, other information, or links to third-party sites contained on this website are provided on an "as-is" basis, are intended only to be informative, is not an advice nor a recommendation, nor research, or a record of our trading prices, or an offer of, or solicitation for a transaction in any financial instrument and thus should not be treated as such. The information provided does not involve any specific investment objectives, financial situation and needs of any specific person who may receive it. Please be aware, that past performance is not a reliable indicator of future performance and/or results. Past Performance or Forward-looking scenarios based upon the reasonable beliefs of the third-party provider are not a guarantee of future performance. Actual results may differ materially from those anticipated in forward-looking or past performance statements. IC Markets makes no representation or warranty and assumes no liability as to the accuracy or completeness of the information provided, nor any loss arising from any investment based on a recommendation, forecast or any information supplied by any third-party.

USDJPYHello Traders! 👋
What are your thoughts on USDJPY?
USD/JPY has been oscillating within a defined range for several weeks, bouncing between key support and resistance levels.
Price action remains choppy and directionless within the current range.
Potential Scenario:
• A break below the support zone could trigger a downside move toward the next identified targets.
• For a more confident entry, it’s recommended to wait for a confirmed breakdown below support before entering short positions.
Upcoming FOMC and BoJ policy meetings could act as catalysts for the next directional move.
Don’t forget to like and share your thoughts in the comments! ❤️
