Bitcoin Bearish Reversal SetupBitcoin is showing a potential bearish setup as the price approaches the central resistance zone. A rejection from this area could lead to a downward move toward the 101,500 target level, with selling pressure expected below the trendline.
Forexsignals

USD/JPY Bearish Breakdown SetupUSD/JPY shows a potential bearish move after rejection from the resistance zone and break of the trend line. Price is expected to retest the support zone before continuing down toward the target level at 1.154.00

gbpaud buy signal. Don't forget about stop-loss.
Write in the comments all your questions and instruments analysis of which you want to see.
Friends, push the like button, write a comment, and share with your mates - that would be the best THANK YOU.
P.S. I personally will open entry if the price will show it according to my strategy.
Always make your analysis before a trade

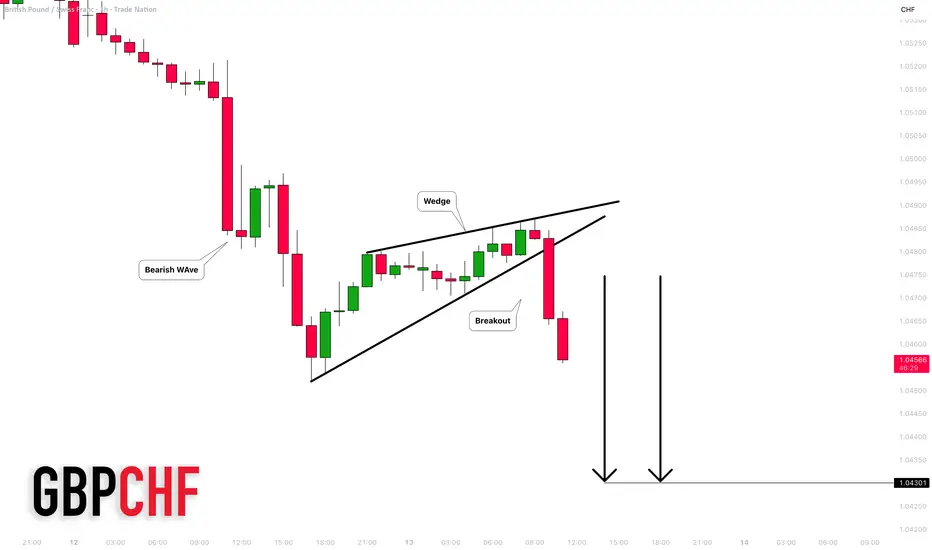
GBPCHF: Bearish Trend Continuation 🇬🇧🇨🇭
GBPCHF is trading in a strong downtrend.
A bearish breakout of a rising wedge pattern on an hourly time frame
indicates a highly probable trend continuation.
I expect a fall at least to 1.043 level.
❤️Please, support my work with like, thank you!❤️
I am part of Trade Nation's Influencer program and receive a monthly fee for using their TradingView charts in my analysis.
EURUSD – Bullish Setup Toward 1.16EURUSD – Bullish Setup Toward 1.17
EURUSD is showing strong signs of a bullish reversal after an extended period of downside movement. The 3H chart highlights several Market Structure Shifts (MSS) and Breaks of Structure (BOS) suggesting that bearish momentum is fading and buyers are regaining control near the 1.1500 demand zone.
The price is forming a solid accumulation base, indicating that smart money may be positioning for a move higher. A clean break above the 1.1680–1.1730 resistance area could confirm a trend reversal, opening the way for a sustained bullish rally toward the mid-1.18 region.
With momentum strengthening and structure turning positive, EURUSD looks poised for a potential breakout continuation in the days ahead.
📈 Key Insights:
Structure: Bullish reversal forming on 3H timeframe
Support zone: 1.1500 – strong accumulation base
Upside targets: 1.1680 → 1.1730 → 1.1800
Outlook: Buyers regaining control; bullish continuation likely

AUDNZD Rally Losing Steam – Watch This Reversal Zone!As we’ve seen, AUDNZD ( OANDA:AUDNZD ) recently began an upward move after forming a Falling Wedge Pattern , and it’s been in an Ascending Channel for about the past 16 days.
Currently, AUDNZD is moving into a Heavy Resistance zone(1.1662 NZD-1.1340 NZD) and a Potential Reversal Zone(PRZ) .
From an Elliott Wave perspective, it seems like AUDNZD is completing the microwave 5 of the main wave 3 . Once it breaks below the lower line of the ascending channel, we can somewhat confirm the end of the main wave 3.
Additionally, we can see a Negative Regular Divergence(RD-) forming between two consecutive peaks.
I expect that in the coming hours, AUDNZD might decline at least to the Support zone(1.1480 NZD-1.1444 NZD) . If it breaks that Support zone, we could see it dropping toward around 1.1353 NZD(Second Target) .
Stop Loss(SL): 1.16403 NZD
Please respect each other's ideas and express them politely if you agree or disagree.
Australian Dollar/New Zealand Dollar Analyze (AUDNZD), 4-hour time frame.
Be sure to follow the updated ideas.
Do not forget to put a Stop loss for your positions (For every position you want to open).
Please follow your strategy and updates; this is just my Idea, and I will gladly see your ideas in this post.
Please do not forget the ✅' like '✅ button 🙏😊 & Share it with your friends; thanks, and Trade safe.

EURUSD BUY OPPORTUNITY SWING TRADERS 30min There is a clear trend break and retest on 30min timeframe. Waiting for price to retest the support level and hit off 10 20 EMA. Targeting 1.17100. 4hr timeframe EMA's are also on uptrend. Potentially big rr trade....

EURNZD: Strong Bullish Confirmation 🇪🇺🇳🇿
Quick update for EURNZD.
Retesting the upper boundary of a major demand zone on a daily,
the price bounced and violated a resistance line of a falling channel
on an hourly time frame.
Probabilities are high that we will see a pullback from that.
Goal - 2.059
❤️Please, support my work with like, thank you!❤️
I am part of Trade Nation's Influencer program and receive a monthly fee for using their TradingView charts in my analysis.

US100 – Consolidation Between FVGs, Watching for Bullish BreakouHello traders,
On the daily timeframe, NASDAQ (US100) is currently consolidating between a bullish and a bearish Fair Value Gap (FVG). Both sides present clear liquidity areas, and the market is preparing for its next directional move.
From my perspective, I’d like to see the price tap into the bullish FVG first, react from that zone, and then invalidate the bearish FVG on its way higher.
If this scenario plays out, the next targets would be the equal highs (EQH) and eventually a new all-time high (ATH).
However, if a daily candle closes below the bullish FVG, this idea becomes invalid and we could expect further downside movement.
For now, I remain bullish while the bullish FVG holds. 📈
💌It is my honor to share your comments with me💌
🔎 DYOR
💡Wait for the update!

USDJPY - Perfect time to buy!USDJPY Is in a clear uptrend and has been for a very long time! It is currently inside an upward channel and has recently broken the last major resistance zone which means it is extremely likely to keep heading to the upside for much longer. The next target will be the fibonacci extension zone which is shown on the chart. USDJPY has struggled to break below support but has constantly been breaking through resistance levels. TIME TO BUY!

SELL NZDUSD - easy profitable trade opportunity!For many weeks NZDUSD has been dropping to the downside and is in a very clear downtrend. NZDUSD has tried to gain support but each time it holds onto support, it breaks through to the downside. NZDUSD recently tried to hold onto the latest support zone but once again it broke through which means it's time to sell and take profit at the next support level!


XAUUSDGold: The main trend remains up, but after testing the $4,380 level, the price was unable to break above this level and the price declined. We expect this to be a correction, with key support levels at 3,885 and 3,857. If the price can hold above 3,857, there is a high chance that the price will continue to rise.
** Very Risky Trade
🔥Trading futures, forex, CFDs and stocks carries a risk of loss.
Please consider carefully whether such trading is suitable for you.
>>GooD Luck 😊
❤️ Like and subscribe to never miss a new idea!

Gbpusd long setupFPMARKETS:GBPUSD looks bullish for wave 5, as the correction wave is completed. Price has broken the previous high 1.31647 & after a retrace till 1.30842, which is also in a OB and near fino level, high possibility of price to change the trend toward bullish. Please watch the chart carefully, below is the buying zone , with proper risk management one can take entry.

BUY GBPUSD (head and shoulders pattern formed)A head and shoulder pattern was recently formed on the GBPUSD paid indicating it is time for a major reversal to the upside. The price also broke through all the last resistance levels and has nowhere else to go to except the next resistance zone which is marked as the next take profit level. We will be buying GBPUSD NOW!

Gold Maintains Uptrend, Watch for Pullback to Buy with Cash Flow🔍 Context & Market Structure
After a strong upward impulse from a low liquidity area, the price has broken the downtrend structure and formed a bullish BoS on H1.
Currently, gold is accumulating above the Support Zone at 4,183 USD after creating a new peak and leaving a FVG just below the current price .
Above is the Liquidity Zone $$$ around 4,232 USD – a concentration of sell-side stop losses and buy-side profit-taking orders, likely to create a “final push” that attracts liquidity.
=> Overall: the main trend remains bullish , prioritising waiting for a pullback to discount levels to buy with the trend rather than chasing orders at high levels.
💎 Key Technical Zones
Liquidity Zone $$$: around 4,232 USD – upper liquidity area, prone to profit-taking reactions.
Current FVG: price gap area just below the current price (around 4.20x) – expected to “fill the gap” before continuing.
Support Zone 1: 4,183 USD – nearest support, confluence with the area where the upward impulse began to slow.
Support Zone 2: 4,140 USD – stronger support, aligning with the old structure.
Liquidity Clear: 4,101 USD – lower liquidity area, if swept, it would be a very attractive discount for swing buyers.
📈 Proposed Trading Scenarios
1️⃣ Main Scenario – Buy with the trend at FVG / 4,183 USD
Priority to wait for the price to:
Either fill the FVG around 4.20x and show a rejection candle,
Or clearly retest Support 4,183 USD with a bullish reversal signal on M15–H1.
When a confirmation signal appears:
→ Consider buying (BUY) around 4.19x – 4.18x .
Stoploss: below 4,175 USD (below the nearest low and support).
TP reference:
TP1: 4,210 USD
TP2: 4,232 USD (Liquidity Zone $$$)
TP3: trailing if the price breaks through 4,232 and maintains the bullish structure.
2️⃣ Alternative Scenario – Deeper Pullback Before Continuing Upward
If the price clearly breaks 4,183 USD and closes an H1 candle below:
→ Avoid buying hastily, wait for the price to continue adjusting to Support 4,140 USD or even Liquidity Clear 4,101 USD .
At these zones, if there appears:
strong rejection candles,
or small reversal structures (bullish ChoCH on M15),
→ Then consider buying at a discount with better RR, targeting a return to 4,183 → 4,210 → 4,232 USD.
3️⃣ Short-term Sell Scenario (for experienced scalpers only)
If the price hits Liquidity Zone 4,232 USD but shows strong rejection (long wick, high sell volume):
→ Consider short-term sell scalp back to the 4.20x – 4,183 USD area.
This is a counter-trend trade, so:
keep the volume small,
short TP,
tight SL above the newly formed peak.
⚠️ Risk Management Notes
Do not FOMO buy when the price is testing near the 4.23x area – this is a prone-to-sell area.
Prioritise waiting for a pullback to FVG / Support for a better entry point and RR.
Always adjust volume according to actual SL, avoid over-leverage during strong market volatility.
“Buy the dip in liquidity zones, do not chase orders at the peak – that's how to go with the big money flow.”

GBPJPY | Bullish Structure Targeting 204.20 Liquidity ZoneGBPJPY is showing strong bullish intent after multiple rejections from the 202.40–202.80 demand zone. Price is now consolidating just below a key liquidity pocket, hinting at a potential breakout toward 204.20 – 205.00, where major buy-side liquidity resides.
Market Breakdown:
HTF Bias: Bullish
Entry Zone: 202.40 – 202.80
Target Zone: 204.20 – 205.00
Invalidation: Below 202.20
Concepts Used: Liquidity Grab | Break of Structure | Demand Zone | Trend Continuation
⚙️ Watch for a clean break and retest of 203.20 to confirm continuation.

EUR/USD Rising Toward Resistance – Watch for ReversalOn the EUR/USD 15-minute chart, the price is showing strong bullish momentum, pushing toward the resistance zone around 1.1650. If the pair reaches this level and shows signs of rejection, a bearish reversal could follow, targeting the support area near 1.1568. Traders should monitor price action closely for confirmation before taking any positions. Patience and clear signals are key in this setup.

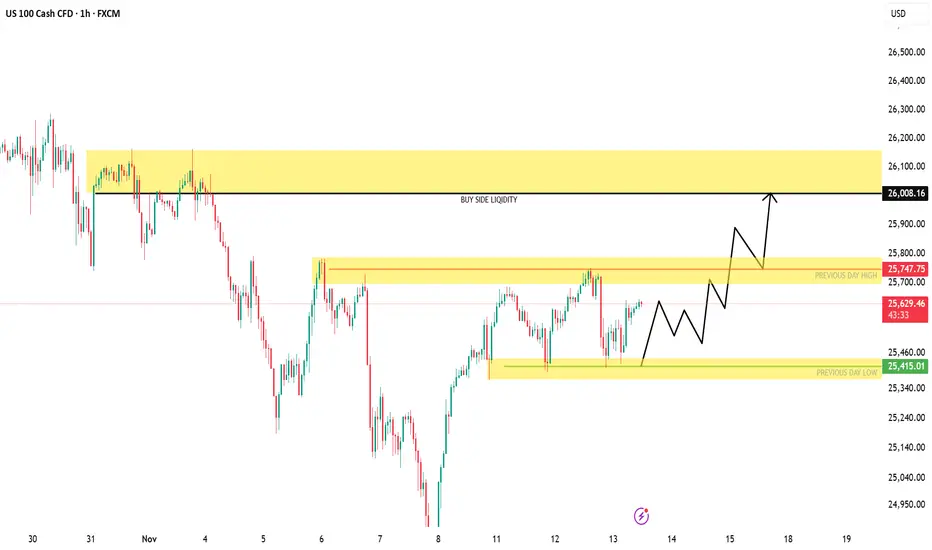
US100 | Building Liquidity for a Potential Push Toward 26,000NASDAQ (US100) is consolidating between 25,400–25,750, forming a potential accumulation zone below short-term liquidity. A clean break and retest above 25,750 could trigger a bullish expansion toward the 26,000–26,200 range, where major buy-side liquidity sits.
Market Structure:
Bias: Bullish (HTF structure shifting higher)
Key Demand Zone: 25,400 – 25,450
Breakout Zone: 25,750
Target Zone: 26,000 – 26,200
Invalidation: Below 25,400
Concepts: Liquidity Grab | Market Structure Shift | Demand Zone | Breaker Block | Smart Money Flow
ETH Support Bounce With Target at 3250Ethereum is trading above a key support level after a strong downward move. Price is showing early signs of a potential bullish correction, with projections pointing toward a possible recovery target around $3250. A break above minor resistance could confirm upward momentum.

USDCAD: Move Up Expected 🇺🇸🇨🇦
USDCAD will likely bounce from the underlined support cluster.
A formation of a bullish imbalance candle on that on a daily time frame
suggests a strong buying pressure.
Expect a rise at least to 1.4089
❤️Please, support my work with like, thank you!❤️
I am part of Trade Nation's Influencer program and receive a monthly fee for using their TradingView charts in my analysis.

EUR/USD Rejected at Resistance Possible PullbackOn the EUR/USD 15-minute chart, the price tested the resistance zone around 1.1653 and failed to break higher, showing signs of bearish pressure. If the pair continues to move lower, the next key support to watch is near 1.1597. A confirmed break below this level could open the door for a deeper correction. Traders should monitor price action closely for confirmation before entering any trades.

GOLD UPDATE Gold has triggered itself and missed take profit by a few inches by no worries as we still have potential and momentum to the upside , looking to take more trades in the future
