EURUSD Technical Setup – Bullish Move Incoming?EURUSD ( FX:EURUSD ) is currently positioned near the lower line of a potential descending channel and is hovering around a Support zone($1.1542-$1.1514) . There's also a smaller descending channel that formed last week, which is something we should consider in our EURUSD analysis .
There's a Regular Divergence (RD+) between the two recent lows that EURUSD has made, which is a good sign of a possible reversal.
In terms of Elliott Wave theory , it appears that EURUSD has completed the main wave 5, with the main wave 3 being an Extended wave . A break of the upper line of the descending channel(small) could confirm the end of the main wave 5.
I expect that EURUSD could at least move up toward the next Resistance zone($1.1586-$1.1575) .
Second Target: $1.1597
Stop Loss(SL)= $1.14857
Please respect each other's ideas and express them politely if you agree or disagree.
Euro/U.S. Dollar Analyze (EURUSD), 1-hour time frame.
Be sure to follow the updated ideas.
Do not forget to put a Stop loss for your positions (For every position you want to open).
Please follow your strategy and updates; this is just my Idea, and I will gladly see your ideas in this post.
Please do not forget the ✅' like '✅ button 🙏😊 & Share it with your friends; thanks, and Trade safe.
Forexsignals

XAUUSD $4025 RESISTANCE NEXT?This chart displays the price action of **Gold Spot / U.S. Dollar (XAU/USD)** on an **Hourly (1h)** timeframe.
## 📈 Technical Analysis: XAU/USD
The price has been in a **consolidative or choppy phase** following a significant prior downtrend, primarily trading within a larger range defined by a **Support zone** around the **\$3,918 - \$3,925** area and a **Resistance zone** near **\$4,020 - \$4,030**.
Within this range, price action appears to have formed a **Descending Channel** (indicated by the dashed lines), suggesting a short-term bearish bias or continued correction within the broader consolidation. However, more recently, the price has broken out of the upper boundary of this descending channel.
Following the channel breakout, the price has entered a **tight, upward-sloping consolidation**, possibly forming a small **bullish flag or pennant pattern** (indicated by the solid, inner trendlines). The current candle is breaking above the upper trendline of this smaller pattern, suggesting a potential continuation move to the upside.
---
## 🎯 Price Projection
Given the breakout from both the descending channel and the smaller bullish consolidation pattern, the immediate projection is **bullish**. The target for this move is the test of the main **Resistance zone** established at **\$4,020 - \$4,030**.
* **Potential Target:** The analysis highlights a specific target around **\$4,040.5**, which represents a **1.17%** move from a breakout point and aligns with the upper boundary of the key resistance zone.
* **Validation:** Continued strength and sustained trading above the breakout level (around **\$3,980**) would reinforce this bullish projection.
* **Invalidation:** A decisive move back below the current consolidation area and the upper line of the descending channel (roughly below **\$3,960 - \$3,970**) would invalidate the immediate bullish bias and suggest a return to the broader ranging behavior or a retest of the support zone.
The overall context remains range-bound, meaning a successful test of the $\mathbf{\$4,020}$ $\mathbf{-}$ $\mathbf{\$4,030}$ **Resistance** could lead to another move back down unless there is a strong, sustained breakout above it.
Would you like me to search for fundamental news that might be impacting the price of Gold right now?

AUD/USD – Smart Money Building Quietly at the BottomThe AUD/USD pair is trading around 0.6510, consolidating after an extended bearish move. From a Smart Money Concept (SMC) perspective, price action suggests that institutional players may be absorbing liquidity at discounted prices, hinting at a potential accumulation phase before driving price upward to collect liquidity at higher zones.
💭 1️⃣ Market Structure – When Price Pauses to “Take a Breath”
Following a series of bearish legs, AUD/USD has formed a Market Structure Shift (MSS) near the 0.6460 zone, signaling early signs of weakening bearish momentum.
Currently, price is holding within 0.6500 – 0.6510, forming a stable base of support. If this structure holds, it may serve as the foundation for a short-term bullish correction targeting the upper supply zones.
Each dip into the lower range has shown long lower wicks and narrow candle bodies — a classic footprint of Smart Money absorbing sell-side liquidity in preparation for accumulation.
🩶 2️⃣ Supply & Demand Zones – Footprints of Smart Money
Karina is closely monitoring three key structural zones:
Demand Zones:
0.6462 – 0.6432: A strong demand base where price has reacted multiple times — likely a zone of institutional accumulation.
0.6504: A short-term demand area currently being tested, acting as the first layer of support.
Supply Zones:
0.6570: A local supply zone where price may react upon retracement.
0.6642 – 0.6667: A higher supply zone filled with resting buy-side liquidity — potential target area for the next institutional move.
🧭 3️⃣ Liquidity Context – When Smart Money Buys Low to Sell High
The liquidity landscape shows that sell-side liquidity has already been swept near 0.6460, while buy-side liquidity remains untouched around 0.6618 – 0.6707.
This aligns perfectly with a common SMC narrative:
Smart Money absorbs liquidity below → builds structure → drives price upward to collect liquidity above.
If price maintains structure above 0.6504 – 0.6462, we could see a bullish displacement toward the next liquidity pools around 0.6570 and 0.6640 – 0.6660.
🌙 4️⃣ Trade Scenario – Follow Smart Money, Don’t Fight It
Karina’s current bias favors buying from discount zones once structure confirms a shift.
Entry: 0.6465 – 0.6500
Stop Loss: below 0.6430
Take Profit: 0.6570 – 0.6660
This setup aligns with institutional logic — buy where Smart Money accumulates, take profit where they distribute.
🌷 5️⃣ Reflection – When the Market Is Quiet, Institutions Are Working
The market doesn’t need loud volatility to tell a story — often, quiet accumulation speaks the loudest.
To Karina, this phase is about patience and observation — letting structure reveal its intent instead of rushing into noise.
Right now, the market feels like it’s taking a deep breath before its next move. Smart Money usually moves in silence — they buy low, and sell high. 🌸

AUDJPY: Short Term Bearish Movement 🇦🇺🇯🇵
AUDJPY may drop from the underlined intraday horizontal resistance.
We can expect a retracement at least to 99.9 level.
❤️Please, support my work with like, thank you!❤️
I am part of Trade Nation's Influencer program and receive a monthly fee for using their TradingView charts in my analysis.

DXY Daily Outlook — Bullish Order Flow Toward Equal HighsHello traders 👋
On the DXY daily chart, we can clearly see that price showed a strong bullish reaction after grabbing liquidity below 96.37, initiating a bullish order flow that, in my view, is still in progress.
The equal highs above the current price act as a potential draw on liquidity and serve as my first bullish target.
However, keep an eye on the trendline liquidity forming below the current price — there’s a possibility that price may sweep this liquidity before continuing higher.
Overall, my bias remains bullish for now.
💌It is my honor to share your comments with me💌
🔎 DYOR
💡Wait for the update!

XAUUSD Smart Money Zones & Trade Plan — Nov 06, 2025🟡 GOLD ANALYSIS - Updated Nov 06, 2025
OANDA:XAUUSD Gold is consolidating between the $3,950–$4,020 range as the U.S. government shutdown delays key data releases.
DXY is weaker near ~100.15, while the Fed’s recent 25bps cut (3.75–4%) keeps markets uncertain about the next move.
Central Banks remain net buyers (+19t in August, +220t in Q3), led by Poland.
ETF inflows are supporting price while geopolitical tensions continue to fuel safe-haven demand.
🧭 SMART MONEY LEVELS (Valid Today)
🔻 SELL ZONES
• $4,025 – $4,037 → Smart Money Sell Area
• $4,015 – $4,005 → Scalp Sell Area
🔺 BUY ZONES
• $3,938 – $3,915 → Smart Money Buy Accumulation Range
Current Price: ~$3,990
📊 TECHNICAL OUTLOOK
• Holding above $3,950 maintains a mild bullish structure
• Break above $4,020 can retest $4,100
• Break below $3,915 may extend correction toward $3,900
🔮 Timing Insight
Between 22:00–23:00 UK Time, expect a potential bullish liquidity spike near buy zones.
📌 Conclusion
Gold remains in controlled consolidation with a bullish tilt.
Trade reaction to levels, not prediction.
Let liquidity guide entries.

NZDUSD H1 | Bearish ContinuationSetupKiwi (NZD/USD) is rising towards the sell entry, which is a pullback resistance that is slightly below the 38.2% Fibonacci retracemnt and could reverse from this level to the downside.
Sell entry is at 0.5685, which is a pullback resistance that is slightly below the 38.2% Fibonacci retracemnt.
Stop loss is at 0.5704, whichis a pullback resistance that is slightly below the 50% Fibonacci retracemnt.
Take profit is at 0.5635, whichis a pullback support.
Stratos Markets Limited (tradu.com ):
CFDs are complex instruments and come with a high risk of losing money rapidly due to leverage. 68% of retail investor accounts lose money when trading CFDs with this provider. You should consider whether you understand how CFDs work and whether you can afford to take the high risk of losing your money.
Stratos Europe Ltd (tradu.com ):
CFDs are complex instruments and come with a high risk of losing money rapidly due to leverage. 70% of retail investor accounts lose money when trading CFDs with this provider. You should consider whether you understand how CFDs work and whether you can afford to take the high risk of losing your money.

Gold Testing Resistance, Compression Structure Set to Break📊 Market Structure
On the H1 chart, gold is forming a compression structure between the Support 3,944 USD and Resistance 3,989 USD zones.
The recent lows create a series of Higher Lows along the rising trendline – indicating buyers are quietly absorbing supply around the lower region.
However, the 3,989 USD zone remains the central resistance axis , converging with the descending trendline formed from the previous peak (4,028 USD). Each time the price hits this zone, a short-term profit-taking reaction occurs, showing strong defense from sellers.
Below the support zone, the Premium Zone 3,944 USD continues to be the main pivot point – where the price has previously surged strongly in the last two sessions.
If this zone is breached, the short-term bullish structure will be invalidated, opening up the possibility of returning to the Liquidity Zone around 3,921 – 3,892 USD .
Conversely, if the price closes above 3,989 USD , the market will confirm a Bullish Break of Structure (BoS), triggering an extended target towards 4,028 – 4,052 USD .
💎 Key Technical Zones
• Resistance Zone 1: 3,989 USD → main resistance, strong reaction zone.
• Resistance Zone 2: 4,028 – 4,052 USD → upper liquidity target zone.
• Support Zone: 3,944 USD → dynamic support, converging with the rising trendline.
• Liquidity Zone: 3,921 – 3,892 USD → the last zone protecting the bullish structure.
🎯 Trading Scenarios
1️⃣ BUY Scenario – Await Confirmed Breakout:
If the price closes above 3,989 USD and successfully retests:
• Entry: 3,985 – 3,995
• SL: 3,965
• TP1: 4,015
• TP2: 4,028
• TP3: 4,052
2️⃣ SELL Scenario – React at Resistance:
If a reversal candlestick pattern appears at 3,989 USD:
• Entry: 3,985 – 3,990
• SL: 4,000
• TP1: 3,965
• TP2: 3,950
• TP3: 3,944
🧠 Vincent’s View
Gold is in a “compression before breakout” phase, with liquidity concentrated around the 3,989 USD zone.
If this zone is broken, the price could quickly surge to the supply area above 4,028 – 4,052 USD.
If it fails, a price rejection here could pull gold back to the rising trendline at 3,950 USD.
“Compression breeds expansion — let price show which side holds conviction.” ⚜️
⏰ Timeframe: 1H
📅 Updated: 06/11/2025
✍️ Analysis by: Captain Vincent

XAUUSD H4 | Bullish Bounce OffXAU/USD has bounced off the buy entry at 3,945.45, which is a pullback support and could rise from this level to the upside.
Stop loss is at 3,840.07, whic his a pullback support.
Take profit is at 4,136.36, which is a pullback resistance that aligns witht he 50% Fibonacci retracement.
Stratos Markets Limited (tradu.com ):
CFDs are complex instruments and come with a high risk of losing money rapidly due to leverage. 68% of retail investor accounts lose money when trading CFDs with this provider. You should consider whether you understand how CFDs work and whether you can afford to take the high risk of losing your money.
Stratos Europe Ltd (tradu.com ):
CFDs are complex instruments and come with a high risk of losing money rapidly due to leverage. 70% of retail investor accounts lose money when trading CFDs with this provider. You should consider whether you understand how CFDs work and whether you can afford to take the high risk of losing your money.

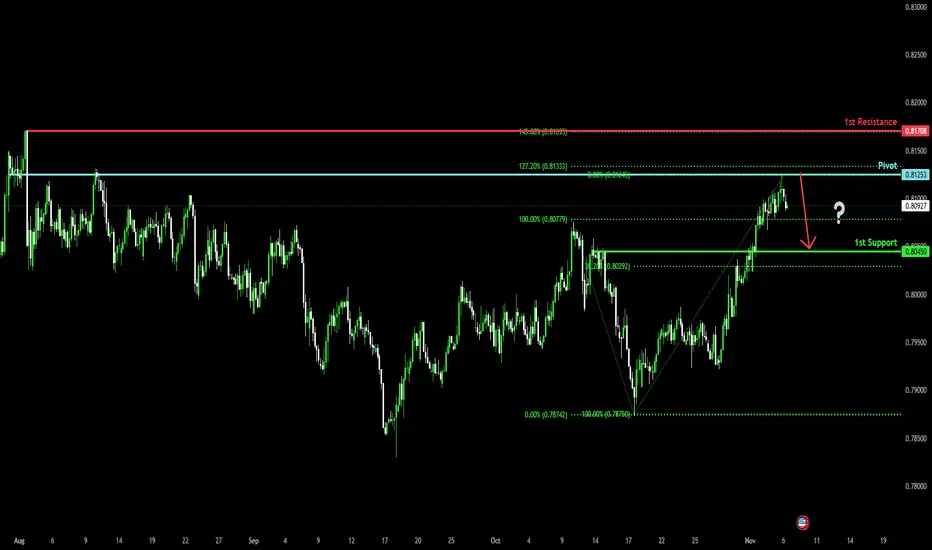
Bearish reversal off Fibonacci level?The Swissie (USD/CHF) has rejected off the pivot and could drop to the 1st support.
Pivot: 0.8125
1st Support: 0.8045
1st Resistance: 0.8170
Disclaimer:
The above opinions given constitute general market commentary, and do not constitute the opinion or advice of IC Markets or any form of personal or investment advice.
Any opinions, news, research, analyses, prices, other information, or links to third-party sites contained on this website are provided on an "as-is" basis, are intended only to be informative, is not an advice nor a recommendation, nor research, or a record of our trading prices, or an offer of, or solicitation for a transaction in any financial instrument and thus should not be treated as such. The information provided does not involve any specific investment objectives, financial situation and needs of any specific person who may receive it. Please be aware, that past performance is not a reliable indicator of future performance and/or results. Past Performance or Forward-looking scenarios based upon the reasonable beliefs of the third-party provider are not a guarantee of future performance. Actual results may differ materially from those anticipated in forward-looking or past performance statements. IC Markets makes no representation or warranty and assumes no liability as to the accuracy or completeness of the information provided, nor any loss arising from any investment based on a recommendation, forecast or any information supplied by any third-party.
Bullish bounce off for the Kiwi?The price has bounced off the pivot, which is a pullback support and could potentially rise to the 1st resistance, which acts as a pullback resistance.
Pivot: 0.5639
1st Support: 0.5562
1st Resistance: 0.5715
Disclaimer:
The above opinions given constitute general market commentary, and do not constitute the opinion or advice of IC Markets or any form of personal or investment advice.
Any opinions, news, research, analyses, prices, other information, or links to third-party sites contained on this website are provided on an "as-is" basis, are intended only to be informative, is not an advice nor a recommendation, nor research, or a record of our trading prices, or an offer of, or solicitation for a transaction in any financial instrument and thus should not be treated as such. The information provided does not involve any specific investment objectives, financial situation and needs of any specific person who may receive it. Please be aware, that past performance is not a reliable indicator of future performance and/or results. Past Performance or Forward-looking scenarios based upon the reasonable beliefs of the third-party provider are not a guarantee of future performance. Actual results may differ materially from those anticipated in forward-looking or past performance statements. IC Markets makes no representation or warranty and assumes no liability as to the accuracy or completeness of the information provided, nor any loss arising from any investment based on a recommendation, forecast or any information supplied by any third-party.

Bearish reversal off 50% Fibonacci resistance?The Aussie (AUD/USD) is rising towards the pivot which lines up with the 50% Fibonacci retracement and could reverse to the 1st support.
Pivot: 0.6537
1st Support: 0.6442
1st Resistance: 0.6606
Disclaimer:
The above opinions given constitute general market commentary, and do not constitute the opinion or advice of IC Markets or any form of personal or investment advice.
Any opinions, news, research, analyses, prices, other information, or links to third-party sites contained on this website are provided on an "as-is" basis, are intended only to be informative, is not an advice nor a recommendation, nor research, or a record of our trading prices, or an offer of, or solicitation for a transaction in any financial instrument and thus should not be treated as such. The information provided does not involve any specific investment objectives, financial situation and needs of any specific person who may receive it. Please be aware, that past performance is not a reliable indicator of future performance and/or results. Past Performance or Forward-looking scenarios based upon the reasonable beliefs of the third-party provider are not a guarantee of future performance. Actual results may differ materially from those anticipated in forward-looking or past performance statements. IC Markets makes no representation or warranty and assumes no liability as to the accuracy or completeness of the information provided, nor any loss arising from any investment based on a recommendation, forecast or any information supplied by any third-party.

Buillish reversal off pullback support?The Cable (GBP/USD) is reacting off the pivot and could bounce to the 1st resistance.
Pivot: 1.3011
1st Support: 1.2932
1st Resistance: 1.3267
Disclaimer:
The above opinions given constitute general market commentary, and do not constitute the opinion or advice of IC Markets or any form of personal or investment advice.
Any opinions, news, research, analyses, prices, other information, or links to third-party sites contained on this website are provided on an "as-is" basis, are intended only to be informative, is not an advice nor a recommendation, nor research, or a record of our trading prices, or an offer of, or solicitation for a transaction in any financial instrument and thus should not be treated as such. The information provided does not involve any specific investment objectives, financial situation and needs of any specific person who may receive it. Please be aware, that past performance is not a reliable indicator of future performance and/or results. Past Performance or Forward-looking scenarios based upon the reasonable beliefs of the third-party provider are not a guarantee of future performance. Actual results may differ materially from those anticipated in forward-looking or past performance statements. IC Markets makes no representation or warranty and assumes no liability as to the accuracy or completeness of the information provided, nor any loss arising from any investment based on a recommendation, forecast or any information supplied by any third-party.

Bullish continuation setup?The US Dollar Index (DXY) is falling towards the pivot which is a pullback support that aligns with the 38.2% Fibonacci retracement and could bounce to the 1st resistance.
Pivot: 99.53
1st Support: 98.55
1st Resistance: 101.46
Disclaimer:
The above opinions given constitute general market commentary, and do not constitute the opinion or advice of IC Markets or any form of personal or investment advice.
Any opinions, news, research, analyses, prices, other information, or links to third-party sites contained on this website are provided on an "as-is" basis, are intended only to be informative, is not an advice nor a recommendation, nor research, or a record of our trading prices, or an offer of, or solicitation for a transaction in any financial instrument and thus should not be treated as such. The information provided does not involve any specific investment objectives, financial situation and needs of any specific person who may receive it. Please be aware, that past performance is not a reliable indicator of future performance and/or results. Past Performance or Forward-looking scenarios based upon the reasonable beliefs of the third-party provider are not a guarantee of future performance. Actual results may differ materially from those anticipated in forward-looking or past performance statements. IC Markets makes no representation or warranty and assumes no liability as to the accuracy or completeness of the information provided, nor any loss arising from any investment based on a recommendation, forecast or any information supplied by any third-party.

Potential bullish reversal?The Fiber (EUR/USD) is falling towards the pivot, which is a pullback support and could bounce to 1st resistance.
Pivot: 1.1453
1st Support: 1.1390
1st Resistance: 1.1534
Disclaimer:
The above opinions given constitute general market commentary, and do not constitute the opinion or advice of IC Markets or any form of personal or investment advice.
Any opinions, news, research, analyses, prices, other information, or links to third-party sites contained on this website are provided on an "as-is" basis, are intended only to be informative, is not an advice nor a recommendation, nor research, or a record of our trading prices, or an offer of, or solicitation for a transaction in any financial instrument and thus should not be treated as such. The information provided does not involve any specific investment objectives, financial situation and needs of any specific person who may receive it. Please be aware, that past performance is not a reliable indicator of future performance and/or results. Past Performance or Forward-looking scenarios based upon the reasonable beliefs of the third-party provider are not a guarantee of future performance. Actual results may differ materially from those anticipated in forward-looking or past performance statements. IC Markets makes no representation or warranty and assumes no liability as to the accuracy or completeness of the information provided, nor any loss arising from any investment based on a recommendation, forecast or any information supplied by any third-party.

Bullish reversal setup?EUR/JPY is falling towards the support level, which is a pullback support that lines up wth the 38.2% Fibonacci retracement and could bounce from this level to our take profit.
Entry: 176.64
Why we like it:
There is a pullback support that aligns with the 38.2% Fibonacci retracement.
Stop loss: 175.70
Why we like it:
There is a swing low support level.
Take profit: 177.55
Why we like it:
There is an overlap resistance that is slightly below the 61.8% Fibonacci retracement.
Enjoying your TradingView experience? Review us!
Please be advised that the information presented on TradingView is provided to Vantage (‘Vantage Global Limited’, ‘we’) by a third-party provider (‘Everest Fortune Group’). Please be reminded that you are solely responsible for the trading decisions on your account. There is a very high degree of risk involved in trading. Any information and/or content is intended entirely for research, educational and informational purposes only and does not constitute investment or consultation advice or investment strategy. The information is not tailored to the investment needs of any specific person and therefore does not involve a consideration of any of the investment objectives, financial situation or needs of any viewer that may receive it. Kindly also note that past performance is not a reliable indicator of future results. Actual results may differ materially from those anticipated in forward-looking or past performance statements. We assume no liability as to the accuracy or completeness of any of the information and/or content provided herein and the Company cannot be held responsible for any omission, mistake nor for any loss or damage including without limitation to any loss of profit which may arise from reliance on any information supplied by Everest Fortune Group.

Potential bearish drop off?EUR/NZD could rise towards the resistance level, which is an overlap resistance, and could reverse from this level to our take profit.
Entry: 2.03148
Why we like it:
There is an overap resistance level.
Stop loss: 2.03653
Why we like it:
There is a swing high resistance level.
Take profit: 2.02255
Why we like it:
There is a pullback support level that aligns with the 61.8% Fibonacci retracement.
Enjoying your TradingView experience? Review us!
Please be advised that the information presented on TradingView is provided to Vantage (‘Vantage Global Limited’, ‘we’) by a third-party provider (‘Everest Fortune Group’). Please be reminded that you are solely responsible for the trading decisions on your account. There is a very high degree of risk involved in trading. Any information and/or content is intended entirely for research, educational and informational purposes only and does not constitute investment or consultation advice or investment strategy. The information is not tailored to the investment needs of any specific person and therefore does not involve a consideration of any of the investment objectives, financial situation or needs of any viewer that may receive it. Kindly also note that past performance is not a reliable indicator of future results. Actual results may differ materially from those anticipated in forward-looking or past performance statements. We assume no liability as to the accuracy or completeness of any of the information and/or content provided herein and the Company cannot be held responsible for any omission, mistake nor for any loss or damage including without limitation to any loss of profit which may arise from reliance on any information supplied by Everest Fortune Group.

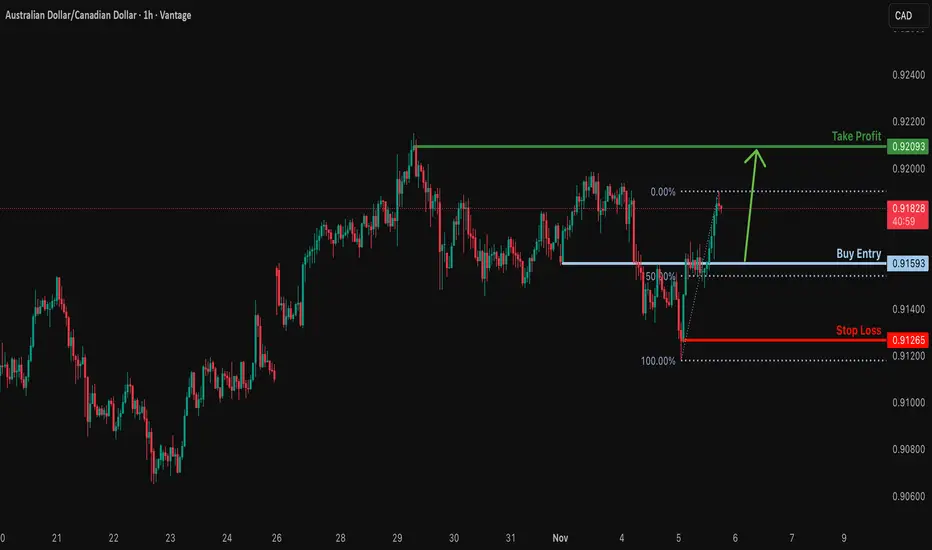
Bullish bounce off overlap support?AUD/CAD is falling towards the support level, which is a pullback support that is slightly above the 50% Fibonacci retracement and could bounce from this level to our take profit.
Entry: 0.91593
Why we like it:
There is a pullback support that is slightly above the 50% Fibonacci retracement.
Stop loss: 0.91265
Why we like it:
There is a swing low support level.
Take profit: 0.92093
Why we like it:
There is a swing resistance level.
Enjoying your TradingView experience? Review us!
Please be advised that the information presented on TradingView is provided to Vantage (‘Vantage Global Limited’, ‘we’) by a third-party provider (‘Everest Fortune Group’). Please be reminded that you are solely responsible for the trading decisions on your account. There is a very high degree of risk involved in trading. Any information and/or content is intended entirely for research, educational and informational purposes only and does not constitute investment or consultation advice or investment strategy. The information is not tailored to the investment needs of any specific person and therefore does not involve a consideration of any of the investment objectives, financial situation or needs of any viewer that may receive it. Kindly also note that past performance is not a reliable indicator of future results. Actual results may differ materially from those anticipated in forward-looking or past performance statements. We assume no liability as to the accuracy or completeness of any of the information and/or content provided herein and the Company cannot be held responsible for any omission, mistake nor for any loss or damage including without limitation to any loss of profit which may arise from reliance on any information supplied by Everest Fortune Group.
Bearish reversal off 50% Fibonacci resistnce?NZD/JPY is rising towards the resistance level, which serves as a pullback resistance that aligns with the 50% Fibonacci retracement and could reverse from this level to take a profit.
Entry: 87.50
Why we like it:
There is a pullback resistance that aligns with the 50% Fibonacci retracement
Stop loss: 88.13
Why we like it:
There is a pullback resistance that is slightly below the 78.6% Fibonacci retracement.
Take profit: 86.64
Why we like it:
There is a pullback support level.
Enjoying your TradingView experience? Review us!
Please be advised that the information presented on TradingView is provided to Vantage (‘Vantage Global Limited’, ‘we’) by a third-party provider (‘Everest Fortune Group’). Please be reminded that you are solely responsible for the trading decisions on your account. There is a very high degree of risk involved in trading. Any information and/or content is intended entirely for research, educational and informational purposes only and does not constitute investment or consultation advice or investment strategy. The information is not tailored to the investment needs of any specific person and therefore does not involve a consideration of any of the investment objectives, financial situation or needs of any viewer that may receive it. Kindly also note that past performance is not a reliable indicator of future results. Actual results may differ materially from those anticipated in forward-looking or past performance statements. We assume no liability as to the accuracy or completeness of any of the information and/or content provided herein and the Company cannot be held responsible for any omission, mistake nor for any loss or damage including without limitation to any loss of profit which may arise from reliance on any information supplied by Everest Fortune Group.

XAU/USD – Gold Forms New Liquidity Low, Buyers Return🔍 Market Context
Gold has completed a significant liquidity sweep around the 3,929 – 3,921 USD zone, clearing out the stop-losses of weak buyers before bouncing back strongly.
The bullish candle reaction at this zone indicates strong absorption from large capital flows, opening the possibility of forming a technical recovery wave towards the supply zone (OB – FVG) above.
In the short term, the market structure temporarily shifts to a bullish bias , as long as the price holds above this Liquidity Zone.
💎 Key Technical Zones
• Liquidity Sweep Zone: 3,929 – 3,921 USD → newly swept liquidity low, acting as main support.
• FVG 1: 3,951 – 3,959 USD → first target of the recovery wave.
• FVG 2: 3,977 – 3,985 USD → unfilled price balance zone.
• Order Block: 3,995 – 4,022 USD → strong supply resistance, expected reaction upon retest.
• Resistance Zone: 4,025 – 4,045 USD → watch for candle reactions to confirm upward momentum or reversal.
🎯 Trading Scenarios
1️⃣ BUY Setup – Liquidity Sweep Retest
• Entry: 3,932 – 3,922 USD (pullback to sweep zone)
• Stop Loss: below 3,912 USD
• Take Profit:
TP1: 3,965
TP2: 3,975
TP3: 3,987
TP4: 3,995
TP5: 4,022
➡️ “Buy the discount” strategy by Smart Money: buy after liquidity sweep to catch the technical rebound.
2️⃣ SELL Reaction – OB 4,022 USD
If the price approaches the OB 3,995 – 4,022 USD zone and shows reversal signals (strong rejection, bearish engulfing candle),
→ consider opening a short-term sell (counter-trend scalp)
• Entry: 4,015 – 4,020
• SL: 4,030
• TP: 3,990 → 3,970 → 3,940
⚙️ Market Structure
• Temporary uptrend line remains intact.
• Liquidity has been swept at the old low → confirming bullish ChoCH .
• Confluence structure of FVG + OB + trendline creates favorable conditions for recovery momentum.
📈 Summary
Gold has completed the old low liquidity sweep and is in a technical recovery phase.
As long as the price stays above 3,921 USD, the short-term trend leans towards bullish retracement .
Observe price reactions at the FVG 3,975 – 3,995 USD zone to determine buyer strength.
🔥 “Liquidity fuels direction — once the weak hands are out, the real move begins.”
⏰ Timeframe: 1H
📅 Updated: 05/11/2025
✍️ Analysis by: Captain Vincent

Bitcoin Rebounds Toward 103,500 Target ZoneBitcoin (BTC/USDT) on the 1-hour chart shows a rebound from the support zone around 99,900, forming a bullish move toward the target area at 103,500. A break above the mid-resistance zone could confirm further upside momentum.

XAUUSDHello Traders! 👋
What are your thoughts on GOLD?
Gold has entered a range-bound phase after making a new high followed by a sharp correction.
The price is currently moving sideways between key support and resistance levels, and as long as these zones remain intact, choppy and indecisive movements are expected to continue.
We expect gold to first form a short-term upward correction toward the identified resistance zone, which would also act as a pullback to the previously broken structure.
Once this pullback is complete, the price may resume its downward move toward the lower support targets.
If gold breaks the support zone before completing the upward correction, the bearish scenario will be confirmed without any significant retracement, leading to a deeper decline.
Overall, the market remains range-bound and volatile, and it’s best to wait for a breakout from key levels before taking new positions.
Don’t forget to like and share your thoughts in the comments! ❤️

GBP/JPY | Bearish Bias Below Pivot ZoneThe market currently maintains a Bearish Bias (a tendency for the price to fall) as the pair has stabilized below the Pivot at 201.22. Stability below this level signifies seller dominance.
The analysis suggests a corrective move (a temporary bounce) might occur back towards the $201.22$ Pivot to test it as strong Resistance (an upper barrier), before any further decline resumes.
Primary Scenario: Bearish Continuation (While Below 201.22)
As long as the price remains below the $201.22$ Pivot level:Bearish momentum is expected to extend.
The downside potential is maintained, and traders will target the following Support (Lower Support Line) levels:
- Initial Target: $199.29
- Intermediate Target: $198.01
- Main Target: $196.15$
In essence, if $201.22$ holds as Resistance, selling pressure is likely to push the price towards these lower support levels.
Alternative Scenario: Bullish Reversal (Above 201.22)
If a convincing breakout and stabilization occurs above the $201.22$ Pivot level:This condition could signal a Bullish reversal (a tendency for the price to rise).
Market momentum would shift to the upside, opening the path towards the next Resistance (Upper Barrier Line) levels:
- Initial Upside Target: $203.43
- Further Upside Target: $204.88
