USDCHF | Bearish reversal confirmedUSD/CHF has rejected off the sell entry which is a pullback resistance and could drop from this level to the downside.
Sell entry is at 0.7965, which is a pullback resistance.
Stop loss is at 0.7977, which is a swinf high resistance.
Take profit is at 0.7936, which acts as a pullback support that aligns with the 100% Fibonacci extension.
High Risk Investment Warning
Trading Forex/CFDs on margin carries a high level of risk and may not be suitable for all investors. Leverage can work against you.
Stratos Markets Limited (tradu.com ):
CFDs are complex instruments and come with a high risk of losing money rapidly due to leverage. 65% of retail investor accounts lose money when trading CFDs with this provider. You should consider whether you understand how CFDs work and whether you can afford to take the high risk of losing your money.
Stratos Europe Ltd (tradu.com ):
CFDs are complex instruments and come with a high risk of losing money rapidly due to leverage. 66% of retail investor accounts lose money when trading CFDs with this provider. You should consider whether you understand how CFDs work and whether you can afford to take the high risk of losing your money.
Stratos Global LLC (tradu.com ):
Losses can exceed deposits.
Please be advised that the information presented on TradingView is provided to Tradu (‘Company’, ‘we’) by a third-party provider (‘TFA Global Pte Ltd’). Please be reminded that you are solely responsible for the trading decisions on your account. There is a very high degree of risk involved in trading. Any information and/or content is intended entirely for research, educational and informational purposes only and does not constitute investment or consultation advice or investment strategy. The information is not tailored to the investment needs of any specific person and therefore does not involve a consideration of any of the investment objectives, financial situation or needs of any viewer that may receive it. Kindly also note that past performance is not a reliable indicator of future results. Actual results may differ materially from those anticipated in forward-looking or past performance statements. We assume no liability as to the accuracy or completeness of any of the information and/or content provided herein and the Company cannot be held responsible for any omission, mistake nor for any loss or damage including without limitation to any loss of profit which may arise from reliance on any information supplied by TFA Global Pte Ltd.
The speaker(s) is neither an employee, agent nor representative of Tradu and is therefore acting independently. The opinions given are their own, constitute general market commentary, and do not constitute the opinion or advice of Tradu or any form of personal or investment advice. Tradu neither endorses nor guarantees offerings of third-party speakers, nor is Tradu responsible for the content, veracity or opinions of third-party speakers, presenters or participants.
Forexsignals

GBPUSD | Possible bearish reversalGBP/USD is reacting off the sell wntry, which acts as a pullback resistance and could fall to the downside.
Sell entry is at 1.3570, which is a pullback resistance.
Stop loss is 1.3586, which is a swing high resistance.
Take profit is at 1.3539, which is a pullback support.
High Risk Investment Warning
Trading Forex/CFDs on margin carries a high level of risk and may not be suitable for all investors. Leverage can work against you.
Stratos Markets Limited (tradu.com ):
CFDs are complex instruments and come with a high risk of losing money rapidly due to leverage. 65% of retail investor accounts lose money when trading CFDs with this provider. You should consider whether you understand how CFDs work and whether you can afford to take the high risk of losing your money.
Stratos Europe Ltd (tradu.com ):
CFDs are complex instruments and come with a high risk of losing money rapidly due to leverage. 66% of retail investor accounts lose money when trading CFDs with this provider. You should consider whether you understand how CFDs work and whether you can afford to take the high risk of losing your money.
Stratos Global LLC (tradu.com ):
Losses can exceed deposits.
Please be advised that the information presented on TradingView is provided to Tradu (‘Company’, ‘we’) by a third-party provider (‘TFA Global Pte Ltd’). Please be reminded that you are solely responsible for the trading decisions on your account. There is a very high degree of risk involved in trading. Any information and/or content is intended entirely for research, educational and informational purposes only and does not constitute investment or consultation advice or investment strategy. The information is not tailored to the investment needs of any specific person and therefore does not involve a consideration of any of the investment objectives, financial situation or needs of any viewer that may receive it. Kindly also note that past performance is not a reliable indicator of future results. Actual results may differ materially from those anticipated in forward-looking or past performance statements. We assume no liability as to the accuracy or completeness of any of the information and/or content provided herein and the Company cannot be held responsible for any omission, mistake nor for any loss or damage including without limitation to any loss of profit which may arise from reliance on any information supplied by TFA Global Pte Ltd.
The speaker(s) is neither an employee, agent nor representative of Tradu and is therefore acting independently. The opinions given are their own, constitute general market commentary, and do not constitute the opinion or advice of Tradu or any form of personal or investment advice. Tradu neither endorses nor guarantees offerings of third-party speakers, nor is Tradu responsible for the content, veracity or opinions of third-party speakers, presenters or participants.

EURUSD | Bullish bounce from supportEUR/USD has bounced off the buy entry which is a pullback support that aligns with the 38.2% Fibonacci retracement and could potentially rise from this level to the upside.
Buy entry is at 1.1725, which is a pullbacksupport thast aligns with the 38.2% FIbonacci retracement.
Stop loss is at 1.1703, which is a pullback support.
Take profit is at 1.1779, which is a swing high resistance that is slighl yabive the 161.8% Fibonacci extension.
High Risk Investment Warning
Trading Forex/CFDs on margin carries a high level of risk and may not be suitable for all investors. Leverage can work against you.
Stratos Markets Limited (tradu.com ):
CFDs are complex instruments and come with a high risk of losing money rapidly due to leverage. 65% of retail investor accounts lose money when trading CFDs with this provider. You should consider whether you understand how CFDs work and whether you can afford to take the high risk of losing your money.
Stratos Europe Ltd (tradu.com ):
CFDs are complex instruments and come with a high risk of losing money rapidly due to leverage. 66% of retail investor accounts lose money when trading CFDs with this provider. You should consider whether you understand how CFDs work and whether you can afford to take the high risk of losing your money.
Stratos Global LLC (tradu.com ):
Losses can exceed deposits.
Please be advised that the information presented on TradingView is provided to Tradu (‘Company’, ‘we’) by a third-party provider (‘TFA Global Pte Ltd’). Please be reminded that you are solely responsible for the trading decisions on your account. There is a very high degree of risk involved in trading. Any information and/or content is intended entirely for research, educational and informational purposes only and does not constitute investment or consultation advice or investment strategy. The information is not tailored to the investment needs of any specific person and therefore does not involve a consideration of any of the investment objectives, financial situation or needs of any viewer that may receive it. Kindly also note that past performance is not a reliable indicator of future results. Actual results may differ materially from those anticipated in forward-looking or past performance statements. We assume no liability as to the accuracy or completeness of any of the information and/or content provided herein and the Company cannot be held responsible for any omission, mistake nor for any loss or damage including without limitation to any loss of profit which may arise from reliance on any information supplied by TFA Global Pte Ltd.
The speaker(s) is neither an employee, agent nor representative of Tradu and is therefore acting independently. The opinions given are their own, constitute general market commentary, and do not constitute the opinion or advice of Tradu or any form of personal or investment advice. Tradu neither endorses nor guarantees offerings of third-party speakers, nor is Tradu responsible for the content, veracity or opinions of third-party speakers, presenters or participants.

Bullish bounce from support?The Kiwi (NZD/USD) is falling towards the pivot which has been identified as a pullback support and could bounce to the 1st resistance.
pivot: 0.5902
1st Support: 0.5789
1st Resistance: 0.6122
Disclaimer:
The above opinions given constitute general market commentary, and do not constitute the opinion or advice of IC Markets or any form of personal or investment advice.
Any opinions, news, research, analyses, prices, other information, or links to third-party sites contained on this website are provided on an "as-is" basis, are intended only to be informative, is not an advice nor a recommendation, nor research, or a record of our trading prices, or an offer of, or solicitation for a transaction in any financial instrument and thus should not be treated as such. The information provided does not involve any specific investment objectives, financial situation and needs of any specific person who may receive it. Please be aware, that past performance is not a reliable indicator of future performance and/or results. Past Performance or Forward-looking scenarios based upon the reasonable beliefs of the third-party provider are not a guarantee of future performance. Actual results may differ materially from those anticipated in forward-looking or past performance statements. IC Markets makes no representation or warranty and assumes no liability as to the accuracy or completeness of the information provided, nor any loss arising from any investment based on a recommendation, forecast or any information supplied by any third-party.

Potential bearish reversal for the Aussie?The price is reacting off the pivot and could reverse to the 1st support which acts as an overlap support.
Pivot: 0.6644
1st Support: 0.6452
1st Resistance: 0.6819
Disclaimer:
The above opinions given constitute general market commentary, and do not constitute the opinion or advice of IC Markets or any form of personal or investment advice.
Any opinions, news, research, analyses, prices, other information, or links to third-party sites contained on this website are provided on an "as-is" basis, are intended only to be informative, is not an advice nor a recommendation, nor research, or a record of our trading prices, or an offer of, or solicitation for a transaction in any financial instrument and thus should not be treated as such. The information provided does not involve any specific investment objectives, financial situation and needs of any specific person who may receive it. Please be aware, that past performance is not a reliable indicator of future performance and/or results. Past Performance or Forward-looking scenarios based upon the reasonable beliefs of the third-party provider are not a guarantee of future performance. Actual results may differ materially from those anticipated in forward-looking or past performance statements. IC Markets makes no representation or warranty and assumes no liability as to the accuracy or completeness of the information provided, nor any loss arising from any investment based on a recommendation, forecast or any information supplied by any third-party.

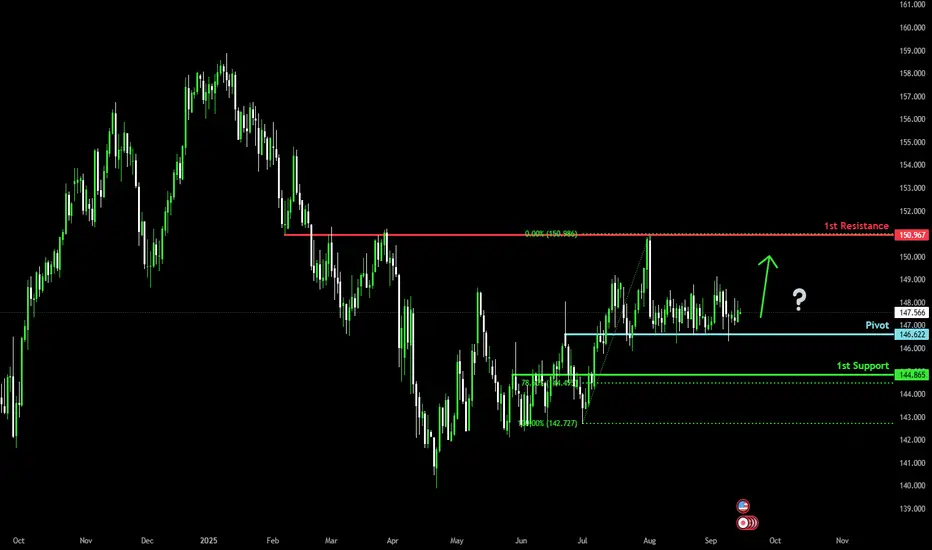
Could price be setting up for a bullish reversal?USD/JPY is falling towards the pivot, which is an overlap support and could bounce to the 1st resistance.
Pivot: 146.62
1st Support: 144.86
1st Resistance: 150.96
Disclaimer:
The above opinions given constitute general market commentary, and do not constitute the opinion or advice of IC Markets or any form of personal or investment advice.
Any opinions, news, research, analyses, prices, other information, or links to third-party sites contained on this website are provided on an "as-is" basis, are intended only to be informative, is not an advice nor a recommendation, nor research, or a record of our trading prices, or an offer of, or solicitation for a transaction in any financial instrument and thus should not be treated as such. The information provided does not involve any specific investment objectives, financial situation and needs of any specific person who may receive it. Please be aware, that past performance is not a reliable indicator of future performance and/or results. Past Performance or Forward-looking scenarios based upon the reasonable beliefs of the third-party provider are not a guarantee of future performance. Actual results may differ materially from those anticipated in forward-looking or past performance statements. IC Markets makes no representation or warranty and assumes no liability as to the accuracy or completeness of the information provided, nor any loss arising from any investment based on a recommendation, forecast or any information supplied by any third-party.
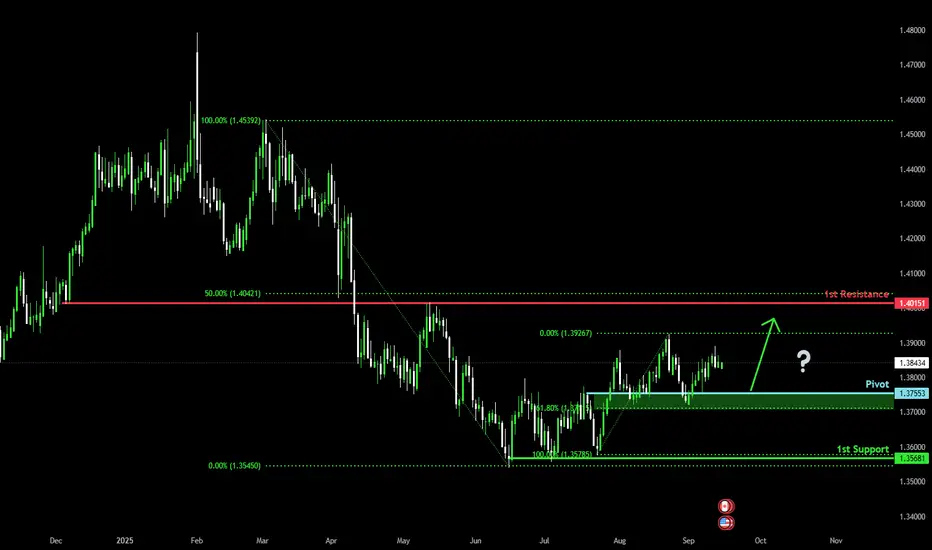
Price rebounds bullishly from key support?The Loonie (USD/CAD) is falling towards the pivot, which has been identified as an overlap support and could bounce to the 1st resistance, which is slightly below the 50% Fibonacci retracement.
Pivot: 1.3755
1st Support: 1.3568
1st Resistance: 1.4015
Disclaimer:
The above opinions given constitute general market commentary, and do not constitute the opinion or advice of IC Markets or any form of personal or investment advice.
Any opinions, news, research, analyses, prices, other information, or links to third-party sites contained on this website are provided on an "as-is" basis, are intended only to be informative, is not an advice nor a recommendation, nor research, or a record of our trading prices, or an offer of, or solicitation for a transaction in any financial instrument and thus should not be treated as such. The information provided does not involve any specific investment objectives, financial situation and needs of any specific person who may receive it. Please be aware, that past performance is not a reliable indicator of future performance and/or results. Past Performance or Forward-looking scenarios based upon the reasonable beliefs of the third-party provider are not a guarantee of future performance. Actual results may differ materially from those anticipated in forward-looking or past performance statements. IC Markets makes no representation or warranty and assumes no liability as to the accuracy or completeness of the information provided, nor any loss arising from any investment based on a recommendation, forecast or any information supplied by any third-party.
Bearish continuation setup?The Swissie (USD/CHF) is rising towards the pivot and could drop to the pullback support.
Pivot: 0.8027
1st Suport: 0.7894
1st Resistance: 0.8169
Disclaimer:
The above opinions given constitute general market commentary, and do not constitute the opinion or advice of IC Markets or any form of personal or investment advice.
Any opinions, news, research, analyses, prices, other information, or links to third-party sites contained on this website are provided on an "as-is" basis, are intended only to be informative, is not an advice nor a recommendation, nor research, or a record of our trading prices, or an offer of, or solicitation for a transaction in any financial instrument and thus should not be treated as such. The information provided does not involve any specific investment objectives, financial situation and needs of any specific person who may receive it. Please be aware, that past performance is not a reliable indicator of future performance and/or results. Past Performance or Forward-looking scenarios based upon the reasonable beliefs of the third-party provider are not a guarantee of future performance. Actual results may differ materially from those anticipated in forward-looking or past performance statements. IC Markets makes no representation or warranty and assumes no liability as to the accuracy or completeness of the information provided, nor any loss arising from any investment based on a recommendation, forecast or any information supplied by any third-party.

Bearish reversal setup?The Cable (GBP/USD) is rising towards the pivot which is a pullback resistance and could reverse to the 1st support, which acts as an overlap support.
Pivot: 1.3616
1st Support: 1.3367
1st Resistance: 1.3791
Disclaimer:
The above opinions given constitute general market commentary, and do not constitute the opinion or advice of IC Markets or any form of personal or investment advice.
Any opinions, news, research, analyses, prices, other information, or links to third-party sites contained on this website are provided on an "as-is" basis, are intended only to be informative, is not an advice nor a recommendation, nor research, or a record of our trading prices, or an offer of, or solicitation for a transaction in any financial instrument and thus should not be treated as such. The information provided does not involve any specific investment objectives, financial situation and needs of any specific person who may receive it. Please be aware, that past performance is not a reliable indicator of future performance and/or results. Past Performance or Forward-looking scenarios based upon the reasonable beliefs of the third-party provider are not a guarantee of future performance. Actual results may differ materially from those anticipated in forward-looking or past performance statements. IC Markets makes no representation or warranty and assumes no liability as to the accuracy or completeness of the information provided, nor any loss arising from any investment based on a recommendation, forecast or any information supplied by any third-party.

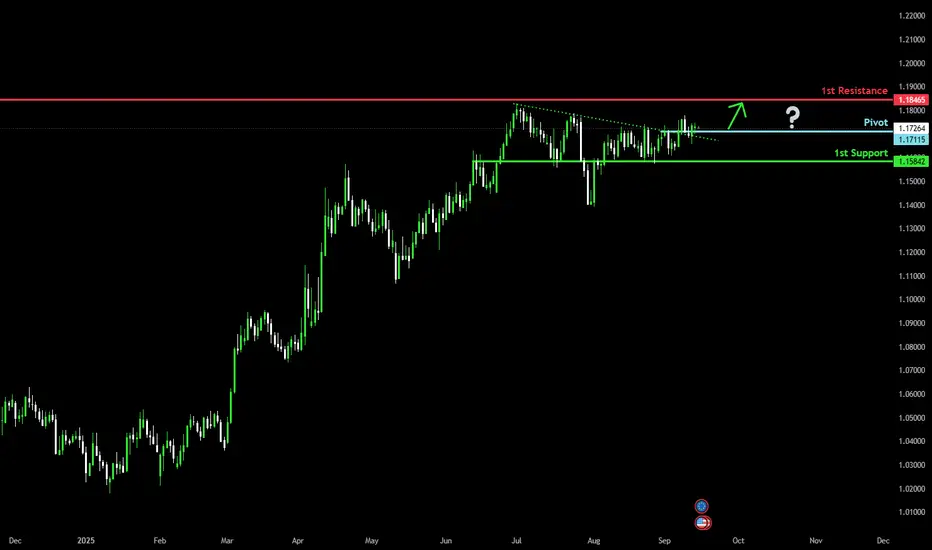
Bullish breakout in progress?The Fiber (EUR/USD) has broken out of the pivot which acts as a pullback support and could rise to the 1st resistance.
Pivot: 1.1711
1st Support: 1.1584
1st Resistance: 1.1846
Disclaimer:
The above opinions given constitute general market commentary, and do not constitute the opinion or advice of IC Markets or any form of personal or investment advice.
Any opinions, news, research, analyses, prices, other information, or links to third-party sites contained on this website are provided on an "as-is" basis, are intended only to be informative, is not an advice nor a recommendation, nor research, or a record of our trading prices, or an offer of, or solicitation for a transaction in any financial instrument and thus should not be treated as such. The information provided does not involve any specific investment objectives, financial situation and needs of any specific person who may receive it. Please be aware, that past performance is not a reliable indicator of future performance and/or results. Past Performance or Forward-looking scenarios based upon the reasonable beliefs of the third-party provider are not a guarantee of future performance. Actual results may differ materially from those anticipated in forward-looking or past performance statements. IC Markets makes no representation or warranty and assumes no liability as to the accuracy or completeness of the information provided, nor any loss arising from any investment based on a recommendation, forecast or any information supplied by any third-party.
Bearish drop formation?The US Dollar Index (DXY) is rising towards the pivot and could reverse to the 1st support.
Pivot: 98.63
1st Support: 97.12
1st Resistance: 100.21
Disclaimer:
The above opinions given constitute general market commentary, and do not constitute the opinion or advice of IC Markets or any form of personal or investment advice.
Any opinions, news, research, analyses, prices, other information, or links to third-party sites contained on this website are provided on an "as-is" basis, are intended only to be informative, is not an advice nor a recommendation, nor research, or a record of our trading prices, or an offer of, or solicitation for a transaction in any financial instrument and thus should not be treated as such. The information provided does not involve any specific investment objectives, financial situation and needs of any specific person who may receive it. Please be aware, that past performance is not a reliable indicator of future performance and/or results. Past Performance or Forward-looking scenarios based upon the reasonable beliefs of the third-party provider are not a guarantee of future performance. Actual results may differ materially from those anticipated in forward-looking or past performance statements. IC Markets makes no representation or warranty and assumes no liability as to the accuracy or completeness of the information provided, nor any loss arising from any investment based on a recommendation, forecast or any information supplied by any third-party.

Dow Jones Industrial Average Possible outlook Week 38 ATHAre we ready for the new All Time High? US30 possibly aiming to correct during the early days of the week prior the anticipated bullish run.

Bullish bounce off 50% Fibonacci support?NZD/USD is falling towards the support level which is an overlap support that aligns with the 50% Fibonacci retracement and could bounce from this level to our take profit.
Entry: 0.5913
Why we like it:
There is an overlap support that aligns with the 50% Fibonacci retracement.
Stop loss: 0.5882
Why we like it:
There is an overlap support that is slightly below the 61.8% Fibonacci retracement.
Take profit: 0.5985
Why we like it:
There is a swing high resistance level.
Enjoying your TradingView experience? Review us!
Please be advised that the information presented on TradingView is provided to Vantage (‘Vantage Global Limited’, ‘we’) by a third-party provider (‘Everest Fortune Group’). Please be reminded that you are solely responsible for the trading decisions on your account. There is a very high degree of risk involved in trading. Any information and/or content is intended entirely for research, educational and informational purposes only and does not constitute investment or consultation advice or investment strategy. The information is not tailored to the investment needs of any specific person and therefore does not involve a consideration of any of the investment objectives, financial situation or needs of any viewer that may receive it. Kindly also note that past performance is not a reliable indicator of future results. Actual results may differ materially from those anticipated in forward-looking or past performance statements. We assume no liability as to the accuracy or completeness of any of the information and/or content provided herein and the Company cannot be held responsible for any omission, mistake nor for any loss or damage including without limitation to any loss of profit which may arise from reliance on any information supplied by Everest Fortune Group.

Bullish continuation?AUD/USD is falling towards the support level, which is a pullback support that is slightly below the 23.6% Fibonacci retracement and could bounce from this level to our take profit.
Entry: 0.6619
Why we like it:
There is a pullback support that is slightly below the 23.6% Fibonacci retracement.
Stop loss: 0.6568
Why we like it:
There is a pullback support that aligns with the 61.8% Fibonacci retracement.
Take profit: 0.6690
Why we like it:
There is a pullback resistance.
Enjoying your TradingView experience? Review us!
Please be advised that the information presented on TradingView is provided to Vantage (‘Vantage Global Limited’, ‘we’) by a third-party provider (‘Everest Fortune Group’). Please be reminded that you are solely responsible for the trading decisions on your account. There is a very high degree of risk involved in trading. Any information and/or content is intended entirely for research, educational and informational purposes only and does not constitute investment or consultation advice or investment strategy. The information is not tailored to the investment needs of any specific person and therefore does not involve a consideration of any of the investment objectives, financial situation or needs of any viewer that may receive it. Kindly also note that past performance is not a reliable indicator of future results. Actual results may differ materially from those anticipated in forward-looking or past performance statements. We assume no liability as to the accuracy or completeness of any of the information and/or content provided herein and the Company cannot be held responsible for any omission, mistake nor for any loss or damage including without limitation to any loss of profit which may arise from reliance on any information supplied by Everest Fortune Group.

Bearish reversal off?USD/JPY has rejected the resistance level, which serves as a pullback resistance and could potentially drop from this level to our take-profit.
Entry: 147.95
Why we like it:
There is a pullback resistance level.
Stop loss: 148.44
Why we like it:
There is a swing high resistance that aligns with the 127.2% Fibonacci extension.
Take profit: 146.79
Why we like it:
There is a pullback support that is slightly above the 127.2% Fibonacci extension.
Enjoying your TradingView experience? Review us!
Please be advised that the information presented on TradingView is provided to Vantage (‘Vantage Global Limited’, ‘we’) by a third-party provider (‘Everest Fortune Group’). Please be reminded that you are solely responsible for the trading decisions on your account. There is a very high degree of risk involved in trading. Any information and/or content is intended entirely for research, educational and informational purposes only and does not constitute investment or consultation advice or investment strategy. The information is not tailored to the investment needs of any specific person and therefore does not involve a consideration of any of the investment objectives, financial situation or needs of any viewer that may receive it. Kindly also note that past performance is not a reliable indicator of future results. Actual results may differ materially from those anticipated in forward-looking or past performance statements. We assume no liability as to the accuracy or completeness of any of the information and/or content provided herein and the Company cannot be held responsible for any omission, mistake nor for any loss or damage including without limitation to any loss of profit which may arise from reliance on any information supplied by Everest Fortune Group.

Potential bearish drop off?USD/CAD has rejected the resistance level, which serves as a pullback resistance that aligns with the 50% Fibonacci retracement, and could potentially drop from this level to our take-profit target.
Entry: 1.3858
Why we like it:
There is a pullback resistance that aligns with the 50% Fibonacci retracement.
Stop loss: 1.3888
Why we like it:
There is a swing high resistance level.
Take profit: 1.3809
Why we like it:
There is a pullback support that aligns with the 78.6% Fibonacci projection.
Enjoying your TradingView experience? Review us!
Please be advised that the information presented on TradingView is provided to Vantage (‘Vantage Global Limited’, ‘we’) by a third-party provider (‘Everest Fortune Group’). Please be reminded that you are solely responsible for the trading decisions on your account. There is a very high degree of risk involved in trading. Any information and/or content is intended entirely for research, educational and informational purposes only and does not constitute investment or consultation advice or investment strategy. The information is not tailored to the investment needs of any specific person and therefore does not involve a consideration of any of the investment objectives, financial situation or needs of any viewer that may receive it. Kindly also note that past performance is not a reliable indicator of future results. Actual results may differ materially from those anticipated in forward-looking or past performance statements. We assume no liability as to the accuracy or completeness of any of the information and/or content provided herein and the Company cannot be held responsible for any omission, mistake nor for any loss or damage including without limitation to any loss of profit which may arise from reliance on any information supplied by Everest Fortune Group.

NZD/USD The Kiwi Heist Plan – Breakout or Bust?🦘 NZD/USD "The Kiwi" Forex Bank Heist Plan (Swing/Day Trade) 🦘
🎯 MISSION: BEARISH (PENDING ORDER HEIST) 🎯
📍 THE ENTRY PLAN: THE BREAKOUT TRIGGER
⚡ MAIN ENTRY SIGNAL: Wait for the BREAKOUT & CLOSE below 0.58000! This is when the bank vault door gets cracked! ⚡
🧨 THIEF'S LAYERED ENTRY STRATEGY: Don't go all in! We use multiple SELL LIMIT orders to scale in like a pro. After the breakout, set your heist layers at:
1st Layer (Safe Loot): 0.58100
2nd Layer (Main Loot): 0.58200
3rd Layer (Ballsy Loot): 0.58400
🤑 You can add more layers based on your own risk appetite! This is the thief's way (DCA/Layering).
🛑 THE ESCAPE ROUTE: STOP LOSS
👮♂️ THIEF OG's STOP LOSS: Our getaway car is parked at 0.58800. Place your SL ONLY AFTER the 0.58000 breakout is confirmed!
📢 Attention all Thieves & Robbers: Adjust your final SL based on your own risk management, lot size, and how many layers you used! Protect your capital! 👊
💰 THE FINAL TARGET: CASH OUT & ESCAPE
🚨 Police Barricade Ahead! Don't get greedy! The mission is to escape with the stolen money at 0.57000! 🚨
🔊 THIEF'S LOOTING MANUAL (READ THIS!):
🚨 Set a CHART ALERT at 0.58000! Don't miss the heist signal!
📰 NEWS = POLICE PATROLS! Avoid opening new trades during high-impact news. It increases volatility and risk!
🔐 Manage Your Position! This is your key to survival. Use proper risk/reward ratios.
💖 SUPPORT THE HEIST CREW!
💥 SMASH THAT LIKE & BOOST BUTTON! 💥
It fuels our next robbery plan! Let's make stealing money from the market look EASY! 🤑🚀
I'll see you on the next heist, Thief! Stay sharp! 🐱👤🤝

EURAUD: Bullish Climb to 1.80257?FX:EURAUD is setting up for a bullish move on the 4-hour chart , with an entry zone between 1.78241-1.78535 near a key support level.
The target range of 1.79997-1.80257 aligns with the next resistance, offering strong upside potential. Set a stop loss on a close below 1.78 to manage risk effectively.
A break above 1.786 with solid volume could confirm this climb, driven by EUR strength and AUD softness. Watch Eurozone data! 💡
📝 Trade Plan:
✅ Entry Zone: 1.78241 – 1.78535 (support area)
❌ Stop Loss: Daily close below 1.7800 to manage risk
🎯 Target Zone: 1.79997 – 1.80257 (next resistance level)
Ready for this push? Drop your take below! 👇

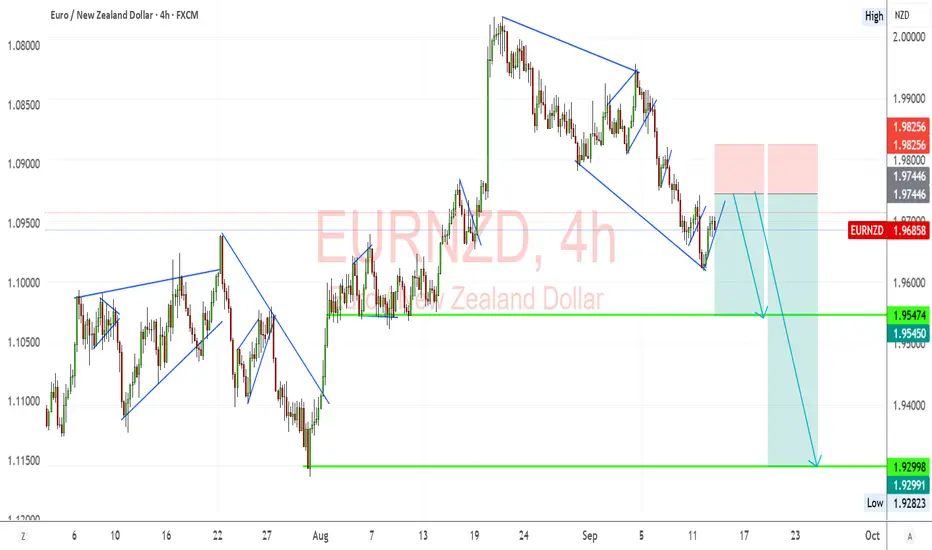
EURNZD Bears Eye Deeper Pullback After RejectionEURNZD has rolled over from the 1.98 region after repeated rejection, and sellers are starting to reassert control. The broader pattern suggests downside momentum is building, especially as NZD gains modest support from improving risk sentiment and firmer commodity tones, while the euro remains pressured by soft growth expectations. A break toward key supports looks increasingly likely if sellers can maintain control below resistance.
Current Bias
Bearish – momentum favors a push lower as rallies continue to stall.
Key Fundamental Drivers
Eurozone: Weak economic growth, dovish ECB tone, and sluggish demand weigh on the euro.
New Zealand: Better export data and steady RBNZ policy provide NZD with relative stability.
Global backdrop: Commodity resilience (particularly dairy) underpins NZD, while euro lags on recession fears.
Macro Context
Interest rates: The ECB is expected to remain cautious with potential for further cuts if conditions deteriorate. The RBNZ, while not hawkish, has less urgency to ease, leaving NZD relatively supported.
Economic growth: Europe’s slowdown vs. New Zealand’s more resilient external sector tilts fundamentals toward NZD strength.
Geopolitical: Trade disputes and tariff headlines continue to weigh more on EUR than NZD.
Primary Risk to the Trend
A surprise hawkish ECB tone, stronger euro area inflation data, or sudden risk-off flows could reverse NZD’s advantage and lift EURNZD higher.
Most Critical Upcoming News/Event
Eurozone CPI and ECB commentary for signs of policy adjustments.
NZ GDP/Trade balance data to gauge whether the NZD can maintain momentum.
Leader/Lagger Dynamics
EURNZD often acts as a lagger, taking cues from broader EUR direction (especially EURUSD and EURAUD). NZD’s correlation with risk assets and AUD also means that AUDNZD and global commodity moves tend to lead shifts in EURNZD.
Key Levels
Support Levels: 1.9547, 1.9300
Resistance Levels: 1.9745, 1.9825
Stop Loss (SL): 1.9825 (above resistance)
Take Profit (TP): 1.9300 (major support)
Summary: Bias and Watchpoints
EURNZD bias is bearish with SL at 1.9825 and TP at 1.9300. The euro continues to struggle with growth concerns and a dovish ECB, while NZD draws support from relative macro stability and firmer commodities. The key watchpoints are eurozone inflation and ECB commentary, as any hawkish surprise could trigger a rebound. For now, downside momentum favors a continuation toward 1.9547 and potentially 1.9300.
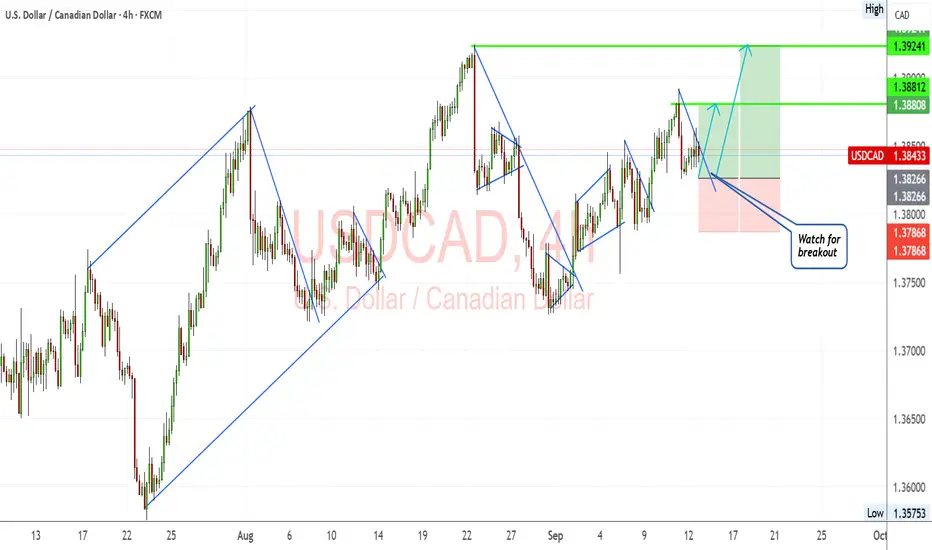
USDCAD Breakout Watch: Bulls Eye 1.3920 After Retesting SupportUSDCAD is coiling for a potential breakout, with buyers defending the 1.3820–1.3840 support zone and eyeing higher levels. The chart shows repeated higher lows, and fundamentals are aligning in favor of the dollar as the Canadian side faces pressure from weaker data and oil volatility. The setup is building momentum for a push toward 1.3920 if the breakout materializes.
Current Bias
Bullish – USD strength and Canadian headwinds support upside continuation.
Key Fundamental Drivers
Federal Reserve: Slower pace of cuts compared to expectations keeps USD attractive.
Bank of Canada: Market pricing leans heavily toward further easing after weak jobs data and slowing growth.
Oil Prices: WTI struggles below $65, weighing on CAD’s commodity-linked appeal.
Trade balance: Canada’s recent deficits add to pressure on CAD.
Macro Context
Interest rates: Fed cautious on cuts; BoC more dovish, widening policy divergence.
Economic growth: Canadian economy showing contraction in GDP and weaker labor data, while US growth remains firmer.
Commodity flows: Oil demand remains uncertain, keeping CAD on the defensive.
Geopolitical: Trade tensions and US tariffs add to USD safe-haven appeal, further denting CAD sentiment.
Primary Risk to the Trend
A strong oil rebound or a surprisingly hawkish BoC stance could support CAD and limit upside in USDCAD.
Most Critical Upcoming News/Event
Canada CPI and BoC decision – key for confirming further CAD weakness.
US CPI and Fed communication – will guide whether USD keeps its bid.
Leader/Lagger Dynamics
USDCAD often acts as a lagger to broad USD moves (particularly following EURUSD and DXY). However, it can lead CAD crosses like CADJPY and AUDCAD when oil-driven moves accelerate.
Key Levels
Support Levels: 1.3820, 1.3785
Resistance Levels: 1.3880, 1.3920
Stop Loss (SL): 1.3785 (below structural support)
Take Profit (TP): 1.3920 (major resistance zone)
Summary: Bias and Watchpoints
USDCAD is consolidating with buyers eyeing an upside breakout. The bias remains bullish, with SL at 1.3785 protecting against downside failure and TP at 1.3920 offering a clean upside target. The divergence between a cautious Fed and a dovish BoC, combined with oil weakness, tilts the balance in favor of USD strength. The key watchpoints are Canada’s CPI and BoC policy direction, which could either accelerate the breakout or disrupt the setup.
EURUSD Testing the Wedge, Eyes on Breakdown PotentialPrice action on EURUSD is coiling within a broad ascending wedge, and momentum looks heavy near the upper bound. The repeated rejections at resistance highlight fading bullish energy, and with fundamentals aligning toward USD resilience, the pair could be preparing for a downside break. Let’s break this down step by step.
Current Bias
Bearish, price action signals downside risk as EUR/USD fails to sustain momentum at wedge resistance and approaches critical support.
Key Fundamental Drivers
ECB stance: Recent commentary (Patsalides, Kazaks, Simkus) shows caution. ECB members see risks balanced but stress that the next move could still be higher if needed.
Fed policy: US data (labor cooling, ISM Services expansion, sticky inflation) keeps Fed in cautious easing mode. The dollar still benefits from safe-haven demand and relative growth strength.
Yield spreads: US Treasury yields remain elevated compared to Eurozone bonds, keeping USD attractive.
Macro Context
Interest rates: ECB signals that cuts are not urgent, while the Fed eyes gradual easing. The relative policy stance favors USD stability.
Economic growth: Eurozone growth data remains fragile (Germany flat, France stable, Italy soft). US shows moderate but slowing growth.
Commodity flows: Energy prices are softer, reducing pressure on the Eurozone’s import bill but also reflecting weaker global demand.
Geopolitical: Tariffs, EU-US trade tensions, and energy security risks remain an overhang.
Primary Risk to the Trend
A dovish Fed pivot or softer US CPI could weaken the USD, pushing EUR/USD higher through wedge resistance. Conversely, if Eurozone inflation flares up again, the ECB could delay cuts, temporarily supporting the euro.
Most Critical Upcoming News/Event
US CPI release – key for Fed trajectory.
ECB meeting minutes and Lagarde’s speeches – signals on rate path.
Eurozone PMIs – fresh check on growth momentum.
Leader/Lagger Dynamics
EUR/USD is a leader within euro crosses, often setting directional bias for EUR/JPY, EUR/GBP, and EUR/CHF. It also tracks USD momentum, so it can act as a lagger to US data-driven moves that first show up in DXY.
Key Levels
Support Levels: 1.1692, 1.1585
Resistance Levels: 1.1746, 1.1788
Stop Loss (SL): 1.1788 (above wedge top)
Take Profit (TP): 1.1585 (major downside target if wedge breaks)
Summary: Bias and Watchpoints
EURUSD is tilting bearish as it stalls at wedge resistance and fundamentals lean toward USD strength. The bias points to a potential break lower, with downside targets near 1.1692 and ultimately 1.1585 if momentum accelerates. A stop loss above 1.1788 protects against false breakouts. Traders should keep a close eye on US CPI and ECB communication, as these will dictate whether this wedge finally resolves to the downside or extends consolidation. For now, the watchpoint is clear: hold bias bearish, with 1.1585 as the key profit zone.

USDCHF: Bearish Scenario Explained 🇺🇸🇨🇭
There is a high chance that USDCHF will continue falling from
a key intraday horizontal resistance.
A bearish breakout of a support line of a rising wedge pattern
provides a strong bearish confirmation.
Goal - 0.7937
❤️Please, support my work with like, thank you!❤️
I am part of Trade Nation's Influencer program and receive a monthly fee for using their TradingView charts in my analysis.

AUDJPY looks ready for a big leg upLooking at AUDJPY and how it behaves right now, I find it quite interesting.
Price has been coiling and look at the way it rose. Step by step. Meaning buyers are stepping in slowly.
Now, I would way for a confirmation first, with a long position towards 98,300.
What makes this setup different could be the patience behind it. I will be waiting for price to revisit the highlighted level first and look for signs of volume and candles patterns.
Let me know in the comments what you think.
