USDCHF H1 | Bearish continuation outlookThe Swissie (USD/CHF) is rising towards the sell entry, which is a pullback resistance, and could drop from this level to the downside.
Sell entry is at 0.7966, which is a pullback resistance level.
Stop loss is at 0.7997, which is a pullback resistance level.
Take profit is at 0.7917, which is a swing low support.
High Risk Investment Warning
Trading Forex/CFDs on margin carries a high level of risk and may not be suitable for all investors. Leverage can work against you.
Stratos Markets Limited (tradu.com ):
CFDs are complex instruments and come with a high risk of losing money rapidly due to leverage. 65% of retail investor accounts lose money when trading CFDs with this provider. You should consider whether you understand how CFDs work and whether you can afford to take the high risk of losing your money.
Stratos Europe Ltd (tradu.com ):
CFDs are complex instruments and come with a high risk of losing money rapidly due to leverage. 66% of retail investor accounts lose money when trading CFDs with this provider. You should consider whether you understand how CFDs work and whether you can afford to take the high risk of losing your money.
Stratos Global LLC (tradu.com ):
Losses can exceed deposits.
Please be advised that the information presented on TradingView is provided to Tradu (‘Company’, ‘we’) by a third-party provider (‘TFA Global Pte Ltd’). Please be reminded that you are solely responsible for the trading decisions on your account. There is a very high degree of risk involved in trading. Any information and/or content is intended entirely for research, educational and informational purposes only and does not constitute investment or consultation advice or investment strategy. The information is not tailored to the investment needs of any specific person and therefore does not involve a consideration of any of the investment objectives, financial situation or needs of any viewer that may receive it. Kindly also note that past performance is not a reliable indicator of future results. Actual results may differ materially from those anticipated in forward-looking or past performance statements. We assume no liability as to the accuracy or completeness of any of the information and/or content provided herein and the Company cannot be held responsible for any omission, mistake nor for any loss or damage including without limitation to any loss of profit which may arise from reliance on any information supplied by TFA Global Pte Ltd.
The speaker(s) is neither an employee, agent nor representative of Tradu and is therefore acting independently. The opinions given are their own, constitute general market commentary, and do not constitute the opinion or advice of Tradu or any form of personal or investment advice. Tradu neither endorses nor guarantees offerings of third-party speakers, nor is Tradu responsible for the content, veracity or opinions of third-party speakers, presenters or participants.
Forexsignals

GBPUSD H1 | Bullish bounce setupGBP/USD could fall to the buy entry, which is a pullback support that aligns with the 61.8% Fibonacci retracement and could bounce from this level to the upside.
Buy entry is at 1.3526, which is a pullback support that aligns with the 61.8% Fibonacci retracement.
Stop loss is at 1.3484, which is a pullback support level.
Take profit is at 1.3587, which is a swing high resistance.
High Risk Investment Warning
Trading Forex/CFDs on margin carries a high level of risk and may not be suitable for all investors. Leverage can work against you.
Stratos Markets Limited (tradu.com ):
CFDs are complex instruments and come with a high risk of losing money rapidly due to leverage. 65% of retail investor accounts lose money when trading CFDs with this provider. You should consider whether you understand how CFDs work and whether you can afford to take the high risk of losing your money.
Stratos Europe Ltd (tradu.com ):
CFDs are complex instruments and come with a high risk of losing money rapidly due to leverage. 66% of retail investor accounts lose money when trading CFDs with this provider. You should consider whether you understand how CFDs work and whether you can afford to take the high risk of losing your money.
Stratos Global LLC (tradu.com ):
Losses can exceed deposits.
Please be advised that the information presented on TradingView is provided to Tradu (‘Company’, ‘we’) by a third-party provider (‘TFA Global Pte Ltd’). Please be reminded that you are solely responsible for the trading decisions on your account. There is a very high degree of risk involved in trading. Any information and/or content is intended entirely for research, educational and informational purposes only and does not constitute investment or consultation advice or investment strategy. The information is not tailored to the investment needs of any specific person and therefore does not involve a consideration of any of the investment objectives, financial situation or needs of any viewer that may receive it. Kindly also note that past performance is not a reliable indicator of future results. Actual results may differ materially from those anticipated in forward-looking or past performance statements. We assume no liability as to the accuracy or completeness of any of the information and/or content provided herein and the Company cannot be held responsible for any omission, mistake nor for any loss or damage including without limitation to any loss of profit which may arise from reliance on any information supplied by TFA Global Pte Ltd.
The speaker(s) is neither an employee, agent nor representative of Tradu and is therefore acting independently. The opinions given are their own, constitute general market commentary, and do not constitute the opinion or advice of Tradu or any form of personal or investment advice. Tradu neither endorses nor guarantees offerings of third-party speakers, nor is Tradu responsible for the content, veracity or opinions of third-party speakers, presenters or participants.

EURUSD H1 | Bullish bounce in playEUR/USD is falling towards the buy entry, which is a pullback support and could bounce from this level to the upside.
Buy entry is at 1.1727, which is a pullback support.
Stop loss is at 1.1696, which is a pullback support.
Take profit is at 1.1778, which acts as a swing high resistance that lines up with the 161.8% Fibonacci extension.
High Risk Investment Warning
Trading Forex/CFDs on margin carries a high level of risk and may not be suitable for all investors. Leverage can work against you.
Stratos Markets Limited (tradu.com ):
CFDs are complex instruments and come with a high risk of losing money rapidly due to leverage. 65% of retail investor accounts lose money when trading CFDs with this provider. You should consider whether you understand how CFDs work and whether you can afford to take the high risk of losing your money.
Stratos Europe Ltd (tradu.com ):
CFDs are complex instruments and come with a high risk of losing money rapidly due to leverage. 66% of retail investor accounts lose money when trading CFDs with this provider. You should consider whether you understand how CFDs work and whether you can afford to take the high risk of losing your money.
Stratos Global LLC (tradu.com ):
Losses can exceed deposits.
Please be advised that the information presented on TradingView is provided to Tradu (‘Company’, ‘we’) by a third-party provider (‘TFA Global Pte Ltd’). Please be reminded that you are solely responsible for the trading decisions on your account. There is a very high degree of risk involved in trading. Any information and/or content is intended entirely for research, educational and informational purposes only and does not constitute investment or consultation advice or investment strategy. The information is not tailored to the investment needs of any specific person and therefore does not involve a consideration of any of the investment objectives, financial situation or needs of any viewer that may receive it. Kindly also note that past performance is not a reliable indicator of future results. Actual results may differ materially from those anticipated in forward-looking or past performance statements. We assume no liability as to the accuracy or completeness of any of the information and/or content provided herein and the Company cannot be held responsible for any omission, mistake nor for any loss or damage including without limitation to any loss of profit which may arise from reliance on any information supplied by TFA Global Pte Ltd.
The speaker(s) is neither an employee, agent nor representative of Tradu and is therefore acting independently. The opinions given are their own, constitute general market commentary, and do not constitute the opinion or advice of Tradu or any form of personal or investment advice. Tradu neither endorses nor guarantees offerings of third-party speakers, nor is Tradu responsible for the content, veracity or opinions of third-party speakers, presenters or participants.

Potential bearish drop?EUR/GBP has rejected off the pivot, which is a pullback resistance and could drop to the 1st support.
Pivot: 0.8664
1st Support: 0.8619
1st Resistance: 0.8689
Disclaimer:
The above opinions given constitute general market commentary, and do not constitute the opinion or advice of IC Markets or any form of personal or investment advice.
Any opinions, news, research, analyses, prices, other information, or links to third-party sites contained on this website are provided on an "as-is" basis, are intended only to be informative, is not an advice nor a recommendation, nor research, or a record of our trading prices, or an offer of, or solicitation for a transaction in any financial instrument and thus should not be treated as such. The information provided does not involve any specific investment objectives, financial situation and needs of any specific person who may receive it. Please be aware, that past performance is not a reliable indicator of future performance and/or results. Past Performance or Forward-looking scenarios based upon the reasonable beliefs of the third-party provider are not a guarantee of future performance. Actual results may differ materially from those anticipated in forward-looking or past performance statements. IC Markets makes no representation or warranty and assumes no liability as to the accuracy or completeness of the information provided, nor any loss arising from any investment based on a recommendation, forecast or any information supplied by any third-party.

Bearish continuation in play?EUR/AUD has reacted off the pivot and could potentially drop to the 1st support.
Pivot: 1.76716
1st Support: 1.74789
1st Resistance: 1.78121
Disclaimer:
The above opinions given constitute general market commentary, and do not constitute the opinion or advice of IC Markets or any form of personal or investment advice.
Any opinions, news, research, analyses, prices, other information, or links to third-party sites contained on this website are provided on an "as-is" basis, are intended only to be informative, is not an advice nor a recommendation, nor research, or a record of our trading prices, or an offer of, or solicitation for a transaction in any financial instrument and thus should not be treated as such. The information provided does not involve any specific investment objectives, financial situation and needs of any specific person who may receive it. Please be aware, that past performance is not a reliable indicator of future performance and/or results. Past Performance or Forward-looking scenarios based upon the reasonable beliefs of the third-party provider are not a guarantee of future performance. Actual results may differ materially from those anticipated in forward-looking or past performance statements. IC Markets makes no representation or warranty and assumes no liability as to the accuracy or completeness of the information provided, nor any loss arising from any investment based on a recommendation, forecast or any information supplied by any third-party.

Bearish drop?EUR/NZD is rising towards the pivot which has been identified as an overlap resistance, and could drop to the 1st support which acts as an overlap support.
Pivot: 1.9477
1st Support: 1.9536
1st Resistance: 1.9751
Disclaimer:
The above opinions given constitute general market commentary, and do not constitute the opinion or advice of IC Markets or any form of personal or investment advice.
Any opinions, news, research, analyses, prices, other information, or links to third-party sites contained on this website are provided on an "as-is" basis, are intended only to be informative, is not an advice nor a recommendation, nor research, or a record of our trading prices, or an offer of, or solicitation for a transaction in any financial instrument and thus should not be treated as such. The information provided does not involve any specific investment objectives, financial situation and needs of any specific person who may receive it. Please be aware, that past performance is not a reliable indicator of future performance and/or results. Past Performance or Forward-looking scenarios based upon the reasonable beliefs of the third-party provider are not a guarantee of future performance. Actual results may differ materially from those anticipated in forward-looking or past performance statements. IC Markets makes no representation or warranty and assumes no liability as to the accuracy or completeness of the information provided, nor any loss arising from any investment based on a recommendation, forecast or any information supplied by any third-party.

Could the Kiwi reverse from here?The price is rising towards the resistance level, which is a pullback resistance that is slightly above the 61.8% Fibonacci projection and could reverse from this level to our take profit.
Entry: 0.6002
Why we like it:
There is a pullback resistance that is slightly above the 61.8% Fibonacci projection.
Stop loss: 0.6055
Why we like it:
There is a swing high resistance that aligns with the 127.2% Fibonacci extension.
Take profit: 0.5923
Why we like it:
There is a pullback support.
Enjoying your TradingView experience? Review us!
Please be advised that the information presented on TradingView is provided to Vantage (‘Vantage Global Limited’, ‘we’) by a third-party provider (‘Everest Fortune Group’). Please be reminded that you are solely responsible for the trading decisions on your account. There is a very high degree of risk involved in trading. Any information and/or content is intended entirely for research, educational and informational purposes only and does not constitute investment or consultation advice or investment strategy. The information is not tailored to the investment needs of any specific person and therefore does not involve a consideration of any of the investment objectives, financial situation or needs of any viewer that may receive it. Kindly also note that past performance is not a reliable indicator of future results. Actual results may differ materially from those anticipated in forward-looking or past performance statements. We assume no liability as to the accuracy or completeness of any of the information and/or content provided herein and the Company cannot be held responsible for any omission, mistake nor for any loss or damage including without limitation to any loss of profit which may arise from reliance on any information supplied by Everest Fortune Group.

Bullish reversal off pullback support?USD/JPY is falling towards the support level, which is a pullback support and could bounce from this level to our take profit.
Entry: 146.37
Why we like it:
There is a pullback support.
Stop loss: 145.84
Why we like it:
There is an overlap support that aligns with the 127.2% Fibonacci extension.
Take profit: 147.84
Why we like it:
There is a pullback resistance.
Enjoying your TradingView experience? Review us!
Please be advised that the information presented on TradingView is provided to Vantage (‘Vantage Global Limited’, ‘we’) by a third-party provider (‘Everest Fortune Group’). Please be reminded that you are solely responsible for the trading decisions on your account. There is a very high degree of risk involved in trading. Any information and/or content is intended entirely for research, educational and informational purposes only and does not constitute investment or consultation advice or investment strategy. The information is not tailored to the investment needs of any specific person and therefore does not involve a consideration of any of the investment objectives, financial situation or needs of any viewer that may receive it. Kindly also note that past performance is not a reliable indicator of future results. Actual results may differ materially from those anticipated in forward-looking or past performance statements. We assume no liability as to the accuracy or completeness of any of the information and/or content provided herein and the Company cannot be held responsible for any omission, mistake nor for any loss or damage including without limitation to any loss of profit which may arise from reliance on any information supplied by Everest Fortune Group.

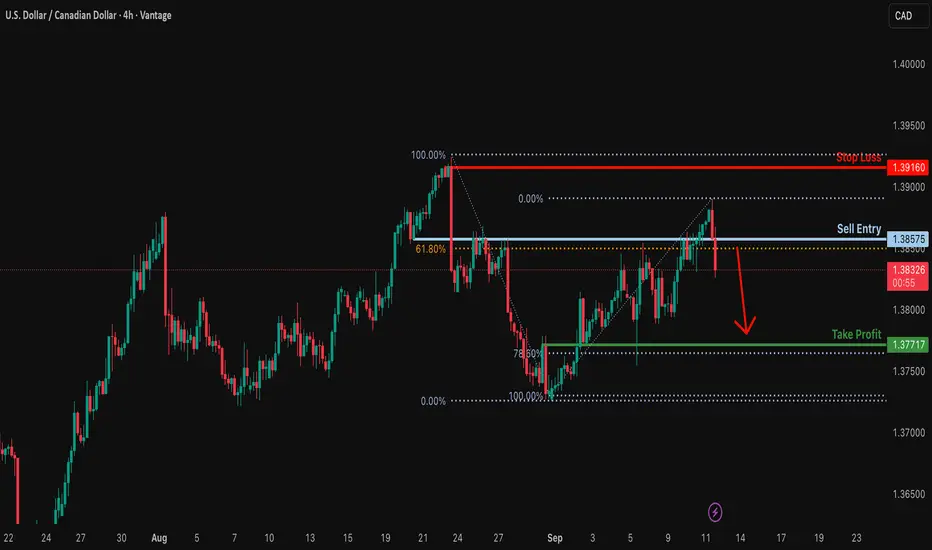
Potential bearish drop?USD/CAD is reacting off the resistance level which is a pullback resistance that aligns with the 61.8% Fibonacci retracement and could drop from this level to our take profit.
Entry: 1.3857
Why we like it:
There is a pullback resistance level that lines up with the 61.8% Fibonacci retracement.
Stop loss: 1.3916
Why we like it:
There is a swing high resistance level.
Take profit: 1.3771
Why we like it:
There is a pullback support that aligns with the 78.6% Fibonacci retracement.
Enjoying your TradingView experience? Review us!
Please be advised that the information presented on TradingView is provided to Vantage (‘Vantage Global Limited’, ‘we’) by a third-party provider (‘Everest Fortune Group’). Please be reminded that you are solely responsible for the trading decisions on your account. There is a very high degree of risk involved in trading. Any information and/or content is intended entirely for research, educational and informational purposes only and does not constitute investment or consultation advice or investment strategy. The information is not tailored to the investment needs of any specific person and therefore does not involve a consideration of any of the investment objectives, financial situation or needs of any viewer that may receive it. Kindly also note that past performance is not a reliable indicator of future results. Actual results may differ materially from those anticipated in forward-looking or past performance statements. We assume no liability as to the accuracy or completeness of any of the information and/or content provided herein and the Company cannot be held responsible for any omission, mistake nor for any loss or damage including without limitation to any loss of profit which may arise from reliance on any information supplied by Everest Fortune Group.
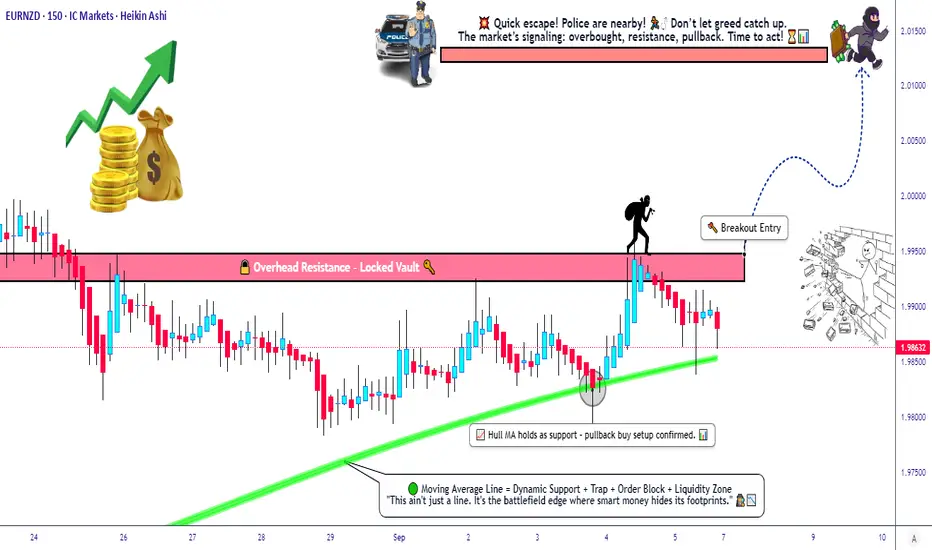
EURNZD: Ready To Loot 200+ Pips? Breakout Plan Active💰 EURNZD "Euro vs Kiwi" Forex Bank MONEY LOOTING PLAN (Swing/Day Trade) 🚀
📌 Trading Plan (Thief Layer Strategy)
Bias: Bullish (Pending Order Plan) 🟢
Breakout Entry: Watch for ⚡ breakout above 2.04500 (major resistance).
Layered Limit Orders (Thief Style):
Buy Limit @ 1.98800
Buy Limit @ 1.99000
Buy Limit @ 1.99200
Buy Limit @ 1.99500
(You can add more layers depending on your strategy.)
Stop Loss (Thief SL): @ 1.98500 📍
(Adjust SL as per your risk tolerance — this is not financial advice.)
Target: Strong resistance + overbought zone near 2.01300 🎯
(Take profit when satisfied — manage risk, lock profits, and don’t get trapped.)
⚠️ Tip: Set an alert on TradingView at the breakout level to catch moves without stress.
📊 EUR/NZD Market Snapshot (Sept 7, 2025)
Daily Change: +0.01% (Flat, stable vibes)
Current Momentum: Building energy for potential breakout 💥
🧑🤝🧑 Sentiment Outlook
Retail Traders: 61% Bearish 🐻 | 39% Bullish 🐂
→ Retail leaning short, expecting NZD strength.
Institutions: Mildly Bullish 🐂
→ Favoring EUR upside from Eurozone recovery flows.
Overall Mood: Neutral 😐 → Balance of caution + opportunity.
😨📈 Fear & Greed Index
Score: 49 ⚖️ (Neutral Zone)
→ Market is calm, neither overheated nor fearful.
🔍 Fundamental & Macro Overview
EUR Fundamentals: 7/10 💪
→ GDP +0.9%, inflation cooling (2.0%), ECB easing support.
NZD Fundamentals: 6/10 🛡️
→ GDP +1.2%, RBNZ steady, exports steady but China slowdown a drag.
Macro Score: Bullish Tilt 🟢
→ Interest rate gap favors EUR; Eurozone current account +3.4%.
🎯 Thief Strategy Reasoning — WHY THIS PLAN?
Technical: Breakout confirmation above 2.04500 + layered entries (Thief style).
Fundamental: EUR showing resilience while NZD faces export headwinds.
Macro: Eurozone edges ahead with positive balance & easing monetary stance.
Sentiment: Retail shorts fuel potential squeeze higher.
Fear & Greed: Balanced — supports controlled upside moves.
📈 Related Pairs to Watch
Correlated Assets Monitoring:
OANDA:EURAUD (Euro vs Australian Dollar)
OANDA:NZDCAD (New Zealand Dollar vs Canadian Dollar)
FX:EURUSD (Euro vs US Dollar)
OANDA:AUDNZD (Australian Dollar vs New Zealand Dollar)
Why watch these? They provide confirmation signals for EUR strength and NZD weakness across multiple fronts .
✨ “If you find value in my analysis, a 👍 and 🚀 boost is much appreciated — it helps me share more setups with the community!”
#EURNZD #Forex #SwingTrade #DayTrading #BreakoutStrategy #ThiefTrader #LayerStrategy #ForexCommunity #TradingViewIdea #FXSetups
GBPUSD Faces Strong Ceiling at 1.36 – Drop to 1.32 Ahead?The first half of this year was strongly bullish for GBPUSD, with the pair climbing from 1.20 to 1.37 — a rally of nearly 1,700 pips (14%).
However, after topping in July, cable corrected around 600 pips, only to find solid support at 1.32 in August. From there, a rebound followed, pushing price back up to 1.36 by the end of the month.
Looking at the chart, we can see a clear technical picture: while GBPUSD has rebounded from support, it has also formed a very strong ceiling at 1.36. This zone has now been reinforced by a bearish pin bar printed just two days ago.
Going forward, as I already highlighted in my DXY analysis, I expect a rebound in the USD — and this will almost certainly translate into a drop in cable.
From a purely technical standpoint:
• 1.36 = strong resistance, validated by the pin bar and multiple rejections.
• 1.34 is the first support and can act as a soft target.
• In the medium term, I expect GBPUSD to revisit 1.32.
The strategy is clear: sell the rallies into resistance, as the pair appears to be at the beginning of a corrective leg lower. 🚀

USDCHF – Liquidity Sweep + FVG Entry (Counter-Trend Long to PDH)Idea:
Price swept previous day’s low (PDL), tapping into an Extreme Daily POI.
We then saw a CHOCH on LTF, confirming rejection.
A clean 5M FVG entry formed, giving a precise long setup.
Bias: Intraday bullish (HTF still bearish).
Entry: 5M FVG inside Daily POI.
SL: Below swept low.
TP1: 2R (partial exit).
TP2: Previous Day High (PDH liquidity magnet).
Notes:
This is a buy-to-sell setup — valid for intraday longs up into PDH, but watch for shorts if HTF structure rejects at PDH.

USDJPY: Tight Range, Big Breakout Coming – Bulls Eye 150.80In recent weeks, USDJPY has been one of the most frustrating pairs to trade.
Since early August, the pair has fluctuated inside a very narrow range between 146.70 and 148.50 — less than 1.5% of movement.
However, such tight consolidations rarely last. They usually precede strong moves, and in my opinion, this breakout is more likely to come to the upside.
Looking at the broader picture:
• The April low around 140 (which also tested September last year’s low) marked a strong structural support.
• From there, the pair began climbing in a constructive way, consistently putting in higher lows on the long-term chart.
• During the current consolidation, we’ve seen two notable bullish reactions: dips slightly below 147.70 were bought aggressively on 14 August and again just two days ago, leaving behind clean bullish pin bars on the daily chart.
Putting these pieces together, my bias is bullish. I expect the current range to eventually resolve higher, with 150.80 as the next major resistance and natural target for bulls.
That being said, the market still needs to confirm this idea:
• Upside acceleration comes with a clear break above 148.50.
• The bullish case would be invalidated by a daily close below 146.50.
As always, patience is key — range markets test our discipline, but they also prepare the ground for the next big move. 🚀

USDCHF daily chart ,the corridor paysThe USDCHF daily chart looks like a corridor battle the price continues to move between support at 0.7910 and resistance at 0.8170 and as long as these levels hold the swing trading strategy remains valid buying near support and taking profits near resistance works textbook style if resistance at 0.8170 is broken the next logical target shifts to the 0.8440 zone where significant volume is concentrated technically the structure still points to a sideways market with possible false breakouts fundamentally the pair remains driven by the US dollar index and Fed policy while the franc traditionally acts as a safe haven any shifts in Fed rhetoric or SNB actions could trigger a breakout from the range in conclusion as long as USDCHF trades in this corridor it is a convenient instrument for range trading and breakouts should only be traded with volume confirmation and price consolidation above key levels

World gold price increasedThe US economy said that the PPI index in August decreased by 0.1% month-on-month, much lower than the 0.7% increase in July and the 0.3% increase previously forecast.
The US PPI index in August increased by 2.6% year-on-year, much lower than the 3.1% increase in July and the 3.3% increase previously forecast. The core PPI index (excluding energy and food prices) increased by 2.8% year-on-year, much lower than the 3.4% increase in July and the 3.5% increase previously forecast.
China's CPI and PPI index decreased in August and were lower than forecast, showing that the economy is still in a state of deflation, so the government of this country needs more support measures to boost consumer demand, including further monetary easing policies.
For the US economy, after a long period of persistent high inflation at around 3%, in August, unexpectedly, an inflation measure, PPI, decreased sharply compared to the previous month. PPI is an index measuring input costs of production. When this index decreases, it predicts that consumer prices will decrease in many types of goods and services when delivered to consumers.

Bullish rise?The Loonie (USD/CAD) could fall to the pivot and bounce to the 1st resistance, which acts as a swing high resistance.
Pivot: 1.3828
1st Support: 1.3791
1st Resistance: 1.3918
Disclaimer:
The above opinions given constitute general market commentary, and do not constitute the opinion or advice of IC Markets or any form of personal or investment advice.
Any opinions, news, research, analyses, prices, other information, or links to third-party sites contained on this website are provided on an "as-is" basis, are intended only to be informative, is not an advice nor a recommendation, nor research, or a record of our trading prices, or an offer of, or solicitation for a transaction in any financial instrument and thus should not be treated as such. The information provided does not involve any specific investment objectives, financial situation and needs of any specific person who may receive it. Please be aware, that past performance is not a reliable indicator of future performance and/or results. Past Performance or Forward-looking scenarios based upon the reasonable beliefs of the third-party provider are not a guarantee of future performance. Actual results may differ materially from those anticipated in forward-looking or past performance statements. IC Markets makes no representation or warranty and assumes no liability as to the accuracy or completeness of the information provided, nor any loss arising from any investment based on a recommendation, forecast or any information supplied by any third-party.

Bearish reversal at pullback resistance?The Swissie (USD/CHF) is rising toward the pivot, which acts as a pullback resistance that aligns with the 50% Fibonacci retracement and could reverse to the 1st support.
Pivot: 0.8000
1st Support: 0.7944
1st Resistance: 0.8031
Disclaimer:
The above opinions given constitute general market commentary, and do not constitute the opinion or advice of IC Markets or any form of personal or investment advice.
Any opinions, news, research, analyses, prices, other information, or links to third-party sites contained on this website are provided on an "as-is" basis, are intended only to be informative, is not an advice nor a recommendation, nor research, or a record of our trading prices, or an offer of, or solicitation for a transaction in any financial instrument and thus should not be treated as such. The information provided does not involve any specific investment objectives, financial situation and needs of any specific person who may receive it. Please be aware, that past performance is not a reliable indicator of future performance and/or results. Past Performance or Forward-looking scenarios based upon the reasonable beliefs of the third-party provider are not a guarantee of future performance. Actual results may differ materially from those anticipated in forward-looking or past performance statements. IC Markets makes no representation or warranty and assumes no liability as to the accuracy or completeness of the information provided, nor any loss arising from any investment based on a recommendation, forecast or any information supplied by any third-party.

Bullish bounce off 61.8% Fibonacci support?USD/JPY is falling towards the pivot, which is a pullback support that aligns with the 61.8% Fibonacci retracement and could bounce to the 1st resistance.
Pivot: 146.84
1st Support: 145.99
1st Resistance: 148.34
Disclaimer:
The above opinions given constitute general market commentary, and do not constitute the opinion or advice of IC Markets or any form of personal or investment advice.
Any opinions, news, research, analyses, prices, other information, or links to third-party sites contained on this website are provided on an "as-is" basis, are intended only to be informative, is not an advice nor a recommendation, nor research, or a record of our trading prices, or an offer of, or solicitation for a transaction in any financial instrument and thus should not be treated as such. The information provided does not involve any specific investment objectives, financial situation and needs of any specific person who may receive it. Please be aware, that past performance is not a reliable indicator of future performance and/or results. Past Performance or Forward-looking scenarios based upon the reasonable beliefs of the third-party provider are not a guarantee of future performance. Actual results may differ materially from those anticipated in forward-looking or past performance statements. IC Markets makes no representation or warranty and assumes no liability as to the accuracy or completeness of the information provided, nor any loss arising from any investment based on a recommendation, forecast or any information supplied by any third-party.

Potential bearish drop?The Cable (GBP/USD) has rejected off the pivot and could drop to the 61.8% Fibonacci support.
Pivot: 1.3579
1st Resistance: 1.3657
1st Support: 1.3461
Disclaimer:
The above opinions given constitute general market commentary, and do not constitute the opinion or advice of IC Markets or any form of personal or investment advice.
Any opinions, news, research, analyses, prices, other information, or links to third-party sites contained on this website are provided on an "as-is" basis, are intended only to be informative, is not an advice nor a recommendation, nor research, or a record of our trading prices, or an offer of, or solicitation for a transaction in any financial instrument and thus should not be treated as such. The information provided does not involve any specific investment objectives, financial situation and needs of any specific person who may receive it. Please be aware, that past performance is not a reliable indicator of future performance and/or results. Past Performance or Forward-looking scenarios based upon the reasonable beliefs of the third-party provider are not a guarantee of future performance. Actual results may differ materially from those anticipated in forward-looking or past performance statements. IC Markets makes no representation or warranty and assumes no liability as to the accuracy or completeness of the information provided, nor any loss arising from any investment based on a recommendation, forecast or any information supplied by any third-party.

EurAud Continuation Trade SetupPrimary Count
Price is advancing in a small wave 4 recovery with the ideal resistance at the 38.2% retracement of wave 3 near 1.7719–1.7722, which often caps fourth waves in fast trends.
A subsequent break lower would complete wave 5 with equality to wave 1 at or around 1.7622 - 1.7600
Why this count
The decline into the labeled wave 3 shows impulsive characteristics, while the current bounce is overlapping and contained—typical wave 4 behavior into Fibonacci resistance.
The projection cluster at 1.7622 (5 vs 1 equality) provides a textbook objective for terminating moves when wave 3 has carried the bulk of the trend.
Trade plan
Entry: Monitor for reversal signals in the 1.7715–1.7725 sell zone; consider scaling on a lower-timeframe break of the bounce channel.
Stop: Above 1.7750 to allow noise beyond the 38.2% level while preserving the wave 4 thesis.
Targets: Take profits at 1.7622- 1.7600.
What to watch
Confirmation comes from an impulsive turn down from the 38.2% zone followed by a break of bounce lows, indicating wave 5 has engaged.
Invalidation is a sustained push and hold above 1.7750 that compromises the wave 4 cap and suggests a deeper correction toward higher retracements.
Structure comes before prediction—let the reaction at 1.7720 reveal whether the fifth wave is ready to break lower or if the correction needs more time to mature

Bullish bounce?The Fiber (EUR/USD) is falling towards the pivot which is a pullback support that lines up with the 61.8% Fibonacci retracement and could bounce to the 1st resistance.
Pivot: 1.1676
1st Support: 1.1618
1st Resistance: 1.1772
Disclaimer:
The above opinions given constitute general market commentary, and do not constitute the opinion or advice of IC Markets or any form of personal or investment advice.
Any opinions, news, research, analyses, prices, other information, or links to third-party sites contained on this website are provided on an "as-is" basis, are intended only to be informative, is not an advice nor a recommendation, nor research, or a record of our trading prices, or an offer of, or solicitation for a transaction in any financial instrument and thus should not be treated as such. The information provided does not involve any specific investment objectives, financial situation and needs of any specific person who may receive it. Please be aware, that past performance is not a reliable indicator of future performance and/or results. Past Performance or Forward-looking scenarios based upon the reasonable beliefs of the third-party provider are not a guarantee of future performance. Actual results may differ materially from those anticipated in forward-looking or past performance statements. IC Markets makes no representation or warranty and assumes no liability as to the accuracy or completeness of the information provided, nor any loss arising from any investment based on a recommendation, forecast or any information supplied by any third-party.

Bearish reversal off 61.8% Fibonacci resistance?The US Dollar Index (DXY) is rising towards the pivot which aligns with the 61.8% Fibonacci retracement, and could reverse to the 1st support.
Pivot: 98.11
1st Support: 97.36
1st Resistance: 98.47
Disclaimer:
The above opinions given constitute general market commentary, and do not constitute the opinion or advice of IC Markets or any form of personal or investment advice.
Any opinions, news, research, analyses, prices, other information, or links to third-party sites contained on this website are provided on an "as-is" basis, are intended only to be informative, is not an advice nor a recommendation, nor research, or a record of our trading prices, or an offer of, or solicitation for a transaction in any financial instrument and thus should not be treated as such. The information provided does not involve any specific investment objectives, financial situation and needs of any specific person who may receive it. Please be aware, that past performance is not a reliable indicator of future performance and/or results. Past Performance or Forward-looking scenarios based upon the reasonable beliefs of the third-party provider are not a guarantee of future performance. Actual results may differ materially from those anticipated in forward-looking or past performance statements. IC Markets makes no representation or warranty and assumes no liability as to the accuracy or completeness of the information provided, nor any loss arising from any investment based on a recommendation, forecast or any information supplied by any third-party.

EUR/USD ; SHORT!Hello friends
Well, you see that the price is moving in a channel regularly and in this area, the ceiling of the channel, we are waiting for a price correction at the bottom of the channel.
If the channel breaks validly from above, the price can grow well.
*Trade safely with us*
