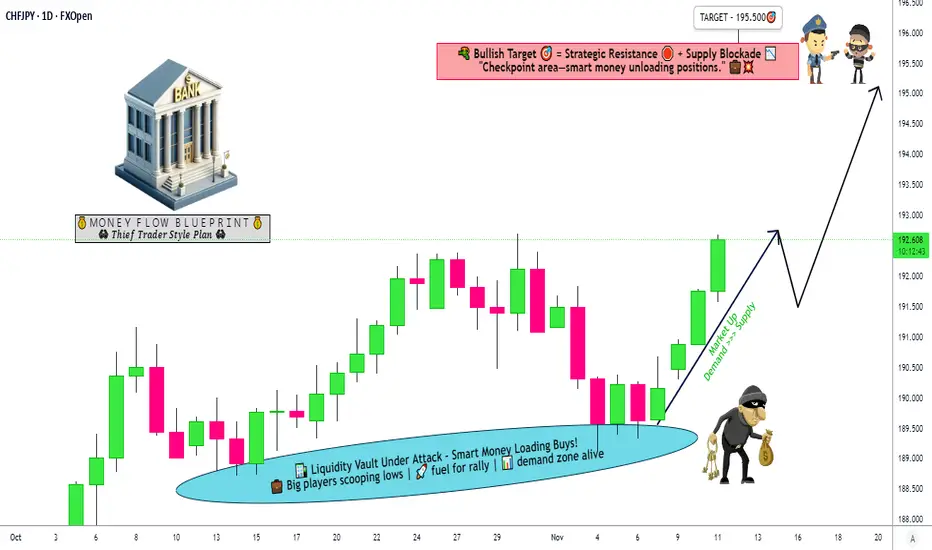
CHF/JPY Trade Guide – Targeting the Next Resistance ZoneCHF/JPY "SWISS VS YEN"
Forex Swing Trade Opportunity Guide | Bullish Scenario
📊 TRADE SETUP AT A GLANCE
Asset: CHF/JPY | Timeframe: Swing Trade | Bias: BULLISH ↗️
Risk/Reward: Premium Setup | Strategy: Layered Entry Method
📍 ENTRY STRATEGY: "THIEF LAYERING METHOD"
Multiple Limit Order Entries (Smart Accumulation)
Deploy your capital across 5 strategic price layers for optimal risk management:
🎯 Layer 1: Entry @ 190.000 (20% allocation)
🎯 Layer 2: Entry @ 190.500 (20% allocation)
🎯 Layer 3: Entry @ 191.000 (20% allocation)
🎯 Layer 4: Entry @ 191.500 (20% allocation)
🎯 Layer 5: Entry @ 192.000 (20% allocation)
💡 Pro Tip: Adjust layers based on your account size & risk tolerance. This method averages your entry and reduces emotional trading.
🛑 STOP LOSS: "PROTECTION PROTOCOL"
SL Level: 189.000
⚠️ IMPORTANT: This is a suggested level ONLY.
👑 Thief OG's Rule: Adjust your SL based on YOUR strategy, account size, and personal risk management. This is YOUR decision.
🎯 TARGET: "POLICE BARRICADE BREAKOUT"
TP Level: 195.500
Why This Target? 🔍
Strong Resistance Zone identified at 195.500
Overbought Conditions present in upper range
Profit Trap Warning: Market shows reversal signals at this level
Smart Exit: Lock in gains before the police barricade stops the rally
🚨 CRITICAL NOTE: This TP is suggested guidance ONLY.
👑 Thief OG's Rule: Your profit target is YOUR choice. Take profits at levels comfortable with YOUR risk tolerance. Remember: Secured profits > Unrealized gains.
📈 RISK MANAGEMENT CHECKLIST
✅ Start with 1-2 layers to test the setup
✅ Scale into remaining layers as price confirms direction
✅ Move SL to breakeven after 2-3% profit
✅ Take partial profits at 50% of target
✅ Trail your remaining position for maximum gains
🔗 RELATED PAIRS TO WATCH (CORRELATION ANALYSIS)
FX:USDJPY (Strong Positive Correlation with CHF/JPY)
Why It Matters: Both are JPY pairs. If USD/JPY rallies, CHF/JPY typically follows
Key Point: USD strength = CHF strength against JPY
Watch For: When USD/JPY breaks resistance, CHF/JPY momentum accelerates
Current Setup: Bullish USD/JPY aligns with your CHF/JPY long bias
OANDA:EURJPY (Moderate Positive Correlation)
Why It Matters: EUR and CHF move together; both USD proxies
Key Point: EUR strength supports CHF strength
Watch For: If EUR/JPY stalls, CHF/JPY may face headwinds
Risk Alert: EUR weakness = potential CHF/JPY reversal signal
USD/CHF (Inverse Correlation)
Why It Matters: Inverse pair to your setup
Key Point: If USD/CHF drops, CHF/JPY rises (inverse logic)
Watch For: USD/CHF support breaks = CHF strength confirmation
Confirmation Tool: Use for entry validation
FX_IDC:CHFUSD (Direct Correlation)
Why It Matters: Shows pure CHF strength vs USD
Key Point: CHF/USD rally = CHF/JPY bullish confirmation
Watch For: Break above key resistance = continuation signal
Quick Check: Fast confirmation of CHF bullish bias
JPY Index (Inverse Correlation)
Why It Matters: Measures JPY weakness across all pairs
Key Point: When JPY weakens, CHF/JPY rallies
Watch For: JPY index breakdown = CHF/JPY tailwind
Macro Signal: Broader JPY weakness supports your trade
⚡ EXECUTION SUMMARY
Step 1: Place 5 buy limit orders at layered prices (190.000 → 192.000)
Step 2: Set SL at 189.000 (adjust to your preference)
Step 3: Target TP at 195.500 (adjust to your preference)
Step 4: Monitor correlated pairs (USD/JPY, EUR/JPY, CHF/USD)
Step 5: Manage risk aggressively — your account, your rules
👑 Thief OG's Philosophy: Make money on YOUR terms. Take profits at YOUR pace.
Last Updated: Real-Time Market Conditions
Follow for more strategic swing trade setups! 📈
Forexsignals
Gold Pullback Plan – Time to Buy the Dip or Wait for Reversal? 📅 Trading Plan – November 11, 2025
🧭 Market Context
Gold (XAU/USD) continues its bullish momentum, but the recent rejection at 4146–4148 suggests a short-term pullback is in play. Buyers may look for new entries at key demand zones below.
💰 Trading Plan
Bias: 🟢 LONG (Buy the Dip)
Entry Zones:
BUY Zone 1: 4084 – 4082
BUY Zone 2: 4041 – 4039
Target (TP):
🎯 TP1: 4128
🎯 TP2: 4145
Stop Loss (SL):
🛑 SL: 4078 (≈6 points below entry zone 1)
📊 Reasoning
Price structure still forming higher highs and higher lows.
Momentum remains bullish despite short-term correction.
Buy zones align with previous consolidation and demand areas.
⚠️ Risk Management
Risk per trade ≤ 1.5%
If price closes below 4078 on 30-min timeframe, re-evaluate bullish bias.

Bullish bounce off pullback support?NZD/JPY has bounced off the support level, which serves as a pullback support that aligns with the 38.2% Fibonacci retracement and could rise from this level to our take-profit target.
Entry: 86.64
Why we like it:
There is a pullback support that aligns with the 38.2% Fibonacci retracement.
Stop loss: 86.64
Why we like it:
There is a pullback support level that aligns with the 61.8% Fibonacci retracement.
Take profit: 87.40
Why we like it:
There is a support level that aligns with the 50% Fibonacci retracement.
Enjoying your TradingView experience? Review us!
Please be advised that the information presented on TradingView is provided to Vantage (‘Vantage Global Limited’, ‘we’) by a third-party provider (‘Everest Fortune Group’). Please be reminded that you are solely responsible for the trading decisions on your account. There is a very high degree of risk involved in trading. Any information and/or content is intended entirely for research, educational and informational purposes only and does not constitute investment or consultation advice or investment strategy. The information is not tailored to the investment needs of any specific person and therefore does not involve a consideration of any of the investment objectives, financial situation or needs of any viewer that may receive it. Kindly also note that past performance is not a reliable indicator of future results. Actual results may differ materially from those anticipated in forward-looking or past performance statements. We assume no liability as to the accuracy or completeness of any of the information and/or content provided herein and the Company cannot be held responsible for any omission, mistake nor for any loss or damage including without limitation to any loss of profit which may arise from reliance on any information supplied by Everest Fortune Group.

Bearish momentum to extend?Kiwi (NZD/USD) is rising towards the pivot and could reverse to the 1st support, which aligns witht he 161.8% Fibonacci extension.
Pivot: 0.5689
1st Support: 0.5614
1st Resistance: 0.5760
Disclaimer:
The above opinions given constitute general market commentary, and do not constitute the opinion or advice of IC Markets or any form of personal or investment advice.
Any opinions, news, research, analyses, prices, other information, or links to third-party sites contained on this website are provided on an "as-is" basis, are intended only to be informative, is not an advice nor a recommendation, nor research, or a record of our trading prices, or an offer of, or solicitation for a transaction in any financial instrument and thus should not be treated as such. The information provided does not involve any specific investment objectives, financial situation and needs of any specific person who may receive it. Please be aware, that past performance is not a reliable indicator of future performance and/or results. Past Performance or Forward-looking scenarios based upon the reasonable beliefs of the third-party provider are not a guarantee of future performance. Actual results may differ materially from those anticipated in forward-looking or past performance statements. IC Markets makes no representation or warranty and assumes no liability as to the accuracy or completeness of the information provided, nor any loss arising from any investment based on a recommendation, forecast or any information supplied by any third-party.

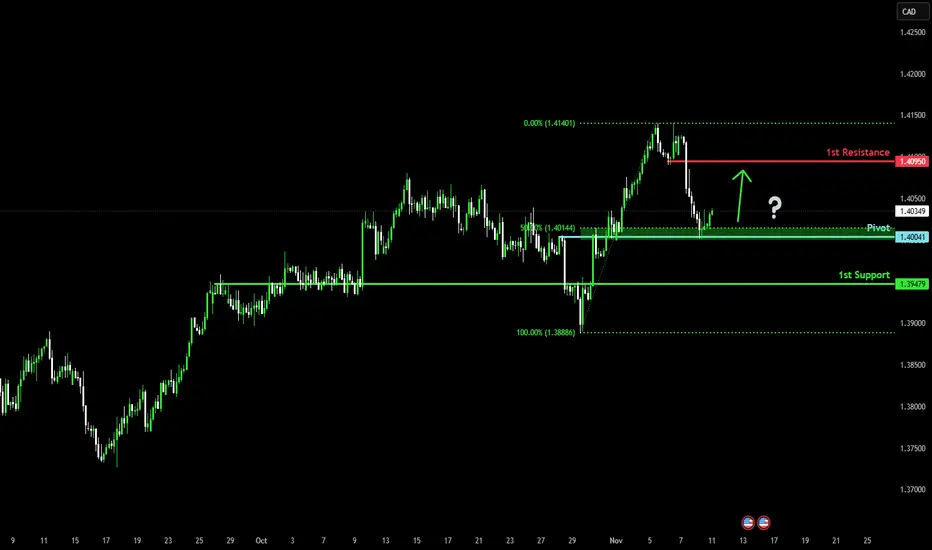
Bullish reversal?Loonie (USD/CAD) has bounced off the pivot and could rise to the 1st resistance, which acts as a pullback resistance.
Pivot: 1.4004
1st Support: 1.3947
1st Resistance: 1.4095
Disclaimer:
The above opinions given constitute general market commentary, and do not constitute the opinion or advice of IC Markets or any form of personal or investment advice.
Any opinions, news, research, analyses, prices, other information, or links to third-party sites contained on this website are provided on an "as-is" basis, are intended only to be informative, is not an advice nor a recommendation, nor research, or a record of our trading prices, or an offer of, or solicitation for a transaction in any financial instrument and thus should not be treated as such. The information provided does not involve any specific investment objectives, financial situation and needs of any specific person who may receive it. Please be aware, that past performance is not a reliable indicator of future performance and/or results. Past Performance or Forward-looking scenarios based upon the reasonable beliefs of the third-party provider are not a guarantee of future performance. Actual results may differ materially from those anticipated in forward-looking or past performance statements. IC Markets makes no representation or warranty and assumes no liability as to the accuracy or completeness of the information provided, nor any loss arising from any investment based on a recommendation, forecast or any information supplied by any third-party.
Bearish drop off?Swissie (USD/CHF) has rejected off the pivot, which acts as a pullback resistance and could drop to the 1st support.
Pivot: 0.8076
1st Support: 0.8009
1st Resistance: 0.8127
Disclaimer:
The above opinions given constitute general market commentary, and do not constitute the opinion or advice of IC Markets or any form of personal or investment advice.
Any opinions, news, research, analyses, prices, other information, or links to third-party sites contained on this website are provided on an "as-is" basis, are intended only to be informative, is not an advice nor a recommendation, nor research, or a record of our trading prices, or an offer of, or solicitation for a transaction in any financial instrument and thus should not be treated as such. The information provided does not involve any specific investment objectives, financial situation and needs of any specific person who may receive it. Please be aware, that past performance is not a reliable indicator of future performance and/or results. Past Performance or Forward-looking scenarios based upon the reasonable beliefs of the third-party provider are not a guarantee of future performance. Actual results may differ materially from those anticipated in forward-looking or past performance statements. IC Markets makes no representation or warranty and assumes no liability as to the accuracy or completeness of the information provided, nor any loss arising from any investment based on a recommendation, forecast or any information supplied by any third-party.

Heading into pullback resistance?Cable (GBP/USD) is rising towards the pivot, which has been identified as a pullback resistance and could reverse to the 1st support.
Pivot: 1.3257
1st Support: 1.3102
1st Resistance: 1.3319
Disclaimer:
The above opinions given constitute general market commentary, and do not constitute the opinion or advice of IC Markets or any form of personal or investment advice.
Any opinions, news, research, analyses, prices, other information, or links to third-party sites contained on this website are provided on an "as-is" basis, are intended only to be informative, is not an advice nor a recommendation, nor research, or a record of our trading prices, or an offer of, or solicitation for a transaction in any financial instrument and thus should not be treated as such. The information provided does not involve any specific investment objectives, financial situation and needs of any specific person who may receive it. Please be aware, that past performance is not a reliable indicator of future performance and/or results. Past Performance or Forward-looking scenarios based upon the reasonable beliefs of the third-party provider are not a guarantee of future performance. Actual results may differ materially from those anticipated in forward-looking or past performance statements. IC Markets makes no representation or warranty and assumes no liability as to the accuracy or completeness of the information provided, nor any loss arising from any investment based on a recommendation, forecast or any information supplied by any third-party.

Bullish bounce off 50% FIbonacci support?Dollar Index (DXY) has bounced off the pivot and could rise to the 1st resistance, which acts as a swing high resistance.
Pivot: 99.41
1st Support: 99.13
1st Resistance: 100.29
Disclaimer:
The above opinions given constitute general market commentary, and do not constitute the opinion or advice of IC Markets or any form of personal or investment advice.
Any opinions, news, research, analyses, prices, other information, or links to third-party sites contained on this website are provided on an "as-is" basis, are intended only to be informative, is not an advice nor a recommendation, nor research, or a record of our trading prices, or an offer of, or solicitation for a transaction in any financial instrument and thus should not be treated as such. The information provided does not involve any specific investment objectives, financial situation and needs of any specific person who may receive it. Please be aware, that past performance is not a reliable indicator of future performance and/or results. Past Performance or Forward-looking scenarios based upon the reasonable beliefs of the third-party provider are not a guarantee of future performance. Actual results may differ materially from those anticipated in forward-looking or past performance statements. IC Markets makes no representation or warranty and assumes no liability as to the accuracy or completeness of the information provided, nor any loss arising from any investment based on a recommendation, forecast or any information supplied by any third-party.

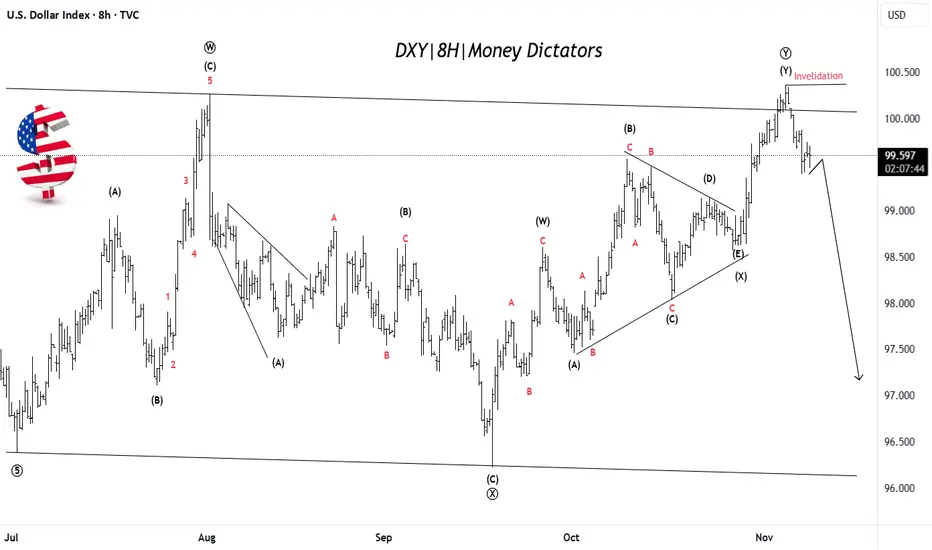
US Dollar Weakness Likely After Final Push UpDXY has completed a complex corrective W–X–Y pattern, with the final leg (Y) recently topping near the 100.50 zone. Price has failed to break above the invalidation level, suggesting the uptrend is losing strength. This signals that the dollar may have finished its corrective phase and could now start a fresh bearish wave targeting lower zones near 97–98. The overall structure indicates that momentum is shifting from bullish to bearish. In simple terms: rally is likely over → downside move toward new lows expected next.
Stay tuned!
@Money_Dictators
Thank you :)
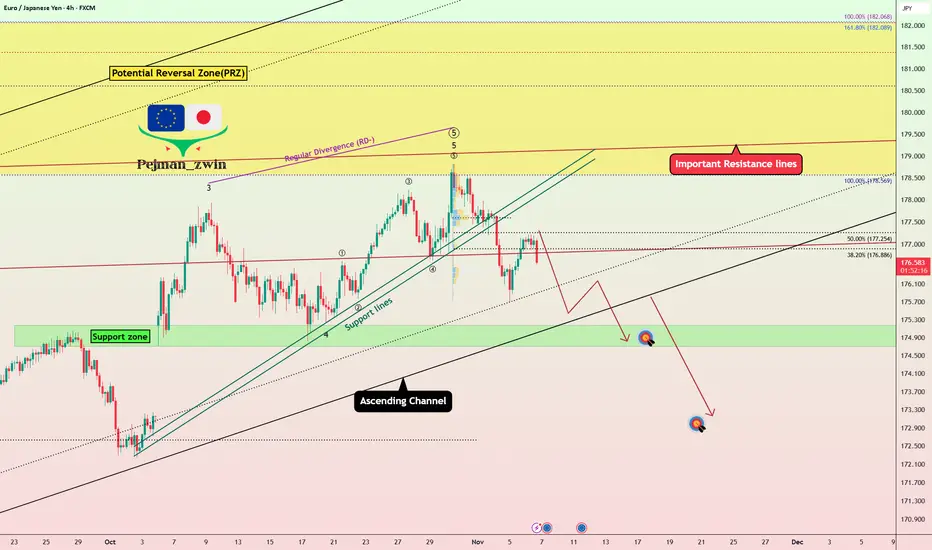
EURJPY Weakening Fast – Correction Phase Beginning!EURJPY ( OANDA:EURJPY ) started to fall nicely from the Potential Reversal Zone(PRZ) and important resistacne lines and managed to break the Support lines .
In the above timeframe, EURJPY is moving in an Ascending Channel .
In terms of Elliott wave theory , it seems that EURJPY has managed to complete the main wave 5 and with the break of the ascending channel , we can confirm the end of the main wave 5 . I see the beginning of the imminent corrective waves .
I expect EURJPY to decline at least to the Support zone(175.18 JPY-174.71 JPY) and lower lines of the ascending channel in the coming hours, and if the ascending channel breaks, the second target could be around 173.144 JPY .
Stop Loss(SL): 178.32 JPY
Please respect each other's ideas and express them politely if you agree or disagree.
Euro/Japanese Yen Analyze ( EURJPY ), 4-hour time frame.
Be sure to follow the updated ideas.
Do not forget to put a Stop loss for your positions (For every position you want to open).
Please follow your strategy and updates; this is just my Idea, and I will gladly see your ideas in this post.
Please do not forget the ✅' like '✅ button 🙏😊 & Share it with your friends; thanks, and Trade safe.
gbpusd bearish swing setupGBP/USD is in a bearish seasonal and overall trend.
It has retraced to the 0.38 Fibonacci level and formed a double top with RSI divergence.
Wait for a breakout below the last higher low.
Risk-to-reward ratio (RRR) > 1:3.

EUR/USD: Bearish Setup Confirmed After Head and Shoulders BreaksHi guys!
The chart shows a Three Drives pattern followed by a Head and Shoulders formation, both signaling potential bearish continuation.
The Three Drives Pattern:
The price completed three consecutive bullish drives, each showing signs of exhaustion. This structure often indicates a weakening uptrend and prepares the ground for a larger reversal.
The Head and Shoulders Pattern:
After the third drive, the market formed a clear head and shoulders structure, confirming distribution at the top. The neckline has already been broken, suggesting a shift from bullish to bearish sentiment.
Current Structure and Expectation:
Price is now retesting the neckline area after the breakdown. A rejection from this level would likely trigger a deeper decline toward the highlighted target zone, which aligns with previous demand and the flip area.
Target:
The projected target of the head and shoulders pattern falls near 1.12500, matching the lower pink zone on the chart.
In summary, unless the market decisively reclaims the neckline and trendline support, EUR/USD remains biased to the downside, with the 1.1250 area as the next key level to watch.
Disclaimer: As part of ThinkMarkets’ Influencer Program, I am sponsored to share and publish their charts in my analysis.

GBPAUD: Bullish Move From Support 🇬🇧🇦🇺
GBPAUD is going to continue recovering after a test
of a significant daily support.
A strong buying imbalance on an hourly time frame
suggest a strong bullish pressure.
Expect a growth at least to 2.0198
❤️Please, support my work with like, thank you!❤️
I am part of Trade Nation's Influencer program and receive a monthly fee for using their TradingView charts in my analysis.

EURUSD: Bearish Trend Will Resume Soon 🇪🇺🇺🇸
EURUSD is trading in a bearish trend on a daily since the middle
of September.
After the market updated the last low November 5th, a correctional
movement started.
I see a significant supply cluster ahead based on a major broken trend
line and a horizontal structure.
With a high probability, the price will resume a bearish trend soon
and continue falling at least to 1.15 level.
❤️Please, support my work with like, thank you!❤️
I am part of Trade Nation's Influencer program and receive a monthly fee for using their TradingView charts in my analysis.

Gold Bearish Reversal Setup Near 4078 Sell ZoneGold (XAU/USD) is showing a potential bearish setup as price approaches the sell zone near 4078. A rejection from this level could push the price down toward the 4050 target, aligning with the highlighted support zone.

XAUUSD | Breakout Above Supply Zone – Targeting 4140–4150 NextGold has successfully broken above the supply zone (4020–4060), confirming a bullish structure shift after multiple rejections in the past week. The clean breakout now opens the path for a liquidity grab toward 4140–4150, aligning with higher timeframe inefficiencies.
Trade Plan:
Entry Zone: Retest of 4040–4060 (previous supply turned demand)
Bias: Bullish continuation
Target 1: 4129 (intra-day liquidity level)
Target 2: 4153 (major HTF resistance)
Invalidation: Below 4020

Hellena | GBP/USD (4H): SHORT to min wave "4" area 1.30100.Colleagues, I haven't reviewed the pound for a long time and now I finally did it)
The wave layout shows that the downward movement is not over yet. I think that wave “4” will soon complete its development and the impulse in wave ‘5’ will start, which will complete the big correction “C”. The minimum target is the support area at 1.30103.
Further we will observe the activity in this area.
Manage your capital correctly and competently! Only enter trades based on reliable patterns!

XAU/USD – Uptrend Extends, Market Prepares for Reaccumulation⏰ Timeframe: 30m
📅 Update: 11/10/2025
🔍 Market Context
Gold continues to maintain its upward structure after forming a Change of Character (CHoCH) at the previous peak.
Successive Break of Structure (BOS) movements have confirmed the main direction leaning towards buyers.
In the early Asian session this week, the price expanded to the Premium Zone around 4,043 USD, showcasing strong bullish momentum. However, this zone could also serve as a technical pause point, where the market may need a slight correction to reaccumulate liquidity before extending the trend.
📊 Technical Structure
The uptrend line has been sustainably maintained since 11/7, indicating that buying flows still control the market.
Premium Zone (4,043–4,045): a short-term resistance area, where a technical pullback may occur.
Order Block (4,003–4,001): a key support area, coinciding with the trendline – likely a technical rebound point if the price corrects.
OB Deep (3,980): the last defense zone for the uptrend structure; if broken, the short-term bias will shift to neutral.
🎯 Market Outlook
High probability scenarios:
1️⃣ Price temporarily corrects from the Premium Zone → returns to test the OB or trendline around 4,003 → reacts upwards towards the expansion zone of 4,078–4,090 USD.
2️⃣ If the price breaks through the OB area, the market may retest OB Deep at 3,980 USD before redefining the larger structure.
🧠 Analyst’s View
Current price behavior reflects a reaccumulation process within the uptrend.
As long as the price remains above 4,000 USD, the advantage stays with the buyers.
Observing reactions at the trendline and OB area will be key to confirming the next bullish momentum during the US session.
🛡️ Risk Note
The price is approaching the equilibrium zone, so avoid impulsive actions without clear confirmation on smaller timeframes.

Silver Correction Ending: Major Drop AheadSilver (XAG/USD) has completed a 5-wave decline, marking the end of Wave (A)/(1) near the 45.53 level. Since then, price has been retracing upward in a complex W–X–Y corrective structure, which appears to be forming the final leg of Wave (B)/(2). The rise is losing strength near the upper channel, hinting that bulls may soon exhaust. Once Wave (B)/(2) finishes, the next big move is expected to be a strong bearish Wave (C)/(3) decline targeting lower zones near or below 45. In simple terms: last leg of correction nearly done → next big drop ahead.
Stay tuned!
@Money_Dictators
Thank you :)

AUDUSD H1 | Heading Into Overlap ResistanceMomentum: Bearish
Price is rising toward the sell entry, which aligns with the 50% Fibonacci retracement and the 127.2% Fibonacci extension.
Sell Entry: 0.6538
Overlap resistance
50% Fibonacci retracement and 127.2% Fibonacci extension
Stop Loss: 0.6557
Strong overlap resistance
61.8% Fibonacci retracement
Take Profit: 0.6503
Pullback support
Stratos Markets Limited (tradu.com ):
CFDs are complex instruments and come with a high risk of losing money rapidly due to leverage. 68% of retail investor accounts lose money when trading CFDs with this provider. You should consider whether you understand how CFDs work and whether you can afford to take the high risk of losing your money.
Stratos Europe Ltd (tradu.com ):
CFDs are complex instruments and come with a high risk of losing money rapidly due to leverage. 70% of retail investor accounts lose money when trading CFDs with this provider. You should consider whether you understand how CFDs work and whether you can afford to take the high risk of losing your money.

GBP/USD: Bullish Reversal Confirmed?!📈GBPUSD formed an inverted head and shoulders pattern on the 4-hour timeframe.
The breakout above its neckline serves as a strong bullish reversal signal.
The broken neckline of this pattern is now expected to act as a significant support level.
We anticipate a subsequent upward movement from this point, targeting at least the 1.3216 resistance level.

USDCHF H4 | Bearish Reversal Off Pullback ResistanceMomentum: Bearish
Price is currently reacting to a sell entry at a pullback resistance level that aligns with the 38.2% Fibonacci retracement.
Sell Entry: 0.8068 (Pullback resistance, 38.2% Fibonacci retracement
Stop Loss: 0.8125
Swing high resistance
Take Profit: 0.8007
Overlap support, slightly above the 50% Fibonacci retracement.
Stratos Markets Limited (tradu.com ):
CFDs are complex instruments and come with a high risk of losing money rapidly due to leverage. 68% of retail investor accounts lose money when trading CFDs with this provider. You should consider whether you understand how CFDs work and whether you can afford to take the high risk of losing your money.
Stratos Europe Ltd (tradu.com ):
CFDs are complex instruments and come with a high risk of losing money rapidly due to leverage. 70% of retail investor accounts lose money when trading CFDs with this provider. You should consider whether you understand how CFDs work and whether you can afford to take the high risk of losing your money.

GBPUSD H1 | Bullish Momentum To ExtendMomentum: Bullish
Price is currently moving within an ascending channel and remains above the Ichimoku cloud, indicating sustained bullish momentum.
Buy Entry: 1.3136
Pullback support
23.6% Fibonacci retracement
Stop Loss: 1.3096
Pullback support
50% Fibonacci retracement
Take Profit: 1.3248
Overlap resistance
Slightly above the 61.8% Fibonacci retracement.
Stratos Markets Limited (tradu.com ):
CFDs are complex instruments and come with a high risk of losing money rapidly due to leverage. 68% of retail investor accounts lose money when trading CFDs with this provider. You should consider whether you understand how CFDs work and whether you can afford to take the high risk of losing your money.
Stratos Europe Ltd (tradu.com ):
CFDs are complex instruments and come with a high risk of losing money rapidly due to leverage. 70% of retail investor accounts lose money when trading CFDs with this provider. You should consider whether you understand how CFDs work and whether you can afford to take the high risk of losing your money.
