EURUSDHello Traders! 👋
What are your thoughts on EURUSD?
EUR/USD has been consolidating within a tight range between the key support at 1.1550–1.1580 and resistance at 1.1740 – 1.1800 in recent weeks.
So far, the pair has failed to break out decisively, showing a lack of strong momentum.
Possible Scenarios
Bullish Scenario:
A confirmed breakout above the 1.1740 – 1.1800 resistance zone could trigger upside momentum, targeting 1.1850 – 1.1950.
Bearish Scenario:
If the 1.1580 –1.1550 support fails and price sustains below it, a deeper decline toward 1.1400 – 1.1450 becomes likely.
As long as price remains inside this range, the optimal strategy is to buy near support and sell near resistance.
However, for higher conviction entries, traders should wait for a clear breakout in either direction and trade accordingly.
Don’t forget to like and share your thoughts in the comments! ❤️
Forexsignals

AUDUSD Bulls Wake Up | Long Setup After CPI ReportToday I want to share with you my LONG position on AUDUSD ( OANDA:AUDUSD ) on the pretext of the release of the CPI y/y index .
Let's take a look at the AUDUSD from a fundamental and technical perspective .
AUDUSD Fundamental Outlook:
Australia’s CPI surprised to the upside at 2.8% YoY (vs. 2.3% exp., 1.9% prev.), mainly boosted by higher electricity costs after rebates expired. Core inflation (trimmed mean) also rose to 2.7% , reducing the odds of a near-term RBA rate cut.
Short-term : Mildly bullish — strong CPI supports AUD as markets price out aggressive RBA easing.
Medium-term : Neutral-to-slightly bullish — sustainability of inflation is uncertain since part of the rise came from temporary energy factors.
----------------------------------------
Now let's take a look at the AUDUSD chart on the 1-hour time frame .
AUDUSD is approaching the Potential Reversal Zone(PRZ) , the Support zone($0.6450-$0.6437) , the Yearly Pivot Point , and a Heavy Support zone($0.6440-$0.6338) .
In terms of Elliott Wave theory , AUDUSD appears to be completing a corrective wave . The corrective wave on the 1-hour time frame is most likely an Expanding Flat(ABC/3-3-5) .
I expect AUDUSD to start rising to at least $0.6490 .
Second Target: $0.6514
Stop Loss(SL): $0.6425(Worst)
Please respect each other's ideas and express them politely if you agree or disagree.
Australian Dollar/U.S.Dollar Analyze (AUDUSD), 1-hour time frame.
Be sure to follow the updated ideas.
Do not forget to put a Stop loss for your positions (For every position you want to open).
Please follow your strategy and updates; this is just my Idea, and I will gladly see your ideas in this post.
Please do not forget the ✅' like '✅ button 🙏😊 & Share it with your friends; thanks, and Trade safe.

GBPUSD Long Setup: Strong Services & Weak USD in FocusToday, we will examine the long position of GBPUSD ( OANDA:GBPUSD ) together from a fundamental and technical perspective .
Please stay with me.
GBPUSD Fundamental Analysis :
GBP Strength Signals:
CPI y/y: 3.8% vs 3.7% expected → higher inflation → less likelihood of rate cuts → supports GBP.
Flash Services PMI: 53.6 vs 51.8 expected → strong service sector → positive for GBP.
GBP Weak Signals:
Flash Manufacturing PMI: 47.3 vs 48.2 expected → contraction in manufacturing → short-term pressure on GBP.
USD Weak Signals:
US Unemployment Claims: 235K vs 226K expected → weaker labor market → negative for USD.
Summary:
Overall, data favors GBP over USD. Short-term to medium-term, GBPUSD is likely to show upside momentum, driven by strong services, higher inflation, and weaker USD labor data. Watch for upcoming US data or Fed comments that could change this bias.
Note: Flash Manufacturing/Services PMI will publish soon.
Note: Tomorrow, we will have Fed Chair Powell speak.
------------------------------------------
Now let's take a technical look at the GBPUSD on the 4-hour timeframe .
GBPUSD is currently moving near the Heavy Support zone($1.343-$1.313) and Potential Reversal Zone(PRZ) .
In terms of Elliott wave theory , GBPUSD seems to have completed the corrective waves . The first signal to confirm the end of the corrective waves could be the break of the upper line of the descending channel . The corrective wave structure is most likely a Double Three Correction(WXY) .
I expect GBPUSD to rise to at least $1.357 AFTER the break of the upper line of the descending channel .
Second Target: $1.363
Note: Stop Loss(SL): 1.3326 USD = Worst Stop Loss(SL)
Please respect each other's ideas and express them politely if you agree or disagree.
British Pound / U.S Dollar Analysis (GBPUSD), 4-hour time frame.
Be sure to follow the updated ideas.
Do not forget to put a Stop loss for your positions (For every position you want to open).
Please follow your strategy and updates; this is just my Idea, and I will gladly see your ideas in this post.
Please do not forget the ✅' like '✅ button 🙏😊 & Share it with your friends; thanks, and Trade safe.

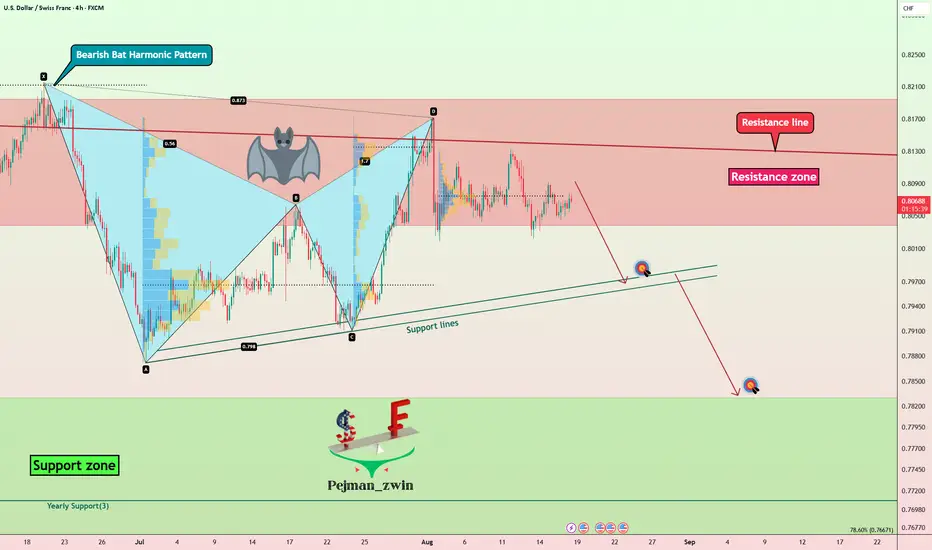
Bearish Bat Pattern Forms – USDCHF Looks Ready to DropToday, I want to review USDCHF ( OANDA:USDCHF ) and lay out the fundamental and technical reasons supporting a Short position bias.
1-Fed policy expectations are the main focus — attention is on the Jackson Hole symposium and signals about the Fed’s path; this has tilted market pricing toward a less hawkish Fed.
2-Dovish bets weigh on the USD — markets are pricing in a softer Fed outlook (rate-cut expectations/pauses), which weakens the dollar.
3-CHF supported by safe-haven flows — amid global uncertainty, the Swiss franc tends to attract demand; SNB’s stance also matters for medium-term flows.
Fundamental takeaway: weaker USD (on Fed expectations) + safe-haven CHF demand = a reinforced bearish case for USDCHF in the short term.
-----------------------------------------------
Now let's take a look at the USDCHF chart on the 4-hour time frame .
USDCHF is trading in the Resistance zone(0.819 CHF-0.804 CHF) and near the Resistance line .
It also looks like USDCHF could continue its downtrend with the help of the Bearish Bat Harmonic Pattern .
I expect USDCHF to decline at least to the Support lines .
Second Target: Support zone(0.783 CHF-0.767 CHF)
Note: Stop Loss(SL): 0.818 CHF
Please respect each other's ideas and express them politely if you agree or disagree.
U.S Dollar/Swiss Franc Analysis (USDCHF), 4-hour time frame.
Be sure to follow the updated ideas.
Do not forget to put a Stop loss for your positions (For every position you want to open).
Please follow your strategy and updates; this is just my Idea, and I will gladly see your ideas in this post.
Please do not forget the ✅' like '✅ button 🙏😊 & Share it with your friends; thanks, and Trade safe.
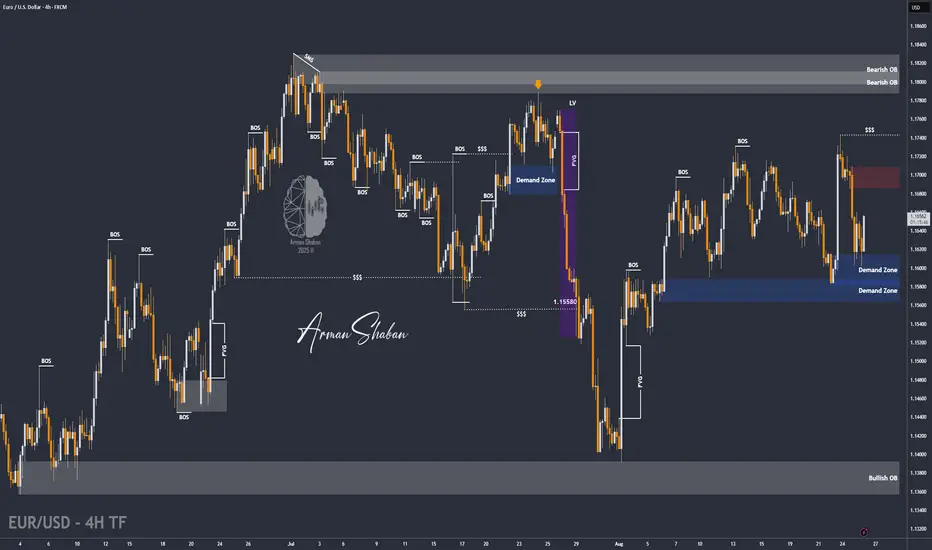
EUR/USD | EUR/USD Holding 1.16 – Eyes on 1.17 Next! (READ)By analyzing the EUR/USD chart on the 4-hour timeframe, we can see that the price is currently trading around 1.165 and has so far managed to hold above the 1.16 support zone. Based on the current trend and momentum, I expect a potential bullish move toward higher levels, with targets above 1.17.
All the key supply and demand zones are marked on the chart, so keep a close eye on the price reaction around these critical levels!
Please support me with your likes and comments to motivate me to share more analysis with you and share your opinion about the possible trend of this chart with me !
Best Regards , Arman Shaban
EURBGP Sell this Leg and buy at the bottom.Last time we took a look a the EURGBP pair (July 11, see chart below), we gave a buy signal inside the Channel Up, which quickly hit our 0.87400 Target:
This time the price has found itself on a decline, the latest Bearish Leg of the Channel Up. The previous two declined by -2.75% before bottoming and reversing. The 1D RSI Higher Lows can be an additional indicator as to where the Low can be priced.
We expect the pair to reach at least 0.85500 before starting the new Bullish Leg, which we believe will extend all the way near the top (1.0 Fibonacci) of the Channel Up. Our Target will be 0.8900.
-------------------------------------------------------------------------------
** Please LIKE 👍, FOLLOW ✅, SHARE 🙌 and COMMENT ✍ if you enjoy this idea! Also share your ideas and charts in the comments section below! This is best way to keep it relevant, support us, keep the content here free and allow the idea to reach as many people as possible. **
-------------------------------------------------------------------------------
Disclosure: I am part of Trade Nation's Influencer program and receive a monthly fee for using their TradingView charts in my analysis.
💸💸💸💸💸💸
👇 👇 👇 👇 👇 👇

We are ready for XAUUSD sellXAUUSD holding the Rangebound of 3380-3400.Gold is fundamentally critically bullish and delivered our 3400 mark!!
What possible scenario we have?
• I'm expecting market has to fall to the Base of rising channel atleast 3365-3360 area.
My sell area will be 3405-3408 previous High watch H4 for confirmation.
3380 then 3360 are my Targets.
• if H4-H1 candle closes above 3410 then I will be sidelines till 3420 and our selling will be invaild
All the entires should be taken once all the rules are applied

GBP/USD Possible Move This GBP/USD 1H analysis suggests a sell limit setup near 1.3544 with a stop loss at 1.3596. The price is expected to drop after rejection, targeting the 1.3461 support and extending to the 1.3391 target zone.

US30 Pullback Toward 45,100 as DXY Weakens on Dovish Fed ToneHey Traders, in today's trading session we are monitoring US30 for a buying opportunity around the 45,100 zone. Dow Jones (US30) remains in an uptrend, with price currently correcting toward this key support/resistance level.
Structure: The broader bias is bullish, though price is retracing after recent highs.
Key level in focus: 45,100 — acting as a key zone within the ongoing trend.
Fundamentals: The US Dollar Index (DXY) faced strong rejection at 98.700 following the Fed’s dovish stance at the Jackson Hole symposium. This bearish dollar sentiment could support US equities due to their negative correlation.
Next move: Holding above 45,100 may keep US30’s bullish momentum intact, while a decisive break lower would suggest deeper retracement.
Monitoring price behavior at this level to gauge whether buyers step in.
Trade safe,
Joe.

USDJPY Rebound Faces 148.300 Resistance, Eyes on 146.900 Target!Hey Traders, In today's trading session we are monitoring USDJPY for a selling opportunity around 148.300 zone. USDJPY has been moving lower overall, with price currently correcting toward the 148.300 area.
Structure: The broader bias has been bearish, but recent price action is showing a short-term pullback.
Key level in focus: 148.300 — previously acted as support/resistance.
Next move: Rejecting this zone could resume the bearish move, with 146.900 as a potential target since it aligns with the partial trend and a key support area. A break above 148.300, however, would question the downside bias.
Monitoring how price reacts around 148.300 to see whether sellers regain control or if the correction deepens.
Trade safe,
Joe.

Gold (XAU/USD) Targets $3,397 – $3,406 Amid Bullish MomentumAnalysis:
The 4H chart of Gold (XAU/USD) shows strong bullish momentum after a corrective phase. Price has broken above consolidation and is currently trading around $3,382, with upside targets at $3,397 and $3,406 (highlighted resistance zone).
The supply zone on the higher timeframe remains intact below $3,280, acting as a long-term support.
Immediate support levels lie at $3,371, $3,356, and $3,348. A break below these could shift momentum bearish.
Current bullish structure suggests that as long as price holds above $3,371, buyers may drive the price higher toward the resistance levels.
A rejection from $3,406 may lead to a pullback toward the mid-support zone before another attempt higher.

GBPJPY H4 | Bearish drop off pullback resistanceGBP/JPY is reacting off the sell entry, which is a pullback resistance and could potentially drop from this level to the downside.
Sell entry is at 199.03, which is a pullback resistance.
Stop loss is at 200.05, which is a swing high resistance.
Take rpfit is at 197.56, which is a pullback support that lines up with he 50% Fibonacci retracement.
High Risk Investment Warning
Trading Forex/CFDs on margin carries a high level of risk and may not be suitable for all investors. Leverage can work against you.
Stratos Markets Limited (tradu.com ):
CFDs are complex instruments and come with a high risk of losing money rapidly due to leverage. 65% of retail investor accounts lose money when trading CFDs with this provider. You should consider whether you understand how CFDs work and whether you can afford to take the high risk of losing your money.
Stratos Europe Ltd (tradu.com ):
CFDs are complex instruments and come with a high risk of losing money rapidly due to leverage. 66% of retail investor accounts lose money when trading CFDs with this provider. You should consider whether you understand how CFDs work and whether you can afford to take the high risk of losing your money.
Stratos Global LLC (tradu.com ):
Losses can exceed deposits.
Please be advised that the information presented on TradingView is provided to Tradu (‘Company’, ‘we’) by a third-party provider (‘TFA Global Pte Ltd’). Please be reminded that you are solely responsible for the trading decisions on your account. There is a very high degree of risk involved in trading. Any information and/or content is intended entirely for research, educational and informational purposes only and does not constitute investment or consultation advice or investment strategy. The information is not tailored to the investment needs of any specific person and therefore does not involve a consideration of any of the investment objectives, financial situation or needs of any viewer that may receive it. Kindly also note that past performance is not a reliable indicator of future results. Actual results may differ materially from those anticipated in forward-looking or past performance statements. We assume no liability as to the accuracy or completeness of any of the information and/or content provided herein and the Company cannot be held responsible for any omission, mistake nor for any loss or damage including without limitation to any loss of profit which may arise from reliance on any information supplied by TFA Global Pte Ltd.
The speaker(s) is neither an employee, agent nor representative of Tradu and is therefore acting independently. The opinions given are their own, constitute general market commentary, and do not constitute the opinion or advice of Tradu or any form of personal or investment advice. Tradu neither endorses nor guarantees offerings of third-party speakers, nor is Tradu responsible for the content, veracity or opinions of third-party speakers, presenters or participants.

Bullish Momentum Building?AUD/USD has reacted off the resistance level, which is a pullback resistance and could rise from this level to our take profit.
Entry: 0.6491
Why we like it:
There is a pullback resistance.
Stop loss: 0.6451
Why we like it:
There is a pullback support.
Take profit: 0.6558
Why we like it:
There is a pullback resistance that aligns with the 100% Fibonacci projection.
Enjoying your TradingView experience? Review us!
Please be advised that the information presented on TradingView is provided to Vantage (‘Vantage Global Limited’, ‘we’) by a third-party provider (‘Everest Fortune Group’). Please be reminded that you are solely responsible for the trading decisions on your account. There is a very high degree of risk involved in trading. Any information and/or content is intended entirely for research, educational and informational purposes only and does not constitute investment or consultation advice or investment strategy. The information is not tailored to the investment needs of any specific person and therefore does not involve a consideration of any of the investment objectives, financial situation or needs of any viewer that may receive it. Kindly also note that past performance is not a reliable indicator of future results. Actual results may differ materially from those anticipated in forward-looking or past performance statements. We assume no liability as to the accuracy or completeness of any of the information and/or content provided herein and the Company cannot be held responsible for any omission, mistake nor for any loss or damage including without limitation to any loss of profit which may arise from reliance on any information supplied by Everest Fortune Group.

Potential bearish drop?USD/JPY has rejected the resistance level, which is a pullback resistance, and could drop from this level to our take-profit.
Entry: 148.02
Why we like it:
There is a pullback resistance.
Stop loss: 148.93
Why we like it:
There is a pullback resistance.
Take profit: 146.00
Why we like it:
There is a swing low support.
Enjoying your TradingView experience? Review us!
Please be advised that the information presented on TradingView is provided to Vantage (‘Vantage Global Limited’, ‘we’) by a third-party provider (‘Everest Fortune Group’). Please be reminded that you are solely responsible for the trading decisions on your account. There is a very high degree of risk involved in trading. Any information and/or content is intended entirely for research, educational and informational purposes only and does not constitute investment or consultation advice or investment strategy. The information is not tailored to the investment needs of any specific person and therefore does not involve a consideration of any of the investment objectives, financial situation or needs of any viewer that may receive it. Kindly also note that past performance is not a reliable indicator of future results. Actual results may differ materially from those anticipated in forward-looking or past performance statements. We assume no liability as to the accuracy or completeness of any of the information and/or content provided herein and the Company cannot be held responsible for any omission, mistake nor for any loss or damage including without limitation to any loss of profit which may arise from reliance on any information supplied by Everest Fortune Group.

Bullish bounce?USD/CHF is falling towards the support level, which is a pullback support that aligns with the 127.2% Fibonacci extension and the 100% Fibonacci projection and could bounce from this level to our take profit.
Entry: 0.7971
Why we like it:
There is a pullback support that lines up with the 127.2% Fibonacci extension and the 100% Fibonacci projection.
Stop loss: 0.7923
Why we like it:
There is a multi-swing low support.
Take profit: 0.8026
Why we ike it:
There is a pullback resistance.
Enjoying your TradingView experience? Review us!
Please be advised that the information presented on TradingView is provided to Vantage (‘Vantage Global Limited’, ‘we’) by a third-party provider (‘Everest Fortune Group’). Please be reminded that you are solely responsible for the trading decisions on your account. There is a very high degree of risk involved in trading. Any information and/or content is intended entirely for research, educational and informational purposes only and does not constitute investment or consultation advice or investment strategy. The information is not tailored to the investment needs of any specific person and therefore does not involve a consideration of any of the investment objectives, financial situation or needs of any viewer that may receive it. Kindly also note that past performance is not a reliable indicator of future results. Actual results may differ materially from those anticipated in forward-looking or past performance statements. We assume no liability as to the accuracy or completeness of any of the information and/or content provided herein and the Company cannot be held responsible for any omission, mistake nor for any loss or damage including without limitation to any loss of profit which may arise from reliance on any information supplied by Everest Fortune Group.
Please be advised that the information presented on TradingView is provided to Vantage (‘Vantage Global Limited’, ‘we’) by a third-party provider (‘Everest Fortune Group’). Please be reminded that you are solely responsible for the trading decisions on your account. There is a very high degree of risk involved in trading. Any information and/or content is intended entirely for research, educational and informational purposes only and does not constitute investment or consultation advice or investment strategy. The information is not tailored to the investment needs of any specific person and therefore does not involve a consideration of any of the investment objectives, financial situation or needs of any viewer that may receive it. Kindly also note that past performance is not a reliable indicator of future results. Actual results may differ materially from those anticipated in forward-looking or past performance statements. We assume no liability as to the accuracy or completeness of any of the information and/or content provided herein and the Company cannot be held responsible for any omission, mistake nor for any loss or damage including without limitation to any loss of profit which may arise from reliance on any information supplied by Everest Fortune Group.

Safe-haven demand continues to hold support.Thus, after several consecutive sessions of increasing to a two-week peak, in response to signals of policy easing from Fed Chairman Jerome Powell as well as Mr. Trump's increasing pressure on the US central bank, gold prices have turned to decrease.
However, the decrease is quite small as safe-haven demand continues to maintain a strong support base.
The US PCE price index (used to measure inflation) released next Friday is expected to guide the gold market, with a consensus forecast of 2.6% for the overall index and 2.9% for the core index.
In the coming time, analysts warn that any erosion in the Fed's independence could boost demand for gold as a policy risk hedge.
In addition, global geopolitical and trade tensions remain persistent and are expected to continue to enhance the safe-haven value of precious metals.
On the afternoon of August 27 (Vietnam time), the US officially raised import tariffs on goods from India to 50%, double the previous rate of 25%, on the grounds that New Delhi continues to buy oil from Russia. This move could threaten trade relations between the US and India - one of Washington's most important partners, while pushing up prices of many commodities.

The probability of a 25 basis point rate cut is 87%.Investors have also bet on two declines in September and December. This limits the room for further declines in the USD, unless the Fed accelerates the pace of interest rate cuts in the rest of the year. However, this possibility is low as almost all Fed members are concerned about rising inflation again.
The decline of the euro also contributed to the USD's rise.
It can be seen that the USD's recovery is not strong enough to reverse the greenback's downward trend, but it has also negatively affected gold prices.
Gold is also under profit-taking pressure after the previous strong increases.
Precious metals are also less attractive when US stocks have positive developments. Stock markets around the world often have extremely active trading in September and October. The strong cash flow into this channel reduces the appeal of the gold market.

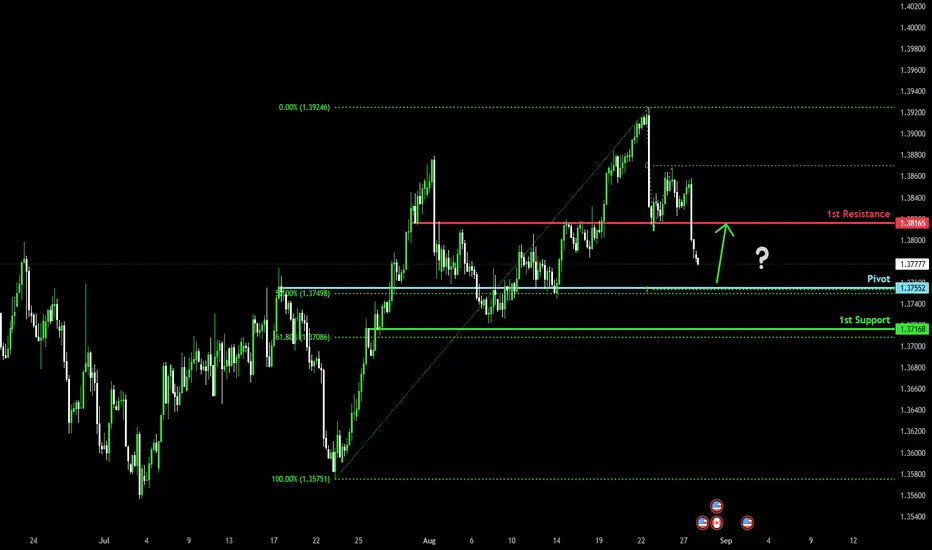
Approaching 50% Fib Support?The Loonie (USD/CAD) is falling towards the pivot which has been identified as an overlap support and could bounce to the 1st resistance which acts as an overlap resistance.
Pivot: 1.3755
1st Support: 1.3716
1st Resistance: 1.3816
Risk Warning:
Trading Forex and CFDs carries a high level of risk to your capital and you should only trade with money you can afford to lose. Trading Forex and CFDs may not be suitable for all investors, so please ensure that you fully understand the risks involved and seek independent advice if necessary.
Disclaimer:
The above opinions given constitute general market commentary, and do not constitute the opinion or advice of IC Markets or any form of personal or investment advice.
Any opinions, news, research, analyses, prices, other information, or links to third-party sites contained on this website are provided on an "as-is" basis, are intended only to be informative, is not an advice nor a recommendation, nor research, or a record of our trading prices, or an offer of, or solicitation for a transaction in any financial instrument and thus should not be treated as such. The information provided does not involve any specific investment objectives, financial situation and needs of any specific person who may receive it. Please be aware, that past performance is not a reliable indicator of future performance and/or results. Past Performance or Forward-looking scenarios based upon the reasonable beliefs of the third-party provider are not a guarantee of future performance. Actual results may differ materially from those anticipated in forward-looking or past performance statements. IC Markets makes no representation or warranty and assumes no liability as to the accuracy or completeness of the information provided, nor any loss arising from any investment based on a recommendation, forecast or any information supplied by any third-party.
Bearish drop off?USD/JPY has rejected off the pivot, which acts as a pullback resistance and could drop to the pullback support.
Pivot: 147.88
1st Support: 146.40
1st Resistance: 148.88
Risk Warning:
Trading Forex and CFDs carries a high level of risk to your capital and you should only trade with money you can afford to lose. Trading Forex and CFDs may not be suitable for all investors, so please ensure that you fully understand the risks involved and seek independent advice if necessary.
Disclaimer:
The above opinions given constitute general market commentary, and do not constitute the opinion or advice of IC Markets or any form of personal or investment advice.
Any opinions, news, research, analyses, prices, other information, or links to third-party sites contained on this website are provided on an "as-is" basis, are intended only to be informative, is not an advice nor a recommendation, nor research, or a record of our trading prices, or an offer of, or solicitation for a transaction in any financial instrument and thus should not be treated as such. The information provided does not involve any specific investment objectives, financial situation and needs of any specific person who may receive it. Please be aware, that past performance is not a reliable indicator of future performance and/or results. Past Performance or Forward-looking scenarios based upon the reasonable beliefs of the third-party provider are not a guarantee of future performance. Actual results may differ materially from those anticipated in forward-looking or past performance statements. IC Markets makes no representation or warranty and assumes no liability as to the accuracy or completeness of the information provided, nor any loss arising from any investment based on a recommendation, forecast or any information supplied by any third-party.

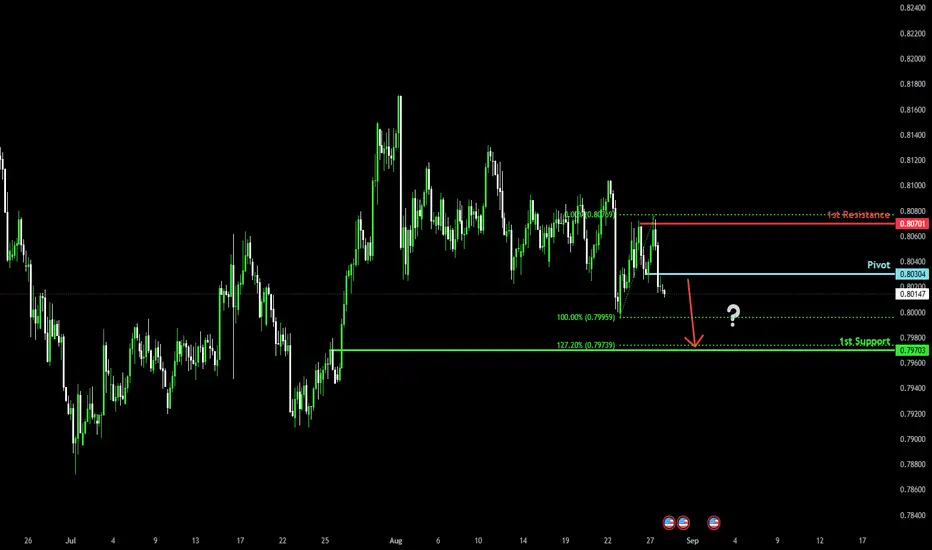
Potential bearish drop?The Swissie (USD/CHF) is rising towards the pivot which is a pullback resistance and could drop to the 1st support.
Pivot: 0.7030
1st Support: 0.7970
1st Resistance: 0.8070
Risk Warning:
Trading Forex and CFDs carries a high level of risk to your capital and you should only trade with money you can afford to lose. Trading Forex and CFDs may not be suitable for all investors, so please ensure that you fully understand the risks involved and seek independent advice if necessary.
Disclaimer:
The above opinions given constitute general market commentary, and do not constitute the opinion or advice of IC Markets or any form of personal or investment advice.
Any opinions, news, research, analyses, prices, other information, or links to third-party sites contained on this website are provided on an "as-is" basis, are intended only to be informative, is not an advice nor a recommendation, nor research, or a record of our trading prices, or an offer of, or solicitation for a transaction in any financial instrument and thus should not be treated as such. The information provided does not involve any specific investment objectives, financial situation and needs of any specific person who may receive it. Please be aware, that past performance is not a reliable indicator of future performance and/or results. Past Performance or Forward-looking scenarios based upon the reasonable beliefs of the third-party provider are not a guarantee of future performance. Actual results may differ materially from those anticipated in forward-looking or past performance statements. IC Markets makes no representation or warranty and assumes no liability as to the accuracy or completeness of the information provided, nor any loss arising from any investment based on a recommendation, forecast or any information supplied by any third-party.
Bullish Reversal Setup Forming?The Kiwi (NZD/USD) has reacted off the pivot and could potentially rise to the 1st resistance.
Pivot: 0.5847
1st Support: 0.5803
1st Resistance: 0.5913
Risk Warning:
Trading Forex and CFDs carries a high level of risk to your capital and you should only trade with money you can afford to lose. Trading Forex and CFDs may not be suitable for all investors, so please ensure that you fully understand the risks involved and seek independent advice if necessary.
Disclaimer:
The above opinions given constitute general market commentary, and do not constitute the opinion or advice of IC Markets or any form of personal or investment advice.
Any opinions, news, research, analyses, prices, other information, or links to third-party sites contained on this website are provided on an "as-is" basis, are intended only to be informative, is not an advice nor a recommendation, nor research, or a record of our trading prices, or an offer of, or solicitation for a transaction in any financial instrument and thus should not be treated as such. The information provided does not involve any specific investment objectives, financial situation and needs of any specific person who may receive it. Please be aware, that past performance is not a reliable indicator of future performance and/or results. Past Performance or Forward-looking scenarios based upon the reasonable beliefs of the third-party provider are not a guarantee of future performance. Actual results may differ materially from those anticipated in forward-looking or past performance statements. IC Markets makes no representation or warranty and assumes no liability as to the accuracy or completeness of the information provided, nor any loss arising from any investment based on a recommendation, forecast or any information supplied by any third-party.

Bearish Reversal at Pullback Resistance?The Aussie (AUD/USD) is rising towards the pivot which acts as a pullback resistance and that lines up with the 78.6% Fibonacci retracement and the 78.6% Fibonacci projection and could reverse to the pullback support.
Pivot: 0.6532
1st Support: 0.6495
1st Resistance: 0.6558
Risk Warning:
Trading Forex and CFDs carries a high level of risk to your capital and you should only trade with money you can afford to lose. Trading Forex and CFDs may not be suitable for all investors, so please ensure that you fully understand the risks involved and seek independent advice if necessary.
Disclaimer:
The above opinions given constitute general market commentary, and do not constitute the opinion or advice of IC Markets or any form of personal or investment advice.
Any opinions, news, research, analyses, prices, other information, or links to third-party sites contained on this website are provided on an "as-is" basis, are intended only to be informative, is not an advice nor a recommendation, nor research, or a record of our trading prices, or an offer of, or solicitation for a transaction in any financial instrument and thus should not be treated as such. The information provided does not involve any specific investment objectives, financial situation and needs of any specific person who may receive it. Please be aware, that past performance is not a reliable indicator of future performance and/or results. Past Performance or Forward-looking scenarios based upon the reasonable beliefs of the third-party provider are not a guarantee of future performance. Actual results may differ materially from those anticipated in forward-looking or past performance statements. IC Markets makes no representation or warranty and assumes no liability as to the accuracy or completeness of the information provided, nor any loss arising from any investment based on a recommendation, forecast or any information supplied by any third-party.

Bearish Reversal Ahead?The Fiber (EUR/USD) is rising towards the pivot, which aligns with the 61.8% Fibonacci retracement and could reverse to the 1st support which is a pullback support.
Pivot: 1.1678
1st Support: 1.1532
1st Resistance: 1.1772
Risk Warning:
Trading Forex and CFDs carries a high level of risk to your capital and you should only trade with money you can afford to lose. Trading Forex and CFDs may not be suitable for all investors, so please ensure that you fully understand the risks involved and seek independent advice if necessary.
Disclaimer:
The above opinions given constitute general market commentary, and do not constitute the opinion or advice of IC Markets or any form of personal or investment advice.
Any opinions, news, research, analyses, prices, other information, or links to third-party sites contained on this website are provided on an "as-is" basis, are intended only to be informative, is not an advice nor a recommendation, nor research, or a record of our trading prices, or an offer of, or solicitation for a transaction in any financial instrument and thus should not be treated as such. The information provided does not involve any specific investment objectives, financial situation and needs of any specific person who may receive it. Please be aware, that past performance is not a reliable indicator of future performance and/or results. Past Performance or Forward-looking scenarios based upon the reasonable beliefs of the third-party provider are not a guarantee of future performance. Actual results may differ materially from those anticipated in forward-looking or past performance statements. IC Markets makes no representation or warranty and assumes no liability as to the accuracy or completeness of the information provided, nor any loss arising from any investment based on a recommendation, forecast or any information supplied by any third-party.
