Bullish reversal?The Kiwi (NZD/USD) is reacting off the pivot, which acts as a pullback support and could rise to the 1st resistance, which is a pullback resistance.
Pivot: 0.5847
1st Support: 0.5803
1st Resistance: 0.5914
Risk Warning:
Trading Forex and CFDs carries a high level of risk to your capital and you should only trade with money you can afford to lose. Trading Forex and CFDs may not be suitable for all investors, so please ensure that you fully understand the risks involved and seek independent advice if necessary.
Disclaimer:
The above opinions given constitute general market commentary, and do not constitute the opinion or advice of IC Markets or any form of personal or investment advice.
Any opinions, news, research, analyses, prices, other information, or links to third-party sites contained on this website are provided on an "as-is" basis, are intended only to be informative, is not an advice nor a recommendation, nor research, or a record of our trading prices, or an offer of, or solicitation for a transaction in any financial instrument and thus should not be treated as such. The information provided does not involve any specific investment objectives, financial situation and needs of any specific person who may receive it. Please be aware, that past performance is not a reliable indicator of future performance and/or results. Past Performance or Forward-looking scenarios based upon the reasonable beliefs of the third-party provider are not a guarantee of future performance. Actual results may differ materially from those anticipated in forward-looking or past performance statements. IC Markets makes no representation or warranty and assumes no liability as to the accuracy or completeness of the information provided, nor any loss arising from any investment based on a recommendation, forecast or any information supplied by any third-party.
Forexsignals

Could the price reverse from here?The Aussie (AUD/USD) is reacting off the pivot that lines up with the 50% Fibonacci retracement and could drop to the 1st support.
Pivot: 0.6492
1st Support: 0.6451
1st Resistance: 0.6530
Risk Warning:
Trading Forex and CFDs carries a high level of risk to your capital and you should only trade with money you can afford to lose. Trading Forex and CFDs may not be suitable for all investors, so please ensure that you fully understand the risks involved and seek independent advice if necessary.
Disclaimer:
The above opinions given constitute general market commentary, and do not constitute the opinion or advice of IC Markets or any form of personal or investment advice.
Any opinions, news, research, analyses, prices, other information, or links to third-party sites contained on this website are provided on an "as-is" basis, are intended only to be informative, is not an advice nor a recommendation, nor research, or a record of our trading prices, or an offer of, or solicitation for a transaction in any financial instrument and thus should not be treated as such. The information provided does not involve any specific investment objectives, financial situation and needs of any specific person who may receive it. Please be aware, that past performance is not a reliable indicator of future performance and/or results. Past Performance or Forward-looking scenarios based upon the reasonable beliefs of the third-party provider are not a guarantee of future performance. Actual results may differ materially from those anticipated in forward-looking or past performance statements. IC Markets makes no representation or warranty and assumes no liability as to the accuracy or completeness of the information provided, nor any loss arising from any investment based on a recommendation, forecast or any information supplied by any third-party.

Bullish bounce for the Fiber?The price is falling towards the pivot, which acts as an overlap support and could bounce to the 1st resistance, which is a pullback resistance.
Pivot: 1.1591
1st Suport: 1.1532
1st Resistance: 1.1677
Risk Warning:
Trading Forex and CFDs carries a high level of risk to your capital and you should only trade with money you can afford to lose. Trading Forex and CFDs may not be suitable for all investors, so please ensure that you fully understand the risks involved and seek independent advice if necessary.
Disclaimer:
The above opinions given constitute general market commentary, and do not constitute the opinion or advice of IC Markets or any form of personal or investment advice.
Any opinions, news, research, analyses, prices, other information, or links to third-party sites contained on this website are provided on an "as-is" basis, are intended only to be informative, is not an advice nor a recommendation, nor research, or a record of our trading prices, or an offer of, or solicitation for a transaction in any financial instrument and thus should not be treated as such. The information provided does not involve any specific investment objectives, financial situation and needs of any specific person who may receive it. Please be aware, that past performance is not a reliable indicator of future performance and/or results. Past Performance or Forward-looking scenarios based upon the reasonable beliefs of the third-party provider are not a guarantee of future performance. Actual results may differ materially from those anticipated in forward-looking or past performance statements. IC Markets makes no representation or warranty and assumes no liability as to the accuracy or completeness of the information provided, nor any loss arising from any investment based on a recommendation, forecast or any information supplied by any third-party.

Bullish bounce off major support?The Cable (GBP/USD) is falling towards the pivot, which has been identified as an overlap support and could bounce to the 1st resistance.
Pivot: 1.3390
1st Support: 1.3270
1st Resistance: 1.3524
Risk Warning:
Trading Forex and CFDs carries a high level of risk to your capital and you should only trade with money you can afford to lose. Trading Forex and CFDs may not be suitable for all investors, so please ensure that you fully understand the risks involved and seek independent advice if necessary.
Disclaimer:
The above opinions given constitute general market commentary, and do not constitute the opinion or advice of IC Markets or any form of personal or investment advice.
Any opinions, news, research, analyses, prices, other information, or links to third-party sites contained on this website are provided on an "as-is" basis, are intended only to be informative, is not an advice nor a recommendation, nor research, or a record of our trading prices, or an offer of, or solicitation for a transaction in any financial instrument and thus should not be treated as such. The information provided does not involve any specific investment objectives, financial situation and needs of any specific person who may receive it. Please be aware, that past performance is not a reliable indicator of future performance and/or results. Past Performance or Forward-looking scenarios based upon the reasonable beliefs of the third-party provider are not a guarantee of future performance. Actual results may differ materially from those anticipated in forward-looking or past performance statements. IC Markets makes no representation or warranty and assumes no liability as to the accuracy or completeness of the information provided, nor any loss arising from any investment based on a recommendation, forecast or any information supplied by any third-party.

EUR/USD at Critical Buying Zone | Liquidity Grab Before 1.1800?EUR/USD at Critical Buying Zone ⚡ | Liquidity Grab Before 1.1800?
Market Structure
BOS (Break of Structure):
Around late June, price broke to the upside, confirming bullish order flow.
In early August, another BOS occurred to the downside, showing a short-term bearish shift.
Current price action is consolidating within a range between 1.1600 – 1.1700, with liquidity resting on both sides.
Key Zones
Support Zone: 1.1350 – 1.1450
Strong demand area that previously initiated a bullish rally.
Buying Zone (1.1600 region):
Price is currently testing this level. Historically, this zone acted as a re-accumulation base before pushing higher.
Resistance Zone: 1.1750 – 1.1850
A supply area where sellers previously took control.
Liquidity & Fair Value Gap
FVG (Fair Value Gap): identified below resistance; this is an imbalance zone where price could revisit before any major continuation.
Liquidity (“$$$”): resting above the short-term highs near 1.1720; market may grab these buy-side stops before reversing lower.
Scenario Outlook
Bullish Case:
If price holds the Buying Zone (1.1600 support), expect liquidity sweep above 1.1720 and a push toward 1.1800–1.1850 resistance.
Bearish Case:
Failure to defend 1.1600 could trigger a deeper decline back toward 1.1400 support zone.
Bias
Currently, the chart suggests a liquidity grab and bullish continuation scenario. The drawn projection hints at a short-term sweep of lows (below 1.1600) followed by a strong rally toward resistance at 1.1800.

Potential bearish drop?AUD/USD is reacting off the resistance lev which is a pullback resistance that aligns with the 50% Fibonacci retracement and could drop from this levle to our take profit.
Entry: 0.6491
Why we like it:
There is a pullback resistance that aligns with the 50% Fibonacci retracement.
Stop loss: 0.6519
Why we llike it:
There is a pullback resistance level.
Take profit: 0.6451
Why we like it:
There is a pullback support that lines up with the 61.8% Fibonacci retracement.
Enjoying your TradingView experience? Review us!
Please be advised that the information presented on TradingView is provided to Vantage (‘Vantage Global Limited’, ‘we’) by a third-party provider (‘Everest Fortune Group’). Please be reminded that you are solely responsible for the trading decisions on your account. There is a very high degree of risk involved in trading. Any information and/or content is intended entirely for research, educational and informational purposes only and does not constitute investment or consultation advice or investment strategy. The information is not tailored to the investment needs of any specific person and therefore does not involve a consideration of any of the investment objectives, financial situation or needs of any viewer that may receive it. Kindly also note that past performance is not a reliable indicator of future results. Actual results may differ materially from those anticipated in forward-looking or past performance statements. We assume no liability as to the accuracy or completeness of any of the information and/or content provided herein and the Company cannot be held responsible for any omission, mistake nor for any loss or damage including without limitation to any loss of profit which may arise from reliance on any information supplied by Everest Fortune Group.

Could the price reverse from here?USD/JPY is rising towards the resistance level, which is a pullback resistance that lines up with the 61.8% Fibonacci retracement and could reverse from this level to our take profit.
Entry: 148.02
Why we like it:
There is a pullback resistance that lines up with the 61.8% Fibonacci retracement.
Stop loss: 148.74
Why we like it:
There is a pullback resistance.
Take profit: 146.37
Why we like it:
There is a pullback support that aligns with the 127.2% Fibonacci extension.
Enjoying your TradingView experience? Review us!
Please be advised that the information presented on TradingView is provided to Vantage (‘Vantage Global Limited’, ‘we’) by a third-party provider (‘Everest Fortune Group’). Please be reminded that you are solely responsible for the trading decisions on your account. There is a very high degree of risk involved in trading. Any information and/or content is intended entirely for research, educational and informational purposes only and does not constitute investment or consultation advice or investment strategy. The information is not tailored to the investment needs of any specific person and therefore does not involve a consideration of any of the investment objectives, financial situation or needs of any viewer that may receive it. Kindly also note that past performance is not a reliable indicator of future results. Actual results may differ materially from those anticipated in forward-looking or past performance statements. We assume no liability as to the accuracy or completeness of any of the information and/or content provided herein and the Company cannot be held responsible for any omission, mistake nor for any loss or damage including without limitation to any loss of profit which may arise from reliance on any information supplied by Everest Fortune Group.

Bullish bounce off?USD/CAD has bounced off the support leve which is a pullback support that lines up with the 50% Fibonacci retracement and could potentially rise from this leve to our take profit.
Entry: 1.3815
Why we like it:
There is a pullback support that lines up with the 50% Fibonacci retracement.
Stop loss: 1.3752
Why we like it:
There is a pullback support that is slightly below the 78.6% Fibonacci retracement.
Take profit: 1.3917
Why we like it:
There is a swing high resistance.
Enjoying your TradingView experience? Review us!
Please be advised that the information presented on TradingView is provided to Vantage (‘Vantage Global Limited’, ‘we’) by a third-party provider (‘Everest Fortune Group’). Please be reminded that you are solely responsible for the trading decisions on your account. There is a very high degree of risk involved in trading. Any information and/or content is intended entirely for research, educational and informational purposes only and does not constitute investment or consultation advice or investment strategy. The information is not tailored to the investment needs of any specific person and therefore does not involve a consideration of any of the investment objectives, financial situation or needs of any viewer that may receive it. Kindly also note that past performance is not a reliable indicator of future results. Actual results may differ materially from those anticipated in forward-looking or past performance statements. We assume no liability as to the accuracy or completeness of any of the information and/or content provided herein and the Company cannot be held responsible for any omission, mistake nor for any loss or damage including without limitation to any loss of profit which may arise from reliance on any information supplied by Everest Fortune Group.

Potential bearish drop off 61.8% Fibonacci resistance?GBP/USD has rejected off the resistance level which is a pullback resistance that aligns with the 61.8% Fibonacci retracement and could drop from this level to our take profit.
Entry: 1.3520
Why we like it:
There is a pullback resistance that lines up with the 61.8% Fibonacci retracement.
Stop loss: 1.3579
Why we like it:
There is a multi-swing high resistance.
Take profit: 1.3399
Why we like it:
There is an overlap support level.
Enjoying your TradingView experience? Review us!
Please be advised that the information presented on TradingView is provided to Vantage (‘Vantage Global Limited’, ‘we’) by a third-party provider (‘Everest Fortune Group’). Please be reminded that you are solely responsible for the trading decisions on your account. There is a very high degree of risk involved in trading. Any information and/or content is intended entirely for research, educational and informational purposes only and does not constitute investment or consultation advice or investment strategy. The information is not tailored to the investment needs of any specific person and therefore does not involve a consideration of any of the investment objectives, financial situation or needs of any viewer that may receive it. Kindly also note that past performance is not a reliable indicator of future results. Actual results may differ materially from those anticipated in forward-looking or past performance statements. We assume no liability as to the accuracy or completeness of any of the information and/or content provided herein and the Company cannot be held responsible for any omission, mistake nor for any loss or damage including without limitation to any loss of profit which may arise from reliance on any information supplied by Everest Fortune Group.

GOLD BUY XAUUSD Gold buy , gold looking good with potential to the upside and complete its trend will keep following it and keeping it simple
EURUSD Is it about to experience a big drop??The EURUSD pair has been consolidating under moderate pressure since the June 30 (weekly) High with its 1W RSI basically ranged since April 14.
We have seen this sequence of sideways 1W RSI trading after hitting the overbought (70.00) level another 3 times in the past 8 years. All of those times, the market priced a long-term Top there or shortly after.
In all instances, the first Target was the 1W MA50 (blue trend-line), with the price even going as low as the 0.382 Fibonacci retracement level.
If the Top this time was already priced in June, then we should be expecting a Target of at least 1.1200 on the medium-term, which would be a potential contact with the 1W MA50 and marginally above the 0.382 Fib.
-------------------------------------------------------------------------------
** Please LIKE 👍, FOLLOW ✅, SHARE 🙌 and COMMENT ✍ if you enjoy this idea! Also share your ideas and charts in the comments section below! This is best way to keep it relevant, support us, keep the content here free and allow the idea to reach as many people as possible. **
-------------------------------------------------------------------------------
Disclosure: I am part of Trade Nation's Influencer program and receive a monthly fee for using their TradingView charts in my analysis.
💸💸💸💸💸💸
👇 👇 👇 👇 👇 👇

EURUSD is slow moving. Wait for more factors to enter orders✏️ EURUSD is trading in a consolidation range, the trend to trade at the moment is not there. Wait for clearer momentum at resistance or support zones to set up Orders. 1.154 plays an important support role at the moment of the bullish wave structure, it is the confluence point of the Trendline and the support zone of the BUY side. In the opposite direction, the resistance 1.171 plays the role of the upper boundary of the price channel.
📉 Key Levels
BUY Trigger Rejection at support1.154
BUY DCA Trigger Breakout of resistance 1.171
Leave your comments on the idea. I am happy to read your views.

XAUUSD Critical Reversal Zone | XAUUSD Rejection or Breakout?XAUUSD Critical Reversal Zone | XAUUSD Rejection or Breakout?
Key Observations:
Resistance Zone (Strong Supply Area):
Price has shown multiple rejections around 3400–3440, confirming this region as a strong resistance.
A prior liquidity sweep ($$$) was observed above this zone, trapping buyers and triggering a sell-off.
Support Zone (Demand Area):
A solid base exists around 3260–3280, highlighted as strong support.
Price previously formed a higher low in this area, signaling that buyers are still defending.
Market Structure:
We observed a BOS (Break of Structure) earlier, followed by a fair value gap (FVG), which price later mitigated.
The current structure remains range-bound, with lower highs forming against a defended support.
Liquidity has been swept both above resistance and around key intraday lows.
Current Setup:
Price is trading within the entry zone (3360–3380).
A short trade setup is marked with a stop loss above 3380–3400 and a target around 3320–3300.
This reflects a risk-to-reward short opportunity favoring sellers if rejection holds.
📊 Trading Plan:
Short Bias:
Entry Zone: 3360–3380
Stop Loss: Above 3400
Target 1: 3320
Target 2: 3280 (major support)
Invalidation:
A clean breakout and close above 3400–3420 would invalidate the bearish setup, opening the way for retesting 3440 resistance.

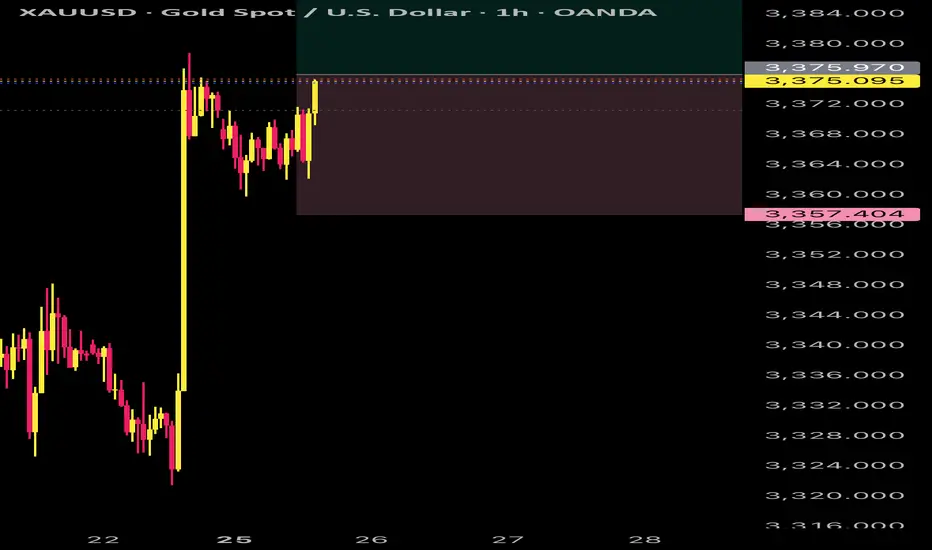
Xauusd analysis is Ready (Read The Caption) This chart shows a bullish analysis for Gold (XAU/USD) on the 1-hour timeframe.
A breakout from the triangle pattern is highlighted, suggesting upward momentum.
Price is currently trading around 3364, above the support zone near 3353.
The trend line provides confirmation of bullish structure.
The analysis points to two upside targets:
First Target: around 3393
Second Target: around 3421
Overall, the chart suggests a continuation of bullish movement as long as the price holds above the support zone.

USDCAD: Pullback Continues 🇺🇸🇨🇦
There is a high chance that USDCAD will recover
after a formation of a huge FVG on Friday.
As a confirmation, I see a bullish Change of Character
on an hourly time frame.
Goal - 1.385
❤️Please, support my work with like, thank you!❤️
I am part of Trade Nation's Influencer program and receive a monthly fee for using their TradingView charts in my analysis.

Buy the Dips? EURUSD Says "Yes" Above 1.161. What happened recently
After the false break of support at the end of last month, EURUSD recovered quickly. In just seven days, the pair was back above the 1.16 zone, suggesting that bulls considered this area an attractive price for buying. From there, the rally extended toward 1.17 before fading once more.
2. The reaction at support
Unlike the previous attempt, this time the 1.16 zone held firmly. Friday’s strong rebound came exactly from this level, leaving behind a clear bullish engulfing candle.
3. What’s next
Now, EURUSD is once again facing resistance. The next move from here could define the market’s direction for the next 2–3 weeks. A breakout above this level would open the door toward the key 1.20 zone, and potentially 1.22 as the next technical resistance, especially if USD sentiment continues to deteriorate.
4. Trading plan
As long as 1.16 remains intact, the broader outlook is bullish. The strategy remains the same: buying dips, preferably around 1.1650, while keeping an eye on the resistance zone for confirmation.
Disclosure: I am part of TradeNation's Influencer program and receive a monthly fee for using their TradingView charts in my analyses and educational articles.

USDCHF: Bearish After the News 🇺🇸🇨🇭
USDCHF broke and closed below a major horizontal support
last week.
After a retest of a broken structure, the price formed a bearish
imbalance candle with a release of Swiss unemployment data
this morning.
I think that the price will drop lower and reach 0.8004 level soon.
❤️Please, support my work with like, thank you!❤️
I am part of Trade Nation's Influencer program and receive a monthly fee for using their TradingView charts in my analysis.

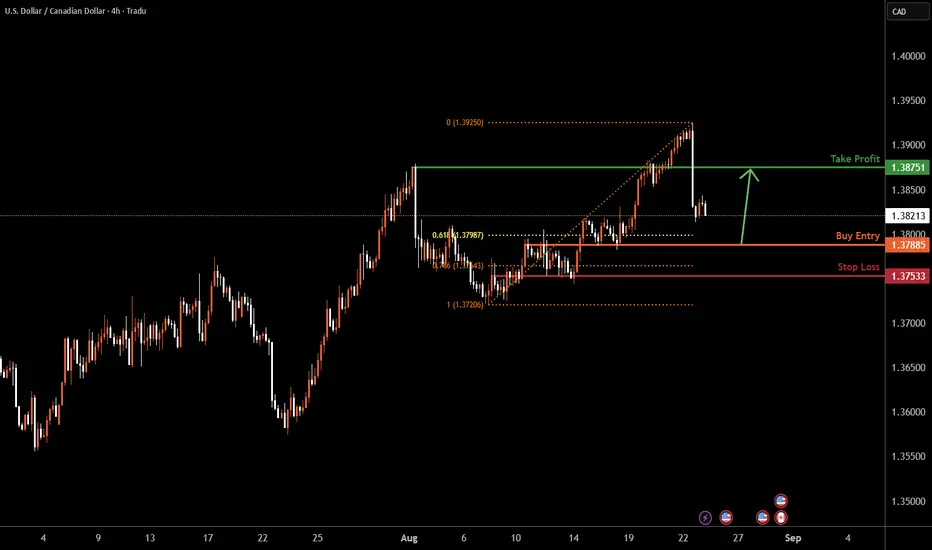
USDCAD H4 | Falling towards overlap supportUSD/CAD is falling towards the buy entry which is an overlap support that is slightly below the 61.8% Fibonacci retracement and could bounce from this level to the upside.
Buy entry is at 1.3788, which is an overlap support that is slightly below the 61.8% Fibonacci retracement.
Stop loss is at 1.3753, which is a pullback support that is slightly below the 78.6% Fibonacci retracement.
Take profit is at 1.3875, which is a pullback resistance.
High Risk Investment Warning
Trading Forex/CFDs on margin carries a high level of risk and may not be suitable for all investors. Leverage can work against you.
Stratos Markets Limited (tradu.com ):
CFDs are complex instruments and come with a high risk of losing money rapidly due to leverage. 65% of retail investor accounts lose money when trading CFDs with this provider. You should consider whether you understand how CFDs work and whether you can afford to take the high risk of losing your money.
Stratos Europe Ltd (tradu.com ):
CFDs are complex instruments and come with a high risk of losing money rapidly due to leverage. 66% of retail investor accounts lose money when trading CFDs with this provider. You should consider whether you understand how CFDs work and whether you can afford to take the high risk of losing your money.
Stratos Global LLC (tradu.com ):
Losses can exceed deposits.
Please be advised that the information presented on TradingView is provided to Tradu (‘Company’, ‘we’) by a third-party provider (‘TFA Global Pte Ltd’). Please be reminded that you are solely responsible for the trading decisions on your account. There is a very high degree of risk involved in trading. Any information and/or content is intended entirely for research, educational and informational purposes only and does not constitute investment or consultation advice or investment strategy. The information is not tailored to the investment needs of any specific person and therefore does not involve a consideration of any of the investment objectives, financial situation or needs of any viewer that may receive it. Kindly also note that past performance is not a reliable indicator of future results. Actual results may differ materially from those anticipated in forward-looking or past performance statements. We assume no liability as to the accuracy or completeness of any of the information and/or content provided herein and the Company cannot be held responsible for any omission, mistake nor for any loss or damage including without limitation to any loss of profit which may arise from reliance on any information supplied by TFA Global Pte Ltd.
The speaker(s) is neither an employee, agent nor representative of Tradu and is therefore acting independently. The opinions given are their own, constitute general market commentary, and do not constitute the opinion or advice of Tradu or any form of personal or investment advice. Tradu neither endorses nor guarantees offerings of third
AUSSIE H4 | Bullish reversalBased on the H4 chart analysis, we can see that the price has bounced off the buy entry, identified as an overlap support, and could continue rising to the upside.
Buy entry is at 0.6481, which is an overlap support.
Stop loss is at 0.64450, which is a pullback support.
Take profit is at 0.6551, which is a swing high resistance.
High Risk Investment Warning
Trading Forex/CFDs on margin carries a high level of risk and may not be suitable for all investors. Leverage can work against you.
Stratos Markets Limited (tradu.com ):
CFDs are complex instruments and come with a high risk of losing money rapidly due to leverage. 65% of retail investor accounts lose money when trading CFDs with this provider. You should consider whether you understand how CFDs work and whether you can afford to take the high risk of losing your money.
Stratos Europe Ltd (tradu.com ):
CFDs are complex instruments and come with a high risk of losing money rapidly due to leverage. 66% of retail investor accounts lose money when trading CFDs with this provider. You should consider whether you understand how CFDs work and whether you can afford to take the high risk of losing your money.
Stratos Global LLC (tradu.com ):
Losses can exceed deposits.
Please be advised that the information presented on TradingView is provided to Tradu (‘Company’, ‘we’) by a third-party provider (‘TFA Global Pte Ltd’). Please be reminded that you are solely responsible for the trading decisions on your account. There is a very high degree of risk involved in trading. Any information and/or content is intended entirely for research, educational and informational purposes only and does not constitute investment or consultation advice or investment strategy. The information is not tailored to the investment needs of any specific person and therefore does not involve a consideration of any of the investment objectives, financial situation or needs of any viewer that may receive it. Kindly also note that past performance is not a reliable indicator of future results. Actual results may differ materially from those anticipated in forward-looking or past performance statements. We assume no liability as to the accuracy or completeness of any of the information and/or content provided herein and the Company cannot be held responsible for any omission, mistake nor for any loss or damage including without limitation to any loss of profit which may arise from reliance on any information supplied by TFA Global Pte Ltd.
The speaker(s) is neither an employee, agent nor representative of Tradu and is therefore acting independently. The opinions given are their own, constitute general market commentary, and do not constitute the opinion or advice of Tradu or any form of personal or investment advice. Tradu neither endorses nor guarantees offerings of third

USDJPY H4 | Bearish drop off 61.8% Fibonacci resistanceUSD/JPY is rising towards the sell entry which is a pullback resistance that aligns with the 61.8% Fibonacci retracement and could reverse from this level to the downside.
Sell entry is at 147.86, which is a pullback resistance that aligns with the 61.8% Fibonacci retracement.
Stop loss is at 148.73, which is an overlap resistance.
Take profit is at 145.93, which is an overlap support that aligns with the 61.8% Fibonacci retracement.
High Risk Investment Warning
Trading Forex/CFDs on margin carries a high level of risk and may not be suitable for all investors. Leverage can work against you.
Stratos Markets Limited (tradu.com ):
CFDs are complex instruments and come with a high risk of losing money rapidly due to leverage. 65% of retail investor accounts lose money when trading CFDs with this provider. You should consider whether you understand how CFDs work and whether you can afford to take the high risk of losing your money.
Stratos Europe Ltd (tradu.com ):
CFDs are complex instruments and come with a high risk of losing money rapidly due to leverage. 66% of retail investor accounts lose money when trading CFDs with this provider. You should consider whether you understand how CFDs work and whether you can afford to take the high risk of losing your money.
Stratos Global LLC (tradu.com ):
Losses can exceed deposits.
Please be advised that the information presented on TradingView is provided to Tradu (‘Company’, ‘we’) by a third-party provider (‘TFA Global Pte Ltd’). Please be reminded that you are solely responsible for the trading decisions on your account. There is a very high degree of risk involved in trading. Any information and/or content is intended entirely for research, educational and informational purposes only and does not constitute investment or consultation advice or investment strategy. The information is not tailored to the investment needs of any specific person and therefore does not involve a consideration of any of the investment objectives, financial situation or needs of any viewer that may receive it. Kindly also note that past performance is not a reliable indicator of future results. Actual results may differ materially from those anticipated in forward-looking or past performance statements. We assume no liability as to the accuracy or completeness of any of the information and/or content provided herein and the Company cannot be held responsible for any omission, mistake nor for any loss or damage including without limitation to any loss of profit which may arise from reliance on any information supplied by TFA Global Pte Ltd.
The speaker(s) is neither an employee, agent nor representative of Tradu and is therefore acting independently. The opinions given are their own, constitute general market commentary, and do not constitute the opinion or advice of Tradu or any form of personal or investment advice. Tradu neither endorses nor guarantees offerings of third

USDCHF H4 | Bullish bounce offThe Swissie (USD/CHF) has bounced off the buy entry which is an overlap support that lines up with the 138.2% Fibonacci extension and could potentially rise from this level to the take profit.
Buy entry is at 0.7992, which acts as an overlap support that aligns with the 138.2% Fibonacci extension.
Stop loss is at 0.7943, which is a pullback support.
Take profit is at 0.8086, which is a pullback resistance.
High Risk Investment Warning
Trading Forex/CFDs on margin carries a high level of risk and may not be suitable for all investors. Leverage can work against you.
Stratos Markets Limited (tradu.com ):
CFDs are complex instruments and come with a high risk of losing money rapidly due to leverage. 65% of retail investor accounts lose money when trading CFDs with this provider. You should consider whether you understand how CFDs work and whether you can afford to take the high risk of losing your money.
Stratos Europe Ltd (tradu.com ):
CFDs are complex instruments and come with a high risk of losing money rapidly due to leverage. 66% of retail investor accounts lose money when trading CFDs with this provider. You should consider whether you understand how CFDs work and whether you can afford to take the high risk of losing your money.
Stratos Global LLC (tradu.com ):
Losses can exceed deposits.
Please be advised that the information presented on TradingView is provided to Tradu (‘Company’, ‘we’) by a third-party provider (‘TFA Global Pte Ltd’). Please be reminded that you are solely responsible for the trading decisions on your account. There is a very high degree of risk involved in trading. Any information and/or content is intended entirely for research, educational and informational purposes only and does not constitute investment or consultation advice or investment strategy. The information is not tailored to the investment needs of any specific person and therefore does not involve a consideration of any of the investment objectives, financial situation or needs of any viewer that may receive it. Kindly also note that past performance is not a reliable indicator of future results. Actual results may differ materially from those anticipated in forward-looking or past performance statements. We assume no liability as to the accuracy or completeness of any of the information and/or content provided herein and the Company cannot be held responsible for any omission, mistake nor for any loss or damage including without limitation to any loss of profit which may arise from reliance on any information supplied by TFA Global Pte Ltd.
The speaker(s) is neither an employee, agent nor representative of Tradu and is therefore acting independently. The opinions given are their own, constitute general market commentary, and do not constitute the opinion or advice of Tradu or any form of personal or investment advice. Tradu neither endorses nor guarantees offerings of third

GBPUSD H4 | Potential bearish reversalGBP/USD is reacting off the sell entry which has been identified as a pullback resistance that lines up with the 61.8% Fibonacci retracement and could drop from this level to the downside.
Sell entry is at 1.3523, which acts as a pullback resistance that lines up with the 61.8% Fibonacci retracement.
Stop loss is at 1.3595, which is an overlap resistance.
Take profit is 1.3399, which acts as an overlap support.
High Risk Investment Warning
Trading Forex/CFDs on margin carries a high level of risk and may not be suitable for all investors. Leverage can work against you.
Stratos Markets Limited (tradu.com ):
CFDs are complex instruments and come with a high risk of losing money rapidly due to leverage. 65% of retail investor accounts lose money when trading CFDs with this provider. You should consider whether you understand how CFDs work and whether you can afford to take the high risk of losing your money.
Stratos Europe Ltd (tradu.com ):
CFDs are complex instruments and come with a high risk of losing money rapidly due to leverage. 66% of retail investor accounts lose money when trading CFDs with this provider. You should consider whether you understand how CFDs work and whether you can afford to take the high risk of losing your money.
Stratos Global LLC (tradu.com ):
Losses can exceed deposits.
Please be advised that the information presented on TradingView is provided to Tradu (‘Company’, ‘we’) by a third-party provider (‘TFA Global Pte Ltd’). Please be reminded that you are solely responsible for the trading decisions on your account. There is a very high degree of risk involved in trading. Any information and/or content is intended entirely for research, educational and informational purposes only and does not constitute investment or consultation advice or investment strategy. The information is not tailored to the investment needs of any specific person and therefore does not involve a consideration of any of the investment objectives, financial situation or needs of any viewer that may receive it. Kindly also note that past performance is not a reliable indicator of future results. Actual results may differ materially from those anticipated in forward-looking or past performance statements. We assume no liability as to the accuracy or completeness of any of the information and/or content provided herein and the Company cannot be held responsible for any omission, mistake nor for any loss or damage including without limitation to any loss of profit which may arise from reliance on any information supplied by TFA Global Pte Ltd.
The speaker(s) is neither an employee, agent nor representative of Tradu and is therefore acting independently. The opinions given are their own, constitute general market commentary, and do not constitute the opinion or advice of Tradu or any form of personal or investment advice. Tradu neither endorses nor guarantees offerings of third

EURUSD H4 | Bearish dropEUR/USD is rising to the sell entry, which acts as a pullback resistance and could reverse from this level to the downside.
Sell entry is at 1.1717, which is a pullback resistance.
Stop loss is at 1.1786, which acts as a swing high resistance that is slightly above the 138.2% Fibonacci extension.
Take profit is at 1.1629, which has been identified as a pullback support that is slightly below the 61.8% Fibonacci retracement.
High Risk Investment Warning
Trading Forex/CFDs on margin carries a high level of risk and may not be suitable for all investors. Leverage can work against you.
Stratos Markets Limited (tradu.com ):
CFDs are complex instruments and come with a high risk of losing money rapidly due to leverage. 65% of retail investor accounts lose money when trading CFDs with this provider. You should consider whether you understand how CFDs work and whether you can afford to take the high risk of losing your money.
Stratos Europe Ltd (tradu.com ):
CFDs are complex instruments and come with a high risk of losing money rapidly due to leverage. 66% of retail investor accounts lose money when trading CFDs with this provider. You should consider whether you understand how CFDs work and whether you can afford to take the high risk of losing your money.
Stratos Global LLC (tradu.com ):
Losses can exceed deposits.
Please be advised that the information presented on TradingView is provided to Tradu (‘Company’, ‘we’) by a third-party provider (‘TFA Global Pte Ltd’). Please be reminded that you are solely responsible for the trading decisions on your account. There is a very high degree of risk involved in trading. Any information and/or content is intended entirely for research, educational and informational purposes only and does not constitute investment or consultation advice or investment strategy. The information is not tailored to the investment needs of any specific person and therefore does not involve a consideration of any of the investment objectives, financial situation or needs of any viewer that may receive it. Kindly also note that past performance is not a reliable indicator of future results. Actual results may differ materially from those anticipated in forward-looking or past performance statements. We assume no liability as to the accuracy or completeness of any of the information and/or content provided herein and the Company cannot be held responsible for any omission, mistake nor for any loss or damage including without limitation to any loss of profit which may arise from reliance on any information supplied by TFA Global Pte Ltd.
The speaker(s) is neither an employee, agent nor representative of Tradu and is therefore acting independently. The opinions given are their own, constitute general market commentary, and do not constitute the opinion or advice of Tradu or any form of personal or investment advice. Tradu neither endorses nor guarantees offerings of third-party speakers, nor is Tradu responsible for the content, veracity or opinions of third-party speakers, presenters or participants.
