GBP/USD SetupThis GBP/USD 1H analysis shows a bearish outlook. Price is expected to reverse down from the current level with a stop loss at 1.3592, aiming for the target zone around 1.3343. The chart highlights potential pullbacks before continuing lower within the downtrend channel.
Forexsignals

NZD/JPY Potential Bullish ContinuationNew Zealand Dollar/Yen price seems to exhibit signs of potential bullish momentum as the price action may form a credible Higher Low on key Fibonacci and Support levels.
Trade Plan :
Entry @ 86.29
Stop Loss @ 84.85
TP 0.9 - 1 @ 87.586 - 87.730

Heading into pullback resitance?The Aussie (AUD/USD) is rising towards the pivot, which has been identified as a pullback resistance and could reverse to the 1st support, which is a swing low support.
Pivot: 0.6546
1st Support: 0.6414
1st Resistance: 0.6604
Risk Warning:
Trading Forex and CFDs carries a high level of risk to your capital and you should only trade with money you can afford to lose. Trading Forex and CFDs may not be suitable for all investors, so please ensure that you fully understand the risks involved and seek independent advice if necessary.
Disclaimer:
The above opinions given constitute general market commentary, and do not constitute the opinion or advice of IC Markets or any form of personal or investment advice.
Any opinions, news, research, analyses, prices, other information, or links to third-party sites contained on this website are provided on an "as-is" basis, are intended only to be informative, is not an advice nor a recommendation, nor research, or a record of our trading prices, or an offer of, or solicitation for a transaction in any financial instrument and thus should not be treated as such. The information provided does not involve any specific investment objectives, financial situation and needs of any specific person who may receive it. Please be aware, that past performance is not a reliable indicator of future performance and/or results. Past Performance or Forward-looking scenarios based upon the reasonable beliefs of the third-party provider are not a guarantee of future performance. Actual results may differ materially from those anticipated in forward-looking or past performance statements. IC Markets makes no representation or warranty and assumes no liability as to the accuracy or completeness of the information provided, nor any loss arising from any investment based on a recommendation, forecast or any information supplied by any third-party.

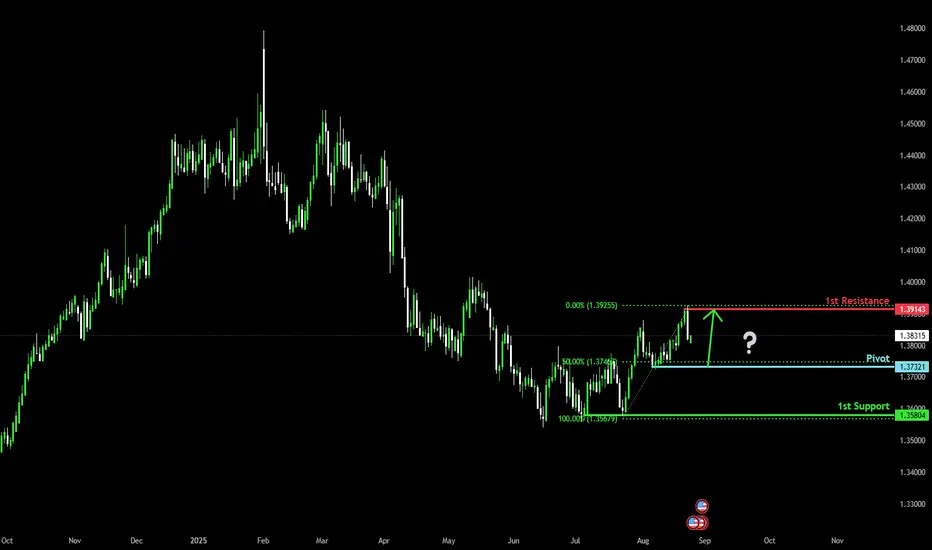
Bullish bounce off 50% Fibonacci support?The Loonie (USD/CAD) is falling towards the pivot, which acts as a pullback support that lines up with the 50% Fibonacci retracement and could bounce to the 1st resistance.
Pivot: 1.3732
1st Support: 1.3580
1st Resistance: 1.3914
Risk Warning:
Trading Forex and CFDs carries a high level of risk to your capital and you should only trade with money you can afford to lose. Trading Forex and CFDs may not be suitable for all investors, so please ensure that you fully understand the risks involved and seek independent advice if necessary.
Disclaimer:
The above opinions given constitute general market commentary, and do not constitute the opinion or advice of IC Markets or any form of personal or investment advice.
Any opinions, news, research, analyses, prices, other information, or links to third-party sites contained on this website are provided on an "as-is" basis, are intended only to be informative, is not an advice nor a recommendation, nor research, or a record of our trading prices, or an offer of, or solicitation for a transaction in any financial instrument and thus should not be treated as such. The information provided does not involve any specific investment objectives, financial situation and needs of any specific person who may receive it. Please be aware, that past performance is not a reliable indicator of future performance and/or results. Past Performance or Forward-looking scenarios based upon the reasonable beliefs of the third-party provider are not a guarantee of future performance. Actual results may differ materially from those anticipated in forward-looking or past performance statements. IC Markets makes no representation or warranty and assumes no liability as to the accuracy or completeness of the information provided, nor any loss arising from any investment based on a recommendation, forecast or any information supplied by any third-party.
Bullish reversal off pullback support?The Swissie (USD/CHF) is falling towards the pivot and could bounce to the 1st resistance.
Pivot: 0.7915
1st Support: 0.7869
1st Resistance: 0.8089
Risk Warning:
Trading Forex and CFDs carries a high level of risk to your capital and you should only trade with money you can afford to lose. Trading Forex and CFDs may not be suitable for all investors, so please ensure that you fully understand the risks involved and seek independent advice if necessary.
Disclaimer:
The above opinions given constitute general market commentary, and do not constitute the opinion or advice of IC Markets or any form of personal or investment advice.
Any opinions, news, research, analyses, prices, other information, or links to third-party sites contained on this website are provided on an "as-is" basis, are intended only to be informative, is not an advice nor a recommendation, nor research, or a record of our trading prices, or an offer of, or solicitation for a transaction in any financial instrument and thus should not be treated as such. The information provided does not involve any specific investment objectives, financial situation and needs of any specific person who may receive it. Please be aware, that past performance is not a reliable indicator of future performance and/or results. Past Performance or Forward-looking scenarios based upon the reasonable beliefs of the third-party provider are not a guarantee of future performance. Actual results may differ materially from those anticipated in forward-looking or past performance statements. IC Markets makes no representation or warranty and assumes no liability as to the accuracy or completeness of the information provided, nor any loss arising from any investment based on a recommendation, forecast or any information supplied by any third-party.

Potential bullish bounce?USD/JPY is falling towards the pivot, which is a pullback support, and could bounce to the 1st resistance ,which is a pullback resistance.
Pivot: 146.32
1st Support: 143.31
1st Resistance: 151.12
Risk Warning:
Trading Forex and CFDs carries a high level of risk to your capital and you should only trade with money you can afford to lose. Trading Forex and CFDs may not be suitable for all investors, so please ensure that you fully understand the risks involved and seek independent advice if necessary.
Disclaimer:
The above opinions given constitute general market commentary, and do not constitute the opinion or advice of IC Markets or any form of personal or investment advice.
Any opinions, news, research, analyses, prices, other information, or links to third-party sites contained on this website are provided on an "as-is" basis, are intended only to be informative, is not an advice nor a recommendation, nor research, or a record of our trading prices, or an offer of, or solicitation for a transaction in any financial instrument and thus should not be treated as such. The information provided does not involve any specific investment objectives, financial situation and needs of any specific person who may receive it. Please be aware, that past performance is not a reliable indicator of future performance and/or results. Past Performance or Forward-looking scenarios based upon the reasonable beliefs of the third-party provider are not a guarantee of future performance. Actual results may differ materially from those anticipated in forward-looking or past performance statements. IC Markets makes no representation or warranty and assumes no liability as to the accuracy or completeness of the information provided, nor any loss arising from any investment based on a recommendation, forecast or any information supplied by any third-party.

Bearish reversal off pullback resistance?The Fiber (EUR/USD) is rising towards the pivot, which acts as a pullback resistance and could reverse to the 1st support.
Pivot: 1.17782
1st Support: 1.1597
1st Resistance: 1.1897
Risk Warning:
Trading Forex and CFDs carries a high level of risk to your capital and you should only trade with money you can afford to lose. Trading Forex and CFDs may not be suitable for all investors, so please ensure that you fully understand the risks involved and seek independent advice if necessary.
Disclaimer:
The above opinions given constitute general market commentary, and do not constitute the opinion or advice of IC Markets or any form of personal or investment advice.
Any opinions, news, research, analyses, prices, other information, or links to third-party sites contained on this website are provided on an "as-is" basis, are intended only to be informative, is not an advice nor a recommendation, nor research, or a record of our trading prices, or an offer of, or solicitation for a transaction in any financial instrument and thus should not be treated as such. The information provided does not involve any specific investment objectives, financial situation and needs of any specific person who may receive it. Please be aware, that past performance is not a reliable indicator of future performance and/or results. Past Performance or Forward-looking scenarios based upon the reasonable beliefs of the third-party provider are not a guarantee of future performance. Actual results may differ materially from those anticipated in forward-looking or past performance statements. IC Markets makes no representation or warranty and assumes no liability as to the accuracy or completeness of the information provided, nor any loss arising from any investment based on a recommendation, forecast or any information supplied by any third-party.

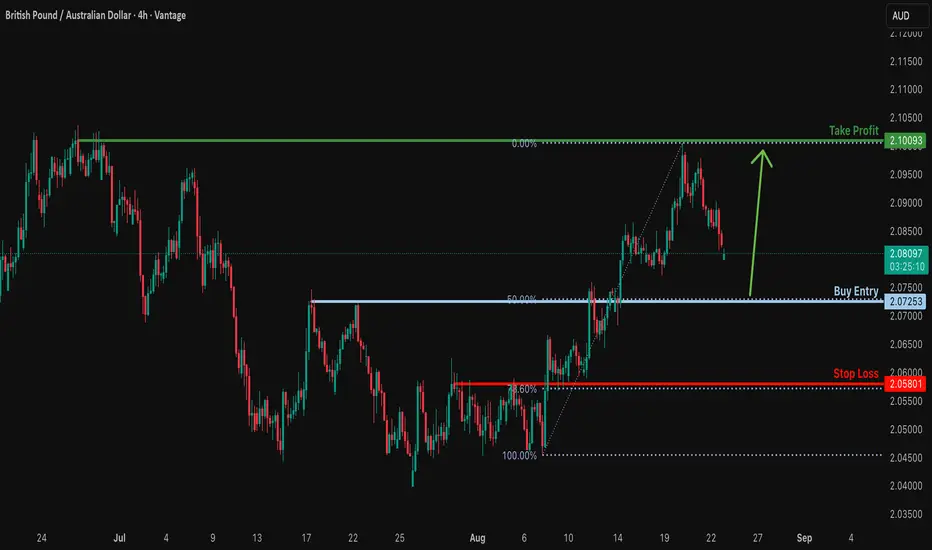
Falling towards 50% Fibonacci support?GBP/AUD is falling towards the support level, which is a pullback support that aligns with the 50% Fibonacci retracement and could bounce from this level to our take profit.
Entry: 2.0725
Why we like it:
There is a pullback support that aligns with the 50% Fibonacci retracement.
Stop loss: 2.0580
Why we like it:
There is an overlap support that lines up with the 78.6% Fibonacci retracement.
Take profit: 2.1009
Why we like it:
There is a multi-swing high resistance.
Enjoying your TradingView experience? Review us!
Please be advised that the information presented on TradingView is provided to Vantage (‘Vantage Global Limited’, ‘we’) by a third-party provider (‘Everest Fortune Group’). Please be reminded that you are solely responsible for the trading decisions on your account. There is a very high degree of risk involved in trading. Any information and/or content is intended entirely for research, educational and informational purposes only and does not constitute investment or consultation advice or investment strategy. The information is not tailored to the investment needs of any specific person and therefore does not involve a consideration of any of the investment objectives, financial situation or needs of any viewer that may receive it. Kindly also note that past performance is not a reliable indicator of future results. Actual results may differ materially from those anticipated in forward-looking or past performance statements. We assume no liability as to the accuracy or completeness of any of the information and/or content provided herein and the Company cannot be held responsible for any omission, mistake nor for any loss or damage including without limitation to any loss of profit which may arise from reliance on any information supplied by Everest Fortune Group.
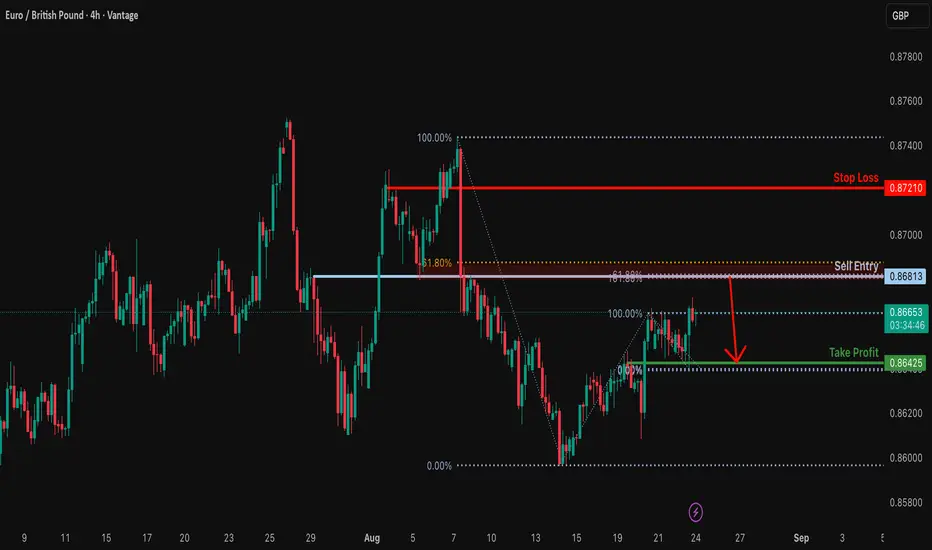
Rising towards Fibonacci confluence?EUR/GBP is rising towards the resistance level, which is an overlap resistance that lines up with the 161.8% Fibonacci extension, 61.8% Fibonacci projection and also slightly below the 61.8% Fibonacci retracement and could reverse from this level to our take profit.
Entry: 0.8681
Why we like it:
There is an overlap resistance that lines up with the 161.8% Fibonacci extension, 61.8% Fibonacci projection and slightly below the 61.8% Fibonacci retracement.
Stop loss: 0.8721
Why we like it:
There is a pullback resistance.
Take profit: 0.8642
Why we like it:
There is a pullback support level.
Enjoying your TradingView experience? Review us!
Please be advised that the information presented on TradingView is provided to Vantage (‘Vantage Global Limited’, ‘we’) by a third-party provider (‘Everest Fortune Group’). Please be reminded that you are solely responsible for the trading decisions on your account. There is a very high degree of risk involved in trading. Any information and/or content is intended entirely for research, educational and informational purposes only and does not constitute investment or consultation advice or investment strategy. The information is not tailored to the investment needs of any specific person and therefore does not involve a consideration of any of the investment objectives, financial situation or needs of any viewer that may receive it. Kindly also note that past performance is not a reliable indicator of future results. Actual results may differ materially from those anticipated in forward-looking or past performance statements. We assume no liability as to the accuracy or completeness of any of the information and/or content provided herein and the Company cannot be held responsible for any omission, mistake nor for any loss or damage including without limitation to any loss of profit which may arise from reliance on any information supplied by Everest Fortune Group.
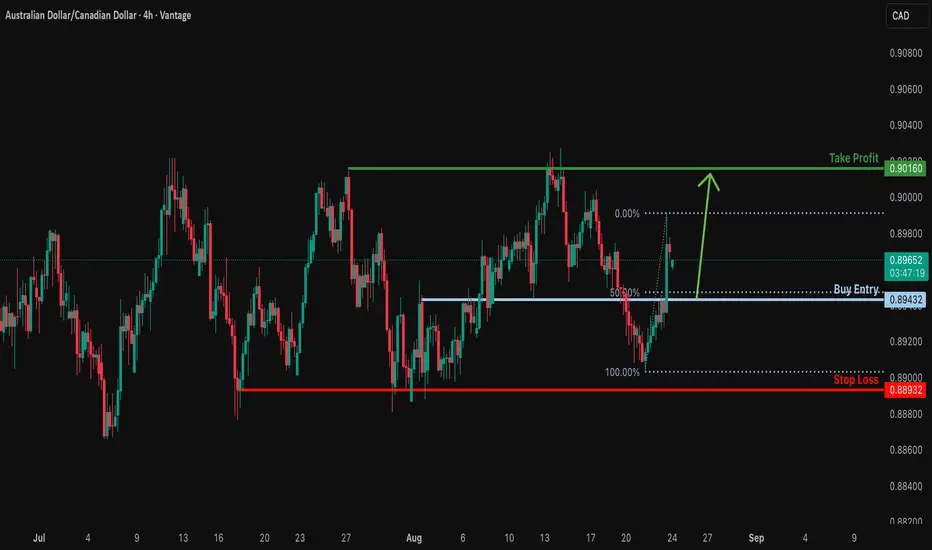
Bullish reversal?AUD/CAD is falling towards the support level, which is an overlap support that lines up with the 50% Fibonacci retracement and could bounce from this level to our take profit.
Entry: 0.89432
Why we like it:
There is an overlap support level that lines up with the 50% Fibonacci retracement.
Stop loss: 0.88932
Why we like it:
There is a multi-swing low support.
Take profit: 0.90160
Why we like it:
There is a multi-swing high resistance.
Enjoying your TradingView experience? Review us!
Please be advised that the information presented on TradingView is provided to Vantage (‘Vantage Global Limited’, ‘we’) by a third-party provider (‘Everest Fortune Group’). Please be reminded that you are solely responsible for the trading decisions on your account. There is a very high degree of risk involved in trading. Any information and/or content is intended entirely for research, educational and informational purposes only and does not constitute investment or consultation advice or investment strategy. The information is not tailored to the investment needs of any specific person and therefore does not involve a consideration of any of the investment objectives, financial situation or needs of any viewer that may receive it. Kindly also note that past performance is not a reliable indicator of future results. Actual results may differ materially from those anticipated in forward-looking or past performance statements. We assume no liability as to the accuracy or completeness of any of the information and/or content provided herein and the Company cannot be held responsible for any omission, mistake nor for any loss or damage including without limitation to any loss of profit which may arise from reliance on any information supplied by Everest Fortune Group.
Bullish bounce off?NZD/CAD is falling towards the support level that aligns with the 61.8% Fibonacci retracement and could bounce from this level to our take profit.
Entry: 0.80937
Why we like it:
There is a pullback support that lines up with the 61.8% Fibonacci retracement.
Stop loss: 0.80659
Why we like it:
There is a swing low support.
Take profit: 0.81631
Why we like it:
There is a pullback resistance that lines up with the 78.6% Fibonacci retracement.
Enjoying your TradingView experience? Review us!
Please be advised that the information presented on TradingView is provided to Vantage (‘Vantage Global Limited’, ‘we’) by a third-party provider (‘Everest Fortune Group’). Please be reminded that you are solely responsible for the trading decisions on your account. There is a very high degree of risk involved in trading. Any information and/or content is intended entirely for research, educational and informational purposes only and does not constitute investment or consultation advice or investment strategy. The information is not tailored to the investment needs of any specific person and therefore does not involve a consideration of any of the investment objectives, financial situation or needs of any viewer that may receive it. Kindly also note that past performance is not a reliable indicator of future results. Actual results may differ materially from those anticipated in forward-looking or past performance statements. We assume no liability as to the accuracy or completeness of any of the information and/or content provided herein and the Company cannot be held responsible for any omission, mistake nor for any loss or damage including without limitation to any loss of profit which may arise from reliance on any information supplied by Everest Fortune Group.

BTC/USD Long SetupBTC/USD Long Setup
Price is showing signs of reversal after a consolidation near intraday support. A long position has been placed with a stop loss below recent structure and a target near resistance.
Entry: 114,556
Stop Loss: 114,266
Take Profit: 115,406
Risk-to-reward ratio is favorable, with potential upside if price holds above EMA 9. Watching for continuation momentum toward resistance.

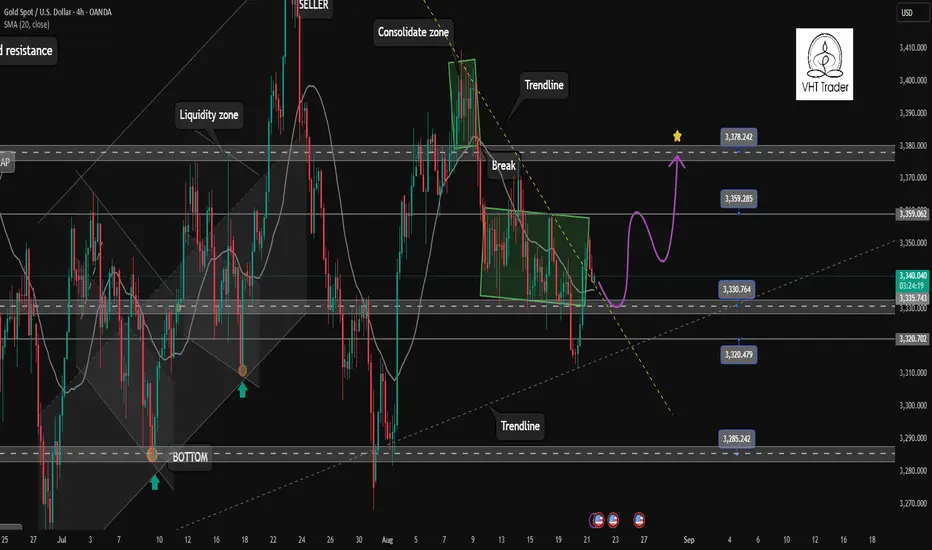
XAUUSD NEXT WEEK ? Greetings 👋
Thats My Gold View Next Week !
Recently Gold Pump At My QM Buy Setup And Now We Have Zones For Selling And Buying
Selling ZONE : 3390 / 3410 Buy Side Liquidity Zone When Its Take Liquidity Then It Will Drop
Buying ZONE : 3352 / 3349 CISD Another Buy Zone : 3338 / 3327 Buy Trendline + IFVG Setup
BEST OF LUCK 🤞

Gold sideways, unclear trend, needs more momentum✏️Gold has reacted at the Trendline and created another decline to Fibonacci 0.382. Buying power is still strong enough to pull H4 back above 3331. It is difficult to determine the next trend of Gold at the moment. Gold is sideways in a fairly narrow range and waiting for more momentum to confirm the trend. The areas of interest are still the Fibonacci zones that cross each hook to reach the next hook. Note that H4 closes below 3331 to confirm a bearish reversal to 3285.
📉 Key Levels
BUY trigger: Price breaks the trendline and Fibonacci at 3345.
BUY DCA: Breaks 3358 with candle confirmation
Target 3400
SELL trigger H4 closes below 3331
Target 3285
Leave your comments on the idea. I am happy to read your views.

Gold go back in wide trading range.What is the good trading plan✏️Gold broke the Trendline and returned to the wide trading range from 3330-3360. The accumulation range for many days will continue to be relied on by investors to execute entry points. The correction from the beginning of the Asian session today is aimed at the target of 3332, which is the convergence zone of the lower boundary and the 0.5 fibo retracement of yesterday's wave. In terms of wave structure, if it bounces from this area, it is very likely to create a new uptrend towards 3378. On the contrary, the closing of the H1 candle below 3332 will confirm the return of the Down wave and continue towards the target of 3385 in the shortest time.
📉 Key Levels
Buy trigger: retest 3332 with the reaction of the buyers
SELL trigger: Break and trading bellow 3332 ( Break bellow trendline)
SELL DCA trigger Break 3320 supports the convergence of the trendline and the old break zone
Support 3332-3320-3310-3300-3285
Resistance 3358-3378
Leave your comments on the idea. I am happy to read your views.
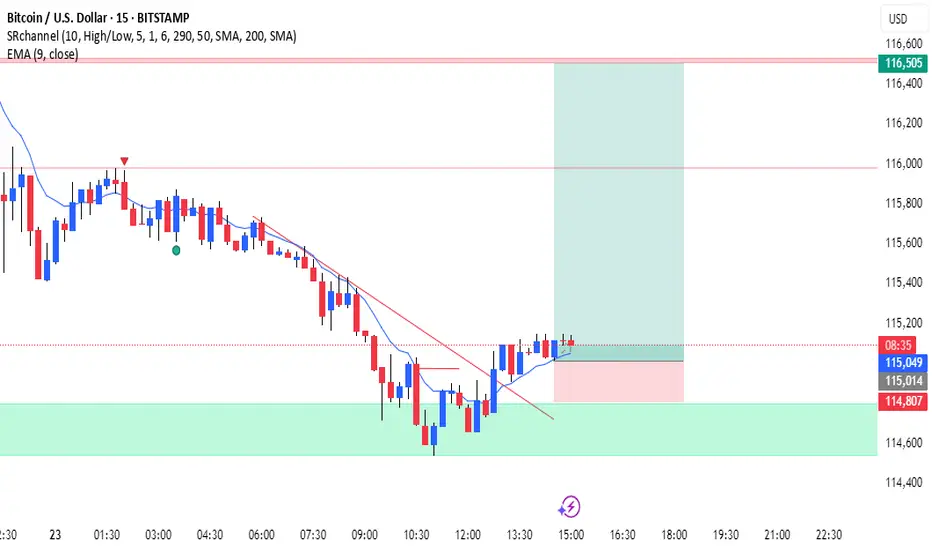
Bitcoin (BTC/USD) – 15m Chart Analysis & Signal📊 Bitcoin (BTC/USD) – 15m Chart Analysis
🔹 1. Trend & Price Action
Previous downtrend with lower highs and lower lows.
Price found support around 114,600–114,800 (green demand zone).
Bullish breakout above descending trendline → early sign of reversal.
Formation of higher lows after bounce → shift in momentum.
🔹 2. EMA (9) Signal
Price is currently above EMA 9.
EMA is curving upward, signaling short-term bullish momentum.
As long as candles stay above EMA, buyers are in control.
🔹 3. Trade Setup
✅ Bullish (Long) Signal
Entry Zone: 115,050 – 115,150
Stop-Loss: 114,800 (below support)
Take-Profit: 116,500 (previous resistance)
Risk-Reward Ratio: ~1:4
🔹 4. Risk / Invalidation
If price closes back below EMA 9 and 114,800, bullish setup is invalid.
In that case, expect continuation toward 114,400 or lower.
📌 Summary
BTC is showing a bullish reversal signal on the 15m chart.
Support held at 114,600–114,800.
Price broke the trendline and trades above EMA 9.
As long as it stays above 114,800, upside toward 116,500 is favored.
AUDJPY; Heikin Ashi Trade Idea📈 Hey Traders!
Here’s a fresh outlook from my trading desk. If you’ve been following me for a while, you already know my approach:
🧩 I trade Supply & Demand zones using Heikin Ashi chart on the 4H timeframe.
🧠 I keep it mechanical and clean — no messy charts, no guessing games.
❌ No trendlines, no fixed sessions, no patterns, no indicator overload.
❌ No overanalyzing market structure or imbalances.
❌ No scalping, and no need to be glued to the screen.
✅ I trade exclusively with limit orders, so it’s more of a set-and-forget style.
✅ This means more freedom, less screen time, and a focus on quality setups.
✅ Just a simplified, structured plan and a calm mindset.
💬 Let’s Talk:
💡Do you trade supply & demand too ?
💡What’s your go-to timeframe ?
💡Ever tried Heikin Ashi ?
📩 Got questions about my strategy or setup? Drop them below — ask me anything, I’m here to share.
Let’s grow together and keep it simple. 👊

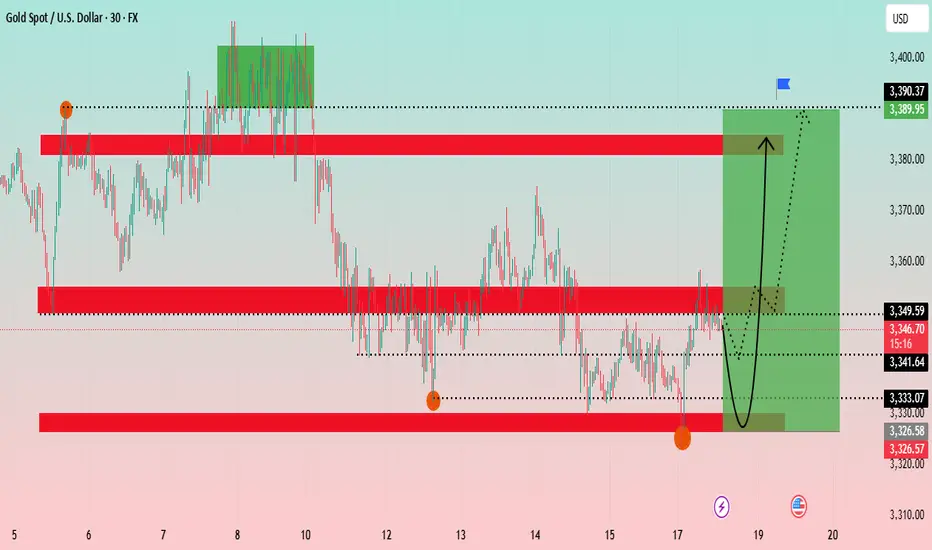
Gold and Bitcoin Technical Analysis: Navigating Key Support ?The Gold chart shows a 30-minute timeframe analysis, highlighting recent price consolidation and potential future trends. The analysis suggests a potential V-shape recovery for gold.
Key Levels: The price is currently at a critical juncture, having tested a support zone around 3,326 - 3,333 USD. This zone has proven to be a strong base. Above it, a significant resistance zone is identified between 3,349 - 3,353 USD. Further up, another major resistance is at approximately 3,389 USD.
Price Action: The price has recently experienced a sharp decline and is now in a consolidation phase. The chart projects a potential bounce from the current levels, indicated by the black curved arrow, with the target being the upper resistance zone around 3,389 USD. The green shaded box illustrates the potential upward movement from the current position.
Conclusion: Gold appears to be at a key support level and could be poised for a rally if it successfully breaks above the immediate resistance zone.
Bitcoin (BTC/USDT) 4-Hour Chart Analysis
The Bitcoin chart shows a 4-hour timeframe analysis, focusing on a short-term uptrend channel.
Key Levels: The price is trading within an ascending channel. A significant support zone is identified between 112,000 - 114,000 USDT. A "weak supply zone" is marked around 118,000 USDT, which is currently acting as support. A major resistance is at approximately 124,564 USDT.
Price Action: After a strong push towards the channel's upper boundary, the price has pulled back and is now retesting the "weak supply zone." The blue and red arrows project two possible scenarios: a bounce back up towards the channel's high, or a deeper retracement towards the channel's lower trendline. The price movement appears to be following the blue projected path.
Indicators: The Ichimoku cloud and RSI strategy are used to confirm the trend and identify entry/exit points. The price is above the Ichimoku cloud, indicating a bullish trend.
Conclusion: Bitcoin is at a pivotal point within its uptrend channel. Its ability to hold the 118,000 USDT level will be crucial for a potential re-test of the 124,564 USDT resistance.
USDJPY: The Market Will Recover 🇺🇸🇯🇵
There is a high chance that USDJPY will grow on Monday,
following a formation of a huge Fair Value Gap FVG
after a Powell speech on Friday.
A trap that is followed by a bullish imbalance indicate
a highly probably bullish movement at least to 147.25 resistance.
❤️Please, support my work with like, thank you!❤️
I am part of Trade Nation's Influencer program and receive a monthly fee for using their TradingView charts in my analysis.

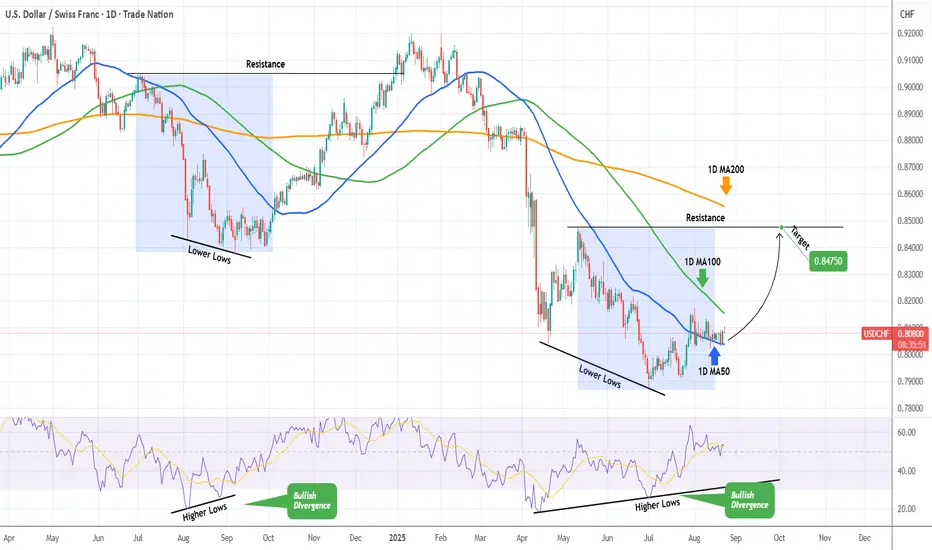
USDCHF Strong buy signal on a 2024 fractal.Last time we looked at the USDCHF pair (June 19, see chart below), we took the most optimal sell at the top of the Channel Down, which easily hit the 0.80565 Target:
This time we are getting a strong buy signal as not only is the price supported on the 1D MA50 (blue trend-line) in what seems like a Bull Flag, but also the 1D RSI is on a huge Bullish Divergence (Higher Lows against the price's Lower Lows), similar to he August 2024 pattern.
That sequence rose all the way to the upper Resistance (even broke it), so we do expect the pair to resume the rally and Target 0.84750. That might also be just in time to test the 1D MA200 (orange trend-line) for the first time since April 03.
-------------------------------------------------------------------------------
** Please LIKE 👍, FOLLOW ✅, SHARE 🙌 and COMMENT ✍ if you enjoy this idea! Also share your ideas and charts in the comments section below! This is best way to keep it relevant, support us, keep the content here free and allow the idea to reach as many people as possible. **
-------------------------------------------------------------------------------
Disclosure: I am part of Trade Nation's Influencer program and receive a monthly fee for using their TradingView charts in my analysis.
💸💸💸💸💸💸
👇 👇 👇 👇 👇 👇
EURUSD Short Setup - Pending Order💎MJTrading
Single Chart Overview:
FX:EURUSD
| Short Bias
📝 Trade Logic and Setup:
Bearish momentum is accelerating with strong downside pressure. Price has rejected the previous low, turning it into resistance. This breakdown setup seeks continuation into deeper liquidity zones, with tight risk management above the invalidation point (above the CLOSE).
🟢 Entry Zone: Pending Order: Sell Stop @ 1.15930
❌ Stop Loss (SL): 1.16643 (channel breakout invalidation)
🎯 Take Profit (TP) Levels
✅ TP1 → 1.15800
📈 TP2 → 1.15666
💰 TP3 - RR4→ 1.17407
Important Note: This order is time sensitive and has a time limit...If the price moves upward, position won't be activated...
Manage Your Risk Wisely...
#EURUSD #PriceAction #TechnicalAnalysis #Trading #MJTrading
Psychology Always Matters:

XAU/USD Price Action Zones & Trade Setup (Aug 20, 2025)Analysis:
The market recently made a CHoCH (Change of Character), signaling a possible bearish structure.
First Selling Zone (3340 – 3350): Strong resistance area where sellers may push price down.
Second Selling Zone (3350 – 3360): A deeper liquidity grab area for confirmation shorts.
First Buying Area (3308 – 3320): Demand zone where buyers might step in for a short-term bounce.
Second Buying Area (3270 – 3280): Stronger demand, ideal for swing buy opportunities if price dips further.
Price is currently around 3323, hovering near equilibrium, likely to retest selling zones before dropping to buying areas.
📈 Trade Plan:
Sell Entries
🔹 First Short: Around 3340 – 3350 (First Selling Zone).
🔹 Second Short (confirmation): Around 3350 – 3360 (Second Selling Zone).
🎯 Targets:
TP1: 3320 (First Buying Area)
TP2: 3280 (Second Buying Area)
🛑 Stop Loss: Above 3365
Buy Entries
🔹 First Buy: Around 3310 – 3320 (First Buying Area) for a small bounce.
🔹 Second Buy (stronger): Around 3270 – 3280 (Second Buying Area).
🎯 Targets:
TP1: 3340 (back to resistance)
TP2: 3355 (liquidity above first selling zone)
🛑 Stop Loss: Below 3260

Bullish bounce?The Gold (XAU/USD) is falling towards the pivot and could bounce to the 1st resistance, which acts as a pullback resistance.
Pivot: 3,307.62
1st Support: 3,267.80
1st Resistance: 3,350.96
Risk Warning:
Trading Forex and CFDs carries a high level of risk to your capital and you should only trade with money you can afford to lose. Trading Forex and CFDs may not be suitable for all investors, so please ensure that you fully understand the risks involved and seek independent advice if necessary.
Disclaimer:
The above opinions given constitute general market commentary, and do not constitute the opinion or advice of IC Markets or any form of personal or investment advice.
Any opinions, news, research, analyses, prices, other information, or links to third-party sites contained on this website are provided on an "as-is" basis, are intended only to be informative, is not an advice nor a recommendation, nor research, or a record of our trading prices, or an offer of, or solicitation for a transaction in any financial instrument and thus should not be treated as such. The information provided does not involve any specific investment objectives, financial situation and needs of any specific person who may receive it. Please be aware, that past performance is not a reliable indicator of future performance and/or results. Past Performance or Forward-looking scenarios based upon the reasonable beliefs of the third-party provider are not a guarantee of future performance. Actual results may differ materially from those anticipated in forward-looking or past performance statements. IC Markets makes no representation or warranty and assumes no liability as to the accuracy or completeness of the information provided, nor any loss arising from any investment based on a recommendation, forecast or any information supplied by any third-party.
