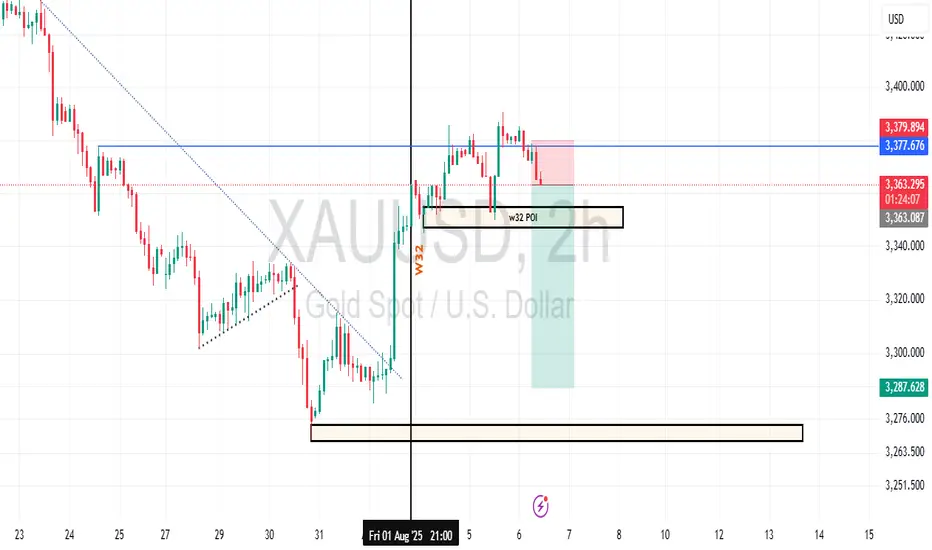
Gold Week 32 Possible reversalGold prices are in a clear downtrend, with critical support at $3,287.628 and resistance at $3,379.874. The 'W32 POI 2H' on Aug 1 highlighted a volatile 2-hour period with a sharp drop and recovery, signaling potential support strength. Fibonacci retracement levels could play a key role in identifying retracement targets. Stay disciplined with risk management as you navigate these levels.
Forexsignals
GBPUSD: Important Supply Zone Ahead 🇬🇧🇺🇸
There is a high probability that GBPUSD will drop
from the underlined supply zones based on a recently
broken daily support and a falling trend line.
Expect a down movement at least to 1.3024
❤️Please, support my work with like, thank you!❤️
I am part of Trade Nation's Influencer program and receive a monthly fee for using their TradingView charts in my analysis.

XAU/USD | Gold Rebounds Strongly After Hitting Key Demand Zone!By analyzing the #Gold chart on the 4-hour timeframe, we can see that after reaching $4105, the price dropped again and made a sharp move down into the $4026 demand zone I mentioned in the previous analysis. As soon as gold touched this zone, strong buying pressure kicked in, pushing the price back up to around $4080.
The next short-term supply zones to watch are $4090, $4100, and $4109.
The medium-term supply zones are $4150, $4172, and $4193.
Keep an eye on gold’s reaction in these areas, they can trigger new pullbacks or confirm further upside movement.
Please support me with your likes and comments to motivate me to share more analysis with you and share your opinion about the possible trend of this chart with me !
Best Regards , Arman Shaban

BTC Next moveBTC gave a choch and bos / Trend line break conformation
market came without taking a supply from trend change area and there we can see FVG
so trend have to collect that FVG for continue sell trend
or break there structure for uptrend
📌 Please support me with your likes 🤞🏻 and comments 💬 to motivate me to share more analysis with you and share your any opinion about the possible trend of this chart with me !
Best Regards , Davis 🥰
Hit the like 🤞🏻 button to !! Motive some energy !!🥇
📌 Note :
⨻ Check the live market updates and analysis yourself before buy 📈🔺 or sell 📉🔻
⨺ Am not giving any advisory or signals its just my idea for upgrade my knowledge 📚 in trading
⨹ This is my pre and post market analysis to improve my trading journey 🚀
⨂ Am Not suggesting anyone to buy or sell ❌ am just giving my views 👀
⫸ You are responsible for your trading ✅ not me ❌ ⫷
HAPPY TRADING 🥰
Nov 21, 2025
Trade closed: target reached
bitcoin reach as expected on supply area around5000$ upside and down side gave target
HAPPY TRADING 🥰

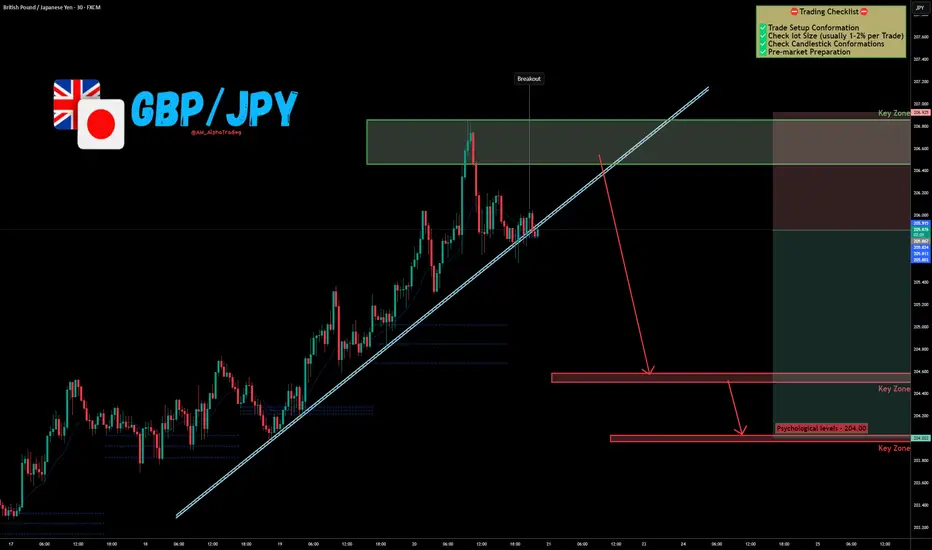
GBP/JPY Rejection at Supply → Next Stop: 204.00 !The GBP/JPY Pair, Price has been trading within a Trendline Breakout on the M30 chart, forming consistent lower highs and lower lows. Price action is now testing the lower boundary of the pattern, signalling a possible breakdown.
✅Market Context:
1️⃣Downward structure building inside the pattern.
2️⃣Sellers are showing strength near support levels.
3️⃣Breakdown below the trendline indicates momentum continuation toward lower zones.
✅Trade Plan :
Entry: Sell after confirmed breakdown below the support (Candle close below trendline or retest of the breakout).
💰Take Profit (TP): At the Key Zone – major support area identified ahead.
🛑Stop Loss (SL): Above the pattern structure / recent swing high.
✅Psychological Discipline:
1️⃣Stick to plan – No Revenge Trades.
2️⃣Accept losing trades as part of the strategy.
3️⃣Risk only 1–2% of your account balance per trade.
✅ Support this analysis with a
LIKE 👍 | COMMENT 💬 | FOLLOW 🔔
It helps a lot & keeps the ideas coming!
⚠️ Disclaimer: This analysis is for educational purposes only and does not constitute financial advice. Forex trading involves high risk. Trade only with capital you can afford to lose and always do your own research.
GBPJPY rejected at the top of its 6-month Channel Up.The GBPJPY pair has been trading within a 6-month Channel Up and yesterday got rejected exactly on its top, making a Higher High. That completed a +3.92% rise, similar to all previous Bullish Legs of this pattern.
As a result, we technically view yesterday's rejection as the start of the new Bearish Leg. All previous corrections hit at least the 1D MA50 (blue trend-line) and we expect that to happen at 202.400 at least.
As for the most optimal buy, that will be on the 1D MA100 (green trend-line), which marked all previous four bottoms (Higher Lows) and initiated the Bullish Legs. The 1D RSI testing its Support Zone, is an additional buy indicator. We expect the next Bullish Leg to reach at least 208.250 (+3.92%).
---
** Please LIKE 👍, FOLLOW ✅, SHARE 🙌 and COMMENT ✍ if you enjoy this idea! Also share your ideas and charts in the comments section below! This is best way to keep it relevant, support us, keep the content here free and allow the idea to reach as many people as possible. **
---
💸💸💸💸💸💸
👇 👇 👇 👇 👇 👇

EURUSD remains in a strong bearish structure on the 4H timeframePrice is clearly trading below all three Alligator lines, confirming a downside trend with no signs of exhaustion yet. RSI is sitting below 40, showing steady bearish momentum while still leaving room for continuation before reaching oversold conditions.
🔹 Key Technical Levels
Sell Zone (Pullback): 1.1550 – 1.1580
High-probability entry area where Alligator lines converge. Look for bearish rejection candles.
A clean 4H breakdown below this level confirms continuation.
🎯 Targets
TP1: 1.1470
TP2: 1.1384 (major swing-low support)
🛑 Stop-Loss
SL: 1.1620 to 1.1640 (above R2 / structure high)
📉 Why Bearish?
The alligator indicator shows a fully opened bearish formation (lips < teeth < jaws).
RSI below 40 confirms momentum on the downside.
Market structure continues to print lower highs and lower lows.
No bullish reversal signals present on 4H.
❌ Invalidation
A 4H close above 1.1650 cancels the bearish setup.

GBPNZD: Consolidation is Over 🇬🇧🇳🇿
Looks like GBPNZD finally completed a consolidation.
The price violated a resistance line of a symmetrical triangle
pattern with a high momentum bullish candle on a daily.
We can expect a move up now.
Goal - 2.3475
❤️Please, support my work with like, thank you!❤️
I am part of Trade Nation's Influencer program and receive a monthly fee for using their TradingView charts in my analysis.

XAU/USD: Gold Set to Test Downtrend Line!⏰ Timeframe: 30m
📅 Update: 11/21/2025
🔍 Market Context
After adjusting from the 4,107 USD area, gold is moving sideways in the liquidity rebalancing zone – indicating a tug-of-war between the two sides.
The consecutive CHoCH – BOS movements forming around the 4,006 USD bottom show that buying pressure is starting to reappear.
The current decline seems to be just a correction phase, not yet showing enough signs of a complete reversal of the medium-term uptrend structure.
📊 Technical Structure
Downtrend line: continues to act as dynamic resistance – a confirmation area for the recovery trend if broken.
OB Bullish (4,006 USD): confluence with the previous liquidity bottom, is a potential BUY Zone.
Break–Resistance (4,045 USD): the first level to surpass to confirm buying pressure.
OB Bearish (4,086–4,107 USD): short-term supply zone – short-term SELL Zone, may witness profit-taking reactions if the price touches it.
🎯 Market Outlook
1️⃣ Priority Scenario:
– Price may retest the OB Bullish / BUY Zone (4,006–4,025 USD).
– When a clear upward reaction appears, gold is likely to break through the downtrend line, heading towards OB Bearish (4,086–4,107 USD).
2️⃣ Alternative Scenario:
– If the price does not hold the 4,006 USD area, the short-term structure will be invalidated, opening the possibility of retreating to a lower equilibrium area around 3,985 USD.
💎 Key Zones
BUY Zone: 4,006 – 4,025 USD → demand zone confluence OB + liquidity bottom.
SELL Zone: 4,086 – 4,107 USD → potential supply zone if the recovery trend is activated.
🧠 Analyst’s View
Gold is in a short-term accumulation state with signs of capital flow gradually leaning towards the buyers.
The retest phase of the 4,006 USD support area will be the key confirmation for a reversal – retest – continuation phase.
As long as the price stays above this area, the priority remains a buy-the-dip scenario in the short term.
🛡️ Risk Note
The market is operating in a "break or hold" zone – clear confirmation is needed before following the trend.
Analysis is for technical and educational purposes, not trading advice.

USDCHF H4 | Potential Bullish Bounce OffMomentum: Bullish
The price has already bounced off the buy entry which is swing low support.
Buy entry: 0.7892
Swing low support
Stop loss: 0.7856
Swing low support
Take profit: 0.8007
Pullback resistance
50% Fibonacci retracement
High Risk Investment Warning
Stratos Markets Limited (tradu.com ), Stratos Europe Ltd (tradu.com ):
CFDs are complex instruments and come with a high risk of losing money rapidly due to leverage. 70% of retail investor accounts lose money when trading CFDs with this provider. You should consider whether you understand how CFDs work and whether you can afford to take the high risk of losing your money.
Stratos Global LLC (tradu.com ): Losses can exceed deposits.
Please be advised that the information presented on TradingView is provided to Tradu (‘Company’, ‘we’) by a third-party provider (‘TFA Global Pte Ltd’). Please be reminded that you are solely responsible for the trading decisions on your account. Any information and/or content is intended entirely for research, educational and informational purposes only and does not constitute investment or consultation advice or investment strategy. The information is not tailored to the investment needs of any specific person and therefore does not involve a consideration of any of the investment objectives, financial situation or needs of any viewer that may receive it. Past performance is not a reliable indicator of future results. Actual results may differ materially from those anticipated in forward-looking or past performance statements. We assume no liability as to the accuracy or completeness of any of the information and/or content provided herein and the Company cannot be held responsible for any omission, mistake nor for any loss or damage including without limitation to any loss of profit which may arise from reliance on any information supplied by TFA Global Pte Ltd.

EURUSD H4 | Bearish Drop OffMomentum: Bearish
Price has rejected the sell entry zone, confirming it as pullback resistance.
Sell Entry: 1.1603
Pullback resistance
Stop Loss: 1.1651
Swing-high resistance
Take Profit: 1.1539
Pullback support
61.8% Fibonacci retracement
High Risk Investment Warning
Stratos Markets Limited (tradu.com ), Stratos Europe Ltd (tradu.com ):
CFDs are complex instruments and come with a high risk of losing money rapidly due to leverage. 70% of retail investor accounts lose money when trading CFDs with this provider. You should consider whether you understand how CFDs work and whether you can afford to take the high risk of losing your money.
Stratos Global LLC (tradu.com ): Losses can exceed deposits.
Please be advised that the information presented on TradingView is provided to Tradu (‘Company’, ‘we’) by a third-party provider (‘TFA Global Pte Ltd’). Please be reminded that you are solely responsible for the trading decisions on your account. Any information and/or content is intended entirely for research, educational and informational purposes only and does not constitute investment or consultation advice or investment strategy. The information is not tailored to the investment needs of any specific person and therefore does not involve a consideration of any of the investment objectives, financial situation or needs of any viewer that may receive it. Past performance is not a reliable indicator of future results. Actual results may differ materially from those anticipated in forward-looking or past performance statements. We assume no liability as to the accuracy or completeness of any of the information and/or content provided herein and the Company cannot be held responsible for any omission, mistake nor for any loss or damage including without limitation to any loss of profit which may arise from reliance on any information supplied by TFA Global Pte Ltd.

USDCHF H4 | Bearish Reversal Off Pullback ResistanceMomentum: Bearish
Price is pulling back toward the sell entry, which aligns with the 61.8% Fibonacci retracement.
Sell Entry: 0.8043
Pullback resistance
61.8% Fibonacci retracement
Stop Loss: 0.81127
Swing-high resistance
Take Profit: 0.7944
Pullback support
High Risk Investment Warning
Stratos Markets Limited (tradu.com ), Stratos Europe Ltd (tradu.com ):
CFDs are complex instruments and come with a high risk of losing money rapidly due to leverage. 70% of retail investor accounts lose money when trading CFDs with this provider. You should consider whether you understand how CFDs work and whether you can afford to take the high risk of losing your money.
Stratos Global LLC (tradu.com ): Losses can exceed deposits.
Please be advised that the information presented on TradingView is provided to Tradu (‘Company’, ‘we’) by a third-party provider (‘TFA Global Pte Ltd’). Please be reminded that you are solely responsible for the trading decisions on your account. Any information and/or content is intended entirely for research, educational and informational purposes only and does not constitute investment or consultation advice or investment strategy. The information is not tailored to the investment needs of any specific person and therefore does not involve a consideration of any of the investment objectives, financial situation or needs of any viewer that may receive it. Past performance is not a reliable indicator of future results. Actual results may differ materially from those anticipated in forward-looking or past performance statements. We assume no liability as to the accuracy or completeness of any of the information and/or content provided herein and the Company cannot be held responsible for any omission, mistake nor for any loss or damage including without limitation to any loss of profit which may arise from reliance on any information supplied by TFA Global Pte Ltd.

AUDUSD H4 | Bearish Reversal Off Key ResistanceMomentum: Bearish
Price has rejected the sell entry zone, which aligns with the 38.2% Fibonacci retracement, and is also trading below the Ichimoku cloud, reinforcing bearish pressure.
Sell Entry: 0.6513
Strong overlap resistance
38.2% Fibonacci retracement
Stop Loss: 0.6539
Pullback resistance
61.8% Fibonacci retracement
Take Profit: 0.6447
Multi swing-low support
61.8% Fibonacci projection
High Risk Investment Warning
Stratos Markets Limited (tradu.com ), Stratos Europe Ltd (tradu.com ):
CFDs are complex instruments and come with a high risk of losing money rapidly due to leverage. 70% of retail investor accounts lose money when trading CFDs with this provider. You should consider whether you understand how CFDs work and whether you can afford to take the high risk of losing your money.
Stratos Global LLC (tradu.com ): Losses can exceed deposits.
Please be advised that the information presented on TradingView is provided to Tradu (‘Company’, ‘we’) by a third-party provider (‘TFA Global Pte Ltd’). Please be reminded that you are solely responsible for the trading decisions on your account. Any information and/or content is intended entirely for research, educational and informational purposes only and does not constitute investment or consultation advice or investment strategy. The information is not tailored to the investment needs of any specific person and therefore does not involve a consideration of any of the investment objectives, financial situation or needs of any viewer that may receive it. Past performance is not a reliable indicator of future results. Actual results may differ materially from those anticipated in forward-looking or past performance statements. We assume no liability as to the accuracy or completeness of any of the information and/or content provided herein and the Company cannot be held responsible for any omission, mistake nor for any loss or damage including without limitation to any loss of profit which may arise from reliance on any information supplied by TFA Global Pte Ltd.

NZDUSD H4 | Bearish Continuation SetupMomentum: Bearish
Price is rejecting the sell entry and remains below the Ichimoku Cloud, confirming downside pressure.
Sell entry: 0.5647
Pullback rresistance
Stop loss: 0.5689
Pullback resistance
Take profit: 0.5584
Pullback support
127.2% Fibonacci extension
High Risk Investment Warning
Stratos Markets Limited (tradu.com ), Stratos Europe Ltd (tradu.com ):
CFDs are complex instruments and come with a high risk of losing money rapidly due to leverage. 70% of retail investor accounts lose money when trading CFDs with this provider. You should consider whether you understand how CFDs work and whether you can afford to take the high risk of losing your money.
Stratos Global LLC (tradu.com ): Losses can exceed deposits.
Please be advised that the information presented on TradingView is provided to Tradu (‘Company’, ‘we’) by a third-party provider (‘TFA Global Pte Ltd’). Please be reminded that you are solely responsible for the trading decisions on your account. Any information and/or content is intended entirely for research, educational and informational purposes only and does not constitute investment or consultation advice or investment strategy. The information is not tailored to the investment needs of any specific person and therefore does not involve a consideration of any of the investment objectives, financial situation or needs of any viewer that may receive it. Past performance is not a reliable indicator of future results. Actual results may differ materially from those anticipated in forward-looking or past performance statements. We assume no liability as to the accuracy or completeness of any of the information and/or content provided herein and the Company cannot be held responsible for any omission, mistake nor for any loss or damage including without limitation to any loss of profit which may arise from reliance on any information supplied by TFA Global Pte Ltd.

AUSSIE H4 | Heading Into 61.8% Fibonacci ResistanceMomentum: Bearish
The price is rising towards the sell entry which aligns with the 61.8% Fibonacci retracement and al;so trading below the ichimoku cloud.
Sell entry: 0.6451
Pullback resistance
61.8% FIbonacci retracement
Stop loss: 0.6516
Overlap resistance
Slighlty above the 50% Fibonacci retracement
Take profit: 0.6389
Swing low support
161.8% FIbonacci extension
High Risk Investment Warning
Stratos Markets Limited (tradu.com ), Stratos Europe Ltd (tradu.com ):
CFDs are complex instruments and come with a high risk of losing money rapidly due to leverage. 70% of retail investor accounts lose money when trading CFDs with this provider. You should consider whether you understand how CFDs work and whether you can afford to take the high risk of losing your money.
Stratos Global LLC (tradu.com ): Losses can exceed deposits.
Please be advised that the information presented on TradingView is provided to Tradu (‘Company’, ‘we’) by a third-party provider (‘TFA Global Pte Ltd’). Please be reminded that you are solely responsible for the trading decisions on your account. Any information and/or content is intended entirely for research, educational and informational purposes only and does not constitute investment or consultation advice or investment strategy. The information is not tailored to the investment needs of any specific person and therefore does not involve a consideration of any of the investment objectives, financial situation or needs of any viewer that may receive it. Past performance is not a reliable indicator of future results. Actual results may differ materially from those anticipated in forward-looking or past performance statements. We assume no liability as to the accuracy or completeness of any of the information and/or content provided herein and the Company cannot be held responsible for any omission, mistake nor for any loss or damage including without limitation to any loss of profit which may arise from reliance on any information supplied by TFA Global Pte Ltd.

XAU/USD: Gold's Final Correction Before a Strong Rebound📊 Market Structure – Elliott Wave + SMC
Gold has completed impulse wave 1–5 at the peak of 4,207 USD and is entering an Elliott correction phase in the form of ABC .
Wave A : bottomed at Demand Zone 4,008 – 4,020 USD
Wave B : retraced upwards, creating consecutive Equal Highs and small BoS but has not broken the larger structure
Wave C : is forming, may extend down to the Demand Zone if the price loses 4,030
SMC signals reinforce the scenario of a completed correction:
A series of Equal Lows → the market still has liquidity below to "sweep" towards the Demand Zone
The area BoS – 4,076 is the decisive structure: if not broken upwards, the correction trend continues
The area FVG + Resistance 4,152 USD is the target for a major retracement wave after completing wave C
=> In summary: the market is in the final phase of correction. Once wave C is completed, gold is likely to rebound strongly in the larger trend.
💎 Key Technical Zones
🔹 Demand Zone – Main BUY area
4,008 – 4,020 USD
→ Strong Demand confluence + Elliott wave C + liquidity below.
→ High probability of reversal.
🔹 Reaction Zone – Temporary reaction area
4,030 – 4,040 USD
→ If the price retraces early but hasn't swept the bottom → the correction may still continue.
🔹 Supply & FVG Zones (Strong resistance)
4,152 – 4,207 USD
→ Main target of the retracement wave after the ABC pattern is completed.
🎯 Trading Plan – Vincent’s Execution Map
1️⃣ BUY Setup – According to Wave C (top priority)
Wait for the price to complete wave C at the Demand Zone:
Entry: 4,012 – 4,020
SL: below 3,984
TP1: 4,076
TP2: 4,128
TP3: 4,152
TP4: 4,207
→ This is the main setup of the day, confluence of both SMC + Elliott.
2️⃣ BUY Aggressive – Early buy according to Break of Structure
If the price breaks BoS 4,076 before reaching Demand:
Entry: 4,070 – 4,076
SL: 4,040
TP: 4,128 – 4,152 – 4,207
→ Setup for those who want to catch the impulsive wave early.
3️⃣ SELL Scalp – Small trend (not the main trade)
Only enter when the price retraces to Fibo:
Entry: 4,092 – 4,106
SL: 4,116
TP: 4,040 → 4,020
→ Short-term scalp, aiming to complete wave C.
🧠 Vincent’s View
The overall trend still leans towards Bullish Reversal after correction.
As long as the price holds Demand Zone 4,008 – 4,020 , gold can rebound strongly back to the target of 4,152 – 4,207.
“Liquidity always shows the way – patience is the real advantage.” ⚜️
⏰ Timeframe: 1H
📅 Updated: 21/11/2025
✍️ Analyzed by: Captain Vincent

USDCHF H4 | Potential Bearish ReversalMomentum: Bullish
Price has rejected the sell entry level, which has been identified as a pullback resistance zone.
Sell Entry: 0.8068
Pullback resistance
Stop Loss: 0.8112
Swing-high resistance
Take Profit: 0.7981
Strong overlap support
50% Fibonacci retracement
High Risk Investment Warning
Stratos Markets Limited (tradu.com ), Stratos Europe Ltd (tradu.com ):
CFDs are complex instruments and come with a high risk of losing money rapidly due to leverage. 70% of retail investor accounts lose money when trading CFDs with this provider. You should consider whether you understand how CFDs work and whether you can afford to take the high risk of losing your money.
Stratos Global LLC (tradu.com ): Losses can exceed deposits.
Please be advised that the information presented on TradingView is provided to Tradu (‘Company’, ‘we’) by a third-party provider (‘TFA Global Pte Ltd’). Please be reminded that you are solely responsible for the trading decisions on your account. Any information and/or content is intended entirely for research, educational and informational purposes only and does not constitute investment or consultation advice or investment strategy. The information is not tailored to the investment needs of any specific person and therefore does not involve a consideration of any of the investment objectives, financial situation or needs of any viewer that may receive it. Past performance is not a reliable indicator of future results. Actual results may differ materially from those anticipated in forward-looking or past performance statements. We assume no liability as to the accuracy or completeness of any of the information and/or content provided herein and the Company cannot be held responsible for any omission, mistake nor for any loss or damage including without limitation to any loss of profit which may arise from reliance on any information supplied by TFA Global Pte Ltd.

XAUUSD GOLD ANALYSIS What’s Moving the Market Today? 21NovemberOANDA:XAUUSD GOLD ANALYSIS What’s Moving the Market Today? (November 21, 2025)
Welcome back to Trade with DECRYPTERS, where we turn complex charts into clean buy & sell zones.
Keep it simple let levels guide your decisions.
*📰 Market Overview*
Gold is consolidating after failing to extend above the intraday reaction zone, hovering near $4,070–4,080 as the Dollar Index holds firm around 99.0.
A steady dollar, fading rate-cut expectations and slow macro flows all limit immediate upside.
Volatility remains muted as markets wait for PMI data and fresh signals from the Fed.
Buyers continue defending dips, but sellers are active in the higher scalp zones.
*Key fundamentals driving today’s move:*
📈 DXY steady near 99.0 → caps bullish momentum
🏦 Fed pause confirmed; December cut odds drop to ~22%
🌍 Geopolitical risks + tariffs continue supporting safe-haven demand
🏛 Central bank demand strong: +634t YTD, up 28% YoY
📊 ETF flows: Q3 +222t inflows, but November shows light outflows as investors book profits
*📆 What’s Ahead Key Events to Watch*
🔸 PMI – Nov 21
Manufacturing expected ~49 & Services ~51.
Weak PMI = increased cut bets → gold bullish.
Strong PMI = DXY bounce → gold dips toward lower zones.
🔸 FOMC Meeting – Dec 16
Markets price a clear pause (78%) but a dovish surprise could unlock upside toward 4,150+.
Hawkish language may trigger a sweep into deeper demand (3,978–3,962).
🔸 Geopolitical Risk Premium
Tensions in US–China, Mideast and Eastern Europe continue to keep gold supported.
Any escalation = instant safe-haven spike; calmness = DXY strength → gold softens.
*🟩 GOLD TECHNICAL LEVELS*
Price continues to respect the mid-range structure with buyers defending the lower band and sellers reacting strongly at intraday supply.
After testing 4032–4049 demand, gold pushed back toward 4070–4080, confirming buyers still active.
*🎯 EQUILIBRIUM (EQ): 4,065.00*
Hold above EQ = bullish intraday momentum toward 4,094 → 4,105 → 4,123
Stay below EQ = re-test lower supports 4,050 → 4,032 with possible deeper sweep later
*🟩 📌 SCALP BUY AREA: 4,032 – 4,050*
Strong demand zone lining up with CB/ETF accumulation areas.
Ideal for intraday dip-buys during low volatility windows.
First reaction zone for bullish setups, especially inside the astrology short window.
If this breaks cleanly, expect a fast move toward 3,978–3,962.
*🟥 📌 SCALP SELL AREA: 4,094 – 4,105*
Repeated rejection zone — sellers remain active here.
Perfect for fading rallies with tight stops above 4,110.
If volume breaks above it, momentum quickly shifts to 4,123+.
This zone forms the short-term ceiling of current consolidation.
*🔺 📌 BULLISH BREAKOUT LEVEL: 4,123+*
A confirmed breakout above this level flips structure bullish.
Targets extend toward 4,148 → 4,165.
Usually triggered by macro catalysts (PMI/FOMC/geo shocks).
Watch for fakeouts if volume is weak.
*🔻 📌 SMART MONEY BUY ORDERS: 3,962 – 3,978*
Deep liquidity pocket where institutions are loading positions.
Expect sharp V-shaped reversals if this zone is tapped.
Only comes into play on deeper corrections or heavy data surprises.
Reclaim above 4,000 from here = strong upward momentum.
*📌 CONCLUSION*
Gold remains locked in a tight range, respecting both demand and supply zones as the EQ at 4,065 continues to act as the true pivot for direction. Holding below it opens the path for a controlled dip into deeper demand, while any strong break above EQ can trigger a clean push toward 4,123+. With macro data and geopolitical risk still guiding sentiment, patience and level-to-level execution remain the winning edge. Stay focused, let price come to your zones.
Please support me with your likes & comments to motivate deeper daily analysis!
Share your charts and thoughts let’s grow together.
Best Regards,
M. MOIZ KHATTAK | Founder, TRADE WITH DECRYPTERS

Geopolitical Risks: US-China, Middle East, and Russia-Ukraine1. US–China Strategic Rivalry
The US–China geopolitical competition is the single most important strategic rivalry of the 21st century. It extends far beyond military issues and deeply penetrates technology, supply chains, trade policies, cyber security, and political influence.
A. Trade and Economic Decoupling
Since 2018, the US and China have been locked in a trade war that has evolved into a broader process of economic decoupling. The US seeks to reduce its dependency on China in areas such as:
Semiconductors
Critical minerals
Electric vehicle batteries
Pharmaceuticals and APIs
Artificial intelligence and telecommunications
Tariffs, sanctions, and export controls have disrupted global supply chains. Many companies are pursuing “China+1” strategies by shifting production to India, Vietnam, and Mexico. However, true decoupling remains complicated because China is deeply integrated into global manufacturing.
B. Technology War and the AI Race
Technology is at the core of the rivalry. The US is restricting China’s access to:
Advanced semiconductor equipment
AI chips
Quantum computing technologies
Meanwhile, China accelerates investment in self-sufficiency through initiatives like “Made in China 2025” and its national AI strategy. The global tech ecosystem is splitting into two competing blocs, affecting equipment standards, supply networks, and cybersecurity frameworks.
C. Taiwan and Military Tensions
Taiwan remains the most explosive flashpoint. China considers Taiwan a breakaway province and has intensified military activities around the island. The US supports Taiwan’s defense through arms sales and political backing. Any major escalation could disrupt:
Global semiconductor supply (TSMC)
East Asian shipping lanes
Global equity markets
Even minor incidents raise volatility across global markets.
D. Geopolitical Influence in Asia and the Global South
Both nations compete for influence:
The US strengthens alliances through Quad, AUKUS, NATO partners, and Indo-Pacific initiatives.
China expands influence via Belt and Road (BRI) investments, infrastructure financing, and strategic partnerships with Africa, the Middle East, and Latin America.
This rivalry affects voting patterns at the UN, trade agreements, and global governance systems.
Overall, the US–China rivalry increases strategic uncertainty, reshapes supply chains, and compels nations to navigate between two superpowers.
2. Middle East Geopolitical Risks
The Middle East remains a region of enduring conflict, energy dependency, and shifting alliances. Three major developments define current risks:
A. Israel–Palestine and Regional Escalations
The conflict between Israel and Palestinian groups has intensified after recent escalations. The risk lies in the potential regionalization of the conflict involving:
Hezbollah (Lebanon)
Iran
Syria
US interests in the region
Any escalation could disrupt vital energy corridors, oil shipments, and global market stability.
B. Iran–US Tensions and the Gulf
Iran’s nuclear ambitions and proxy networks in Iraq, Yemen, and Lebanon create persistent risk. The Strait of Hormuz—through which 20% of global oil passes—remains one of the most vulnerable chokepoints in the world. Threats to tanker traffic can cause immediate spikes in oil prices.
The US maintains its military presence to secure maritime routes, while Gulf states diversify politically and economically to reduce vulnerability.
C. Saudi Arabia’s Strategic Realignment
Under Vision 2030, Saudi Arabia is diversifying its economy and recalibrating its global alliances:
Improving ties with China
Balancing relations with the US
Leading OPEC+ production strategies
Mediating regional disputes
Saudi Arabia’s decisions on oil output influence global energy markets and inflation trends.
D. Fragmentation and New Alliances
The Middle East is witnessing a major geopolitical reconfiguration:
Abraham Accords brought some Arab countries closer to Israel.
Turkey is becoming more assertive in the Eastern Mediterranean.
China has brokered surprise diplomatic agreements (e.g., Saudi–Iran rapprochement).
These shifts illustrate rising multipolarity, reducing the dominance of Western diplomatic frameworks.
In short, the Middle East remains a source of energy risk, regional power struggles, and global market volatility.
3. Russia–Ukraine War
The Russia–Ukraine conflict is the largest military confrontation in Europe since World War II and has deep global consequences.
A. Energy Shock and Global Commodity Markets
The war triggered massive disruptions in:
Natural gas supply to Europe
Crude oil markets
Fertilizer exports
Grains (Ukraine and Russia are major wheat exporters)
Europe accelerated its shift toward renewables and alternative gas supplies, but global energy markets remain sensitive to military developments.
B. Sanctions and Financial Fragmentation
The US, EU, and allies have imposed comprehensive sanctions on Russia. This has:
Restricted Russia’s access to global banking networks
Frozen central bank assets
Limited technology and military imports
Forced Russia to redirect oil to China and India
Global finance has become more fragmented, accelerating the creation of alternative payment systems such as:
China’s CIPS
Russia’s SPFS
Local-currency trade agreements
This undermines the dominance of the US dollar over the long term.
C. Military Escalation and NATO Expansion
The conflict has reshaped European security:
Finland and Sweden joined NATO
Eastern Europe increased defense budgets
The US reinforced military presence in Europe
Russia has strengthened ties with China, Iran, and North Korea, forming an alternative geopolitical camp.
D. Long-Term Economic Impact
Ukraine’s infrastructure has suffered devastating damage, while Russia faces prolonged isolation. Global investors now factor geopolitical risk into investment decisions, especially in Europe.
The war also accelerates trends such as:
Defense industry investment boom
Energy transition
Rerouting of global commodity flows
The Russia–Ukraine war marks a major shift toward long-term confrontation between Russia and Western powers.
Conclusion
US–China rivalry, Middle East volatility, and the Russia–Ukraine conflict collectively define a new era of global uncertainty and multipolar competition. These conflicts disrupt supply chains, raise commodity prices, accelerate military spending, and reshape global alliances. The world is transitioning from unipolarity (US dominance) to a multipolar order where regional powers assert greater influence. Nations and businesses must navigate these risks carefully, as geopolitics will continue to drive market behavior, trade flows, and strategic decisions in the decade ahead.

Emerging Markets: India, Brazil, and Indonesia1. India: The Fastest-Growing Major Emerging Market
India stands out as one of the most dynamic emerging markets globally. With a population of over 1.4 billion and a young workforce, India provides a huge labor pool and consumer market. Its economic strengths lie in technology, manufacturing, services, and large-scale domestic consumption.
Key Growth Drivers
Demographic Dividend
India has one of the youngest populations in the world, with a median age of about 29. This creates a strong workforce and a large base of consumers driving retail, real estate, technology, and financial services.
Digital & Technological Leadership
India’s digital ecosystem is one of the world’s most advanced.
UPI revolutionized digital payments
Startup ecosystem is among the top 3 globally
IT and BPO services dominate global outsourcing
Manufacturing Push (Make in India)
The government is aggressively promoting domestic manufacturing with incentives for electronics, semiconductors, automobiles, renewable energy, and defense production.
Infrastructure Expansion
Massive investments in highways, airports, railways, ports, and metro networks aim to enhance long-term competitiveness.
Sectors with High Potential
Information Technology and AI
Renewable Energy (solar leadership)
Pharmaceuticals and biotechnology
Financial services and digital payments
Automotive and EV manufacturing
Challenges
Unemployment and uneven income distribution
Infrastructure gaps in rural areas
Regulatory complexities
Dependence on imported fuel
Despite these challenges, India’s growth trajectory is strong. It is expected to become the world’s third-largest economy by 2030, driven by structural reforms, rising consumption, and a booming tech sector.
2. Brazil: Latin America’s Largest Emerging Market
Brazil is the biggest economy in Latin America and a global supplier of commodities, agricultural products, minerals, and energy. Its enormous reserves of natural resources, expanding consumer class, and diversified sectors make it an influential emerging market.
Key Growth Drivers
Abundant Natural Resources
Brazil is a top global exporter of:
Soybeans
Coffee
Sugar
Beef
Iron ore
Oil (deep-water reserves)
Agricultural Powerhouse
Known as the “breadbasket of the world,” Brazil has fertile land, favorable climate, and advanced agribusiness technologies.
Agribusiness contributes significantly to GDP and exports, helping Brazil maintain trade surpluses.
Industrial Capacity
Brazil has strong manufacturing sectors in:
Automobiles
Aircraft (Embraer)
Chemicals
Steel
Textiles
Growing Middle Class
A large domestic consumer market supports retail, banking, and services growth.
Sectors with High Potential
Agriculture and food processing
Mining and metallurgy
Renewable energy (biofuel, hydroelectric)
Oil & gas exploration
Tourism and ecotourism
Challenges
Political instability and frequent policy changes
High public debt and inflationary pressures
Bureaucracy and governance issues
Income inequality and uneven development
Nonetheless, Brazil’s resource wealth and export-driven economy position it as a long-term growth engine for Latin America. Demand from China, the U.S., and Europe continues to shape its global trade profile.
3. Indonesia: Southeast Asia’s Rising Economic Power
Indonesia is the largest economy in Southeast Asia, with over 270 million people and a rapidly expanding middle class. Its strategic location, natural resources, and economic reforms make it a fast-growing emerging market.
Key Growth Drivers
Demographic Advantage
Similar to India, Indonesia has a young population, which fuels consumption, entrepreneurship, and labor supply.
Natural Resource Endowment
Indonesia is rich in:
Nickel (key for EV batteries)
Coal
Palm oil
Natural gas
Copper and gold
The government is encouraging downstream processing, such as nickel-based battery manufacturing, to move from raw material exporter to industrial producer.
Strategic Trade Location
Indonesia sits on major global shipping routes (e.g., the Strait of Malacca), giving it enormous trade potential and geo-economic importance.
Infrastructure Development
Indonesian government spending on ports, airports, roads, and industrial zones is improving connectivity and logistics.
Sectors with High Potential
EV battery and mineral processing
Palm oil and sustainable agriculture
Tourism (Bali, Lombok)
Manufacturing (textiles, electronics)
Digital economy (e-commerce boom)
Challenges
Dependence on commodity exports
Environmental concerns (deforestation & mining)
Bureaucracy and corruption issues
Vulnerability to global commodity prices
Still, Indonesia is on track to become a top 10 global economy by 2040, supported by industrialization, consumption, and its digital ecosystem.
Conclusion
India, Brazil, and Indonesia represent the next wave of global economic powerhouses. Their influence is rising due to strong demographics, natural resources, expanding markets, and reform-driven policies. While each country faces unique challenges—from political instability in Brazil to regulatory hurdles in India and environmental concerns in Indonesia—their long-term prospects remain robust.
As global supply chains shift, multinational companies diversify beyond China, and new technologies emerge, these markets will play a critical role in shaping world trade, investment, and economic growth in the coming decades.

XAU/USD: Gold Adjusts, Awaiting Fibo 4,092 Confirmation📊 Market Structure
Gold is moving in the ABC–D–E adjustment pattern after a strong decline from the peak. Current structure:
Wave (C) peaks at the 4,128 – 4,130 USD region and strong selling pressure appears.
The price then creates a temporary bottom (D) but does not touch the Demand Zone at 4,007 USD, indicating the BUY side still has strength.
Currently, the price is in a small upward adjustment phase to form wave (E).
Key points:
The major trend still leans towards an increase as long as the bottom at 4,007 USD is not broken.
The BUY side is looking for a complete structure to continue pushing up to the FVG region.
💎 Key Technical Zones
1. Fibo Retracement Zone — 4,092 USD
Confluence region of:
Fibo 0.5 – 0.618
Adjustment structure (small wave)
→ Suitable for light SELL scalp, according to candle reaction signals.
2. FVG Zone — 4,128 – 4,151 USD
This is a large FVG region, coinciding with the market's "loss cost."
If the price pushes up as expected in wave (E), this is the main SELL region of the day.
3. Supply Zone — 4,207 – 4,210 USD
Extremely strong region, if the price breaks the FVG, it will move to this region.
This is the extended target for the BUY side if the market rises strongly.
4. Demand Zone — 4,007 – 4,020 USD
The strongest liquidity bottom region of the session.
If the price breaks 4,092 and does not maintain structure, gold will retest this region before a major increase.
🎯 Trading Plan – According to the current chart
1️⃣ SELL Scalp – Main scenario
Wait for the price to retrace to the Fibo 4,092 USD region and observe the reaction:
Entry: 4,092
SL: 4,105
TP1: 4,075
TP2: 4,060
TP3: 4,030 (lower FVG)
→ This is a short-term scalp order, suitable for the current weak market.
2️⃣ SELL Setup – FVG Zone
If the price breaks 4,092 and runs up to FVG:
Entry: 4,126 – 4,151
SL: 4,160
TP1: 4,092
TP2: 4,060
TP3: 4,030
→ This is the best SELL region of the day.
3️⃣ BUY Setup – Demand Zone
Only activate if the market drops deeply:
Entry: 4,020 – 4,007
SL: 3,995
TP1: 4,060
TP2: 4,092
TP3: 4,128 – 4,151
→ Buy according to the major trend when the price reaches the liquidity bottom region.
🧠 Vincent’s View
The current market is in a controlled adjustment phase.
Priority:
✔ SELL scalp at 4,092
✔ Beautiful SELL at 4,126–4,151
✔ BUY only activates when reaching 4,020–4,007
The major trend is still waiting to complete the wave pattern to push up to the Supply Zone 4,207 USD.

GBPUSD H1 | Bullish Bounce In PlayMomentum: Bullish
The price has bounced off the buy entry, which is a pullback support.
Buy entry: 1.3063
Pullback support
Stop loss: 1.3043
Pullback support
Take profit: 1.3116
Strong overlap resistance
High Risk Investment Warning
Stratos Markets Limited (tradu.com ), Stratos Europe Ltd (tradu.com ):
CFDs are complex instruments and come with a high risk of losing money rapidly due to leverage. 70% of retail investor accounts lose money when trading CFDs with this provider. You should consider whether you understand how CFDs work and whether you can afford to take the high risk of losing your money.
Stratos Global LLC (tradu.com ): Losses can exceed deposits.
Please be advised that the information presented on TradingView is provided to Tradu (‘Company’, ‘we’) by a third-party provider (‘TFA Global Pte Ltd’). Please be reminded that you are solely responsible for the trading decisions on your account. Any information and/or content is intended entirely for research, educational and informational purposes only and does not constitute investment or consultation advice or investment strategy. The information is not tailored to the investment needs of any specific person and therefore does not involve a consideration of any of the investment objectives, financial situation or needs of any viewer that may receive it. Past performance is not a reliable indicator of future results. Actual results may differ materially from those anticipated in forward-looking or past performance statements. We assume no liability as to the accuracy or completeness of any of the information and/or content provided herein and the Company cannot be held responsible for any omission, mistake nor for any loss or damage including without limitation to any loss of profit which may arise from reliance on any information supplied by TFA Global Pte Ltd.

EURUSD M30 | Bullish Bounce OffMomentum: Bearish
The price has bounced off the buy entry, which aligns with the 50% Fibonacci retracement.
Buy entry: 1.1527
Pullback support
50% Fibonacci retracement
Stop loss: 1.1510
Pullback support
Take profit: 1.1564
Pullback resistance
Slightly above the 61.8% Fibonacci retracement
High Risk Investment Warning
Stratos Markets Limited (tradu.com ), Stratos Europe Ltd (tradu.com ):
CFDs are complex instruments and come with a high risk of losing money rapidly due to leverage. 70% of retail investor accounts lose money when trading CFDs with this provider. You should consider whether you understand how CFDs work and whether you can afford to take the high risk of losing your money.
Stratos Global LLC (tradu.com ): Losses can exceed deposits.
Please be advised that the information presented on TradingView is provided to Tradu (‘Company’, ‘we’) by a third-party provider (‘TFA Global Pte Ltd’). Please be reminded that you are solely responsible for the trading decisions on your account. Any information and/or content is intended entirely for research, educational and informational purposes only and does not constitute investment or consultation advice or investment strategy. The information is not tailored to the investment needs of any specific person and therefore does not involve a consideration of any of the investment objectives, financial situation or needs of any viewer that may receive it. Past performance is not a reliable indicator of future results. Actual results may differ materially from those anticipated in forward-looking or past performance statements. We assume no liability as to the accuracy or completeness of any of the information and/or content provided herein and the Company cannot be held responsible for any omission, mistake nor for any loss or damage including without limitation to any loss of profit which may arise from reliance on any information supplied by TFA Global Pte Ltd.
