Bitcoin (BTC/USD) 3-Hour Chart - August 2025: Price breaks resistance at $121,919, targeting $128,311 (TP2) with support at $112,856 (Snipe). Key levels include TP1 at $121,919 and SL/TP at $117,107."
Forextrading

What Is the Evening Star Candlestick Pattern?What Is the Evening Star Candlestick Pattern?
Candlestick patterns offer traders a way to read price action and spot potential changes in momentum. One notable pattern is the evening star, a three-candle formation that signals the start of a possible downtrend. This article breaks down what the evening star looks like, how it works, and how traders typically use it.
What Is the Evening Star Candlestick Pattern?
The evening star is a three-candle pattern that traders watch for after a strong upward move. It’s considered a bearish reversal pattern, signalling that bullish momentum is fading. The setup consists of three candles:
- The first candle is a large bullish candle—it shows a clear upward direction.
- The second is much smaller. This middle candle—the star—reflects hesitation. Buyers and sellers are more balanced, and the market’s pace slows.
- The third candle acts as confirmation. It’s a solid bearish candle that closes deep into the body of the first.
The middle candle also often gaps up from the first, especially in stocks or indices, but gaps aren’t essential. What matters is the sequence: strength, indecision, reversal. The further the final candle closes into the body of the first, the stronger the pattern is considered.
Evening stars can appear on any timeframe, but many traders look for them on the daily chart where the signals tend to be clearer. It’s not a pattern to act on blindly—but in the right context, such as after a sustained bullish trend, it’s a useful sign that buyers might be losing control.
The Psychology Behind the Evening Star
It may be always useful to frame the formations like the evening star candle pattern in the context of market psychology.
Here, the first bullish candle signals buyer confidence. They drive prices higher and the candle closes strongly. The next candle is smaller, suggesting that momentum is slowing. Buyers aren’t pushing as hard, and sellers start to step in.
When the third candle closes strongly bearish, it confirms that sentiment is changing. Sellers are now in control, and previous buying strength fades. This shift often happens at the end of an extended upward movement, where fewer buyers are willing to bid the price up and begin closing positions.
How Traders May Use the Evening Star Candlestick Formation
The evening star may be a useful part of a trader’s toolkit, especially when it lines up with other pieces of analysis.
Opening and Closing a Trade
The evening star pattern candlesticks become more meaningful when they appear around known areas of resistance or previous swing highs. If the market’s been edging closer to a clear level—like a horizontal resistance line, Fibonacci retracement, or trendline—and then an evening star forms, it can add weight to the idea that the rally is weakening. Some traders also watch for patterns forming near round numbers or psychological price points.
If traders notice an evening star pattern occurring at a resistance level, they typically look for confluence using another indicator. The RSI might signal a bearish divergence, the price may be piercing an upper Bollinger Band, or it could also be bouncing from a 200-period EMA. Volume can be another factor—rising volume on the third candle can signal more participation behind the selling.
Once a trader has confidence that a bearish reversal is likely underway, they often use the candles following the third candlestick as an entry trigger. A stop loss might be set above the middle candle’s high, while take-profit targets might be placed at an area where a bullish reversal might occur, like a support level. Some might simply trail a stop to take advantage of the strong downtrend or exit when an indicator/candlestick pattern signals that bearish momentum is fading.
Marking Potential Trend Shifts
Some traders use the evening star to flag potential trend exhaustion. While they may not act on the signal (e.g. they are bullish overall and not willing to take shorts yet), the presence of an evening star can suggest the uptrend is vulnerable. They may prepare to buy a pullback, partially close an existing long position, or start watching for further bearish signals.
Example Trades
In the example above, we see a slight rally in AUD/USD in a broader downtrend (off-screen). Price initially pierces the upper Bollinger Band, with slight rejections visible in the upper wicks. After a brief dip, the market retests highs and finds resistance. At this point, the pattern forms, with confirmation coming from relatively weak candles afterwards. Price then closes through the midline of the Bollinger Bands, providing full confirmation of a bearish reversal.
In this second example, we can see a failed evening star. Here, Amazon (AMZN) gaps up over two consecutive days. That leads the 50-period EMA to slope up and cross above its 200-period counterpart—a clear bullish signal.
In this context, it may be better to ignore the signal. The market continues to move higher in an uptrend with consecutive bullish gaps, confirmed by the EMA crossover, indicating a lower probability the pattern will work successfully. Like any pattern, the evening star is expected to be more reliable when contextual factors align, such as in the AUD/USD example.
Strengths and Limitations of the Evening Star
The evening star has its strengths and limitations. To rely on the evening star in trading, it’s worth being aware of both sides.
Strengths
- Clear visual structure: The three-candle formation is straightforward, especially on higher timeframes.
- Logical: The pattern reflects an evident change in momentum that shifts from buying to selling pressure.
- Useful in a wider toolkit: When combined with other forms of analysis (resistance levels, overbought signals, strong volume), it can help traders pinpoint potential turning points and offer an entry.
Limitations
- Requires confirmation: On its own, the pattern doesn’t confirm a downtrend. It’s a potential signal, but not a guarantee.
- Less reliable in choppy markets: In sideways or low-volume markets, evening stars usually produce false signals.
- Subject to interpretation: Candle size, wicks, and placement can vary, which means not every setup is clean or tradable.
The Bottom Line
The evening star pattern offers traders a structured way to identify potential turning points in the market. Its three-candle formation makes it popular among those seeking greater confirmation than single-candle patterns.
FAQ
What Does an Evening Star Candle Pattern Mean?
It’s a three-candle formation that appears at the end of a solid uptrend. An evening star in trading indicates a potential bearish reversal or a short-term downward movement depending on market conditions and the timeframe used.
Is the Evening Star Bullish or Bearish?
The evening star is considered a bearish pattern that shows buyer exhaustion. A third long bearish candle reflects a change in the market sentiment.
How Do an Evening Star and a Hanging Man Differ?
The evening star is a three-candle pattern showing a gradual change in momentum. The hanging man is a single-candle pattern, with a small body and long lower wick. Both are bearish reversal signals, but the hanging man typically requires greater confirmation.
How Do a Shooting Star and an Evening Star Differ?
The shooting star is a one-candle pattern with a long upper wick and a small body that signals rejection at higher prices. The evening star is a three-candle pattern. Both formations reflect a shift from bullish to bearish sentiment.
This article represents the opinion of the Companies operating under the FXOpen brand only. It is not to be construed as an offer, solicitation, or recommendation with respect to products and services provided by the Companies operating under the FXOpen brand, nor is it to be considered financial advice.
XAUUSD – Channel Breakdown & Order Block ReactionPrice has broken below the ascending channel 📈 after failing to hold higher highs. A strong bearish drop has pushed price toward the 15M Order Block (OB) 📦 around 3,335–3,345, which may act as a demand zone.
🔍 Scenarios:
1️⃣ Bullish Reversal 🐂 – Buyers defend the OB, pushing price back above 3,360 and possibly toward 3,380+.
2️⃣ Further Drop 🐻 – If the OB fails, sellers could target lower liquidity zones.
⚡ Volume spikes during the breakdown show strong selling pressure, but the OB zone remains the key battleground for the next move.

Short CADJPY and USDJPY, Swing Trade Trading Idea: Short CADJPY & USDJPY
Date: August 14, 2025
Strategy Type: Short-term bearish play on JPY crosses
📰 Key News Drivers
- Japan GDP Data (Q2 Preliminary):
- QoQ: 0.0% (flat growth)
- YoY: -0.2% (mild contraction)
- GDP Deflator YoY: 3.3% (strong inflation signal)
- USDJPY Technical Outlook:
- Current price: ~146.60
- Bearish momentum confirmed by moving averages
- Key support: 146.386
- Break below 146.500 could trigger further downside
- JPY Strength Factors:
- Modest improvement in Japan’s M2 Money Stock
- Lower-than-expected U.S. inflation data weakening USD
- Risk-off sentiment favoring safe-haven JPY
📊 Trade Rationale
| Pair | Bearish Catalyst | Technical Setup | Target Zone |
| USDJPY | Weak U.S. inflation + strong JPY deflator | Testing support at 146.386 | 146.00 or lower |
| CADJPY | CAD vulnerable to oil price volatility + JPY strength | Likely to follow USDJPY breakdown | 106.50–107.00 |
- JPY Strength Thesis: Despite flat GDP growth, the strong deflator suggests inflationary pressure, which may prompt the BoJ to maintain or tighten policy. This supports JPY appreciation.
- USD Weakness: Lower inflation expectations in the U.S. reduce the likelihood of further Fed hikes, weakening USD.
- CAD Vulnerability: CADJPY often correlates with risk sentiment and oil prices. With JPY gaining and global risk tone cautious, CADJPY is exposed.
📌 Execution Plan
- USDJPY:
- Entry: Short below 146.50
- Stop: 147.10
- Target: 146.00 / 145.50
- CADJPY:
- Entry: Short below 107.50
- Stop: 108.20
- Target: 106.50 / 106.00

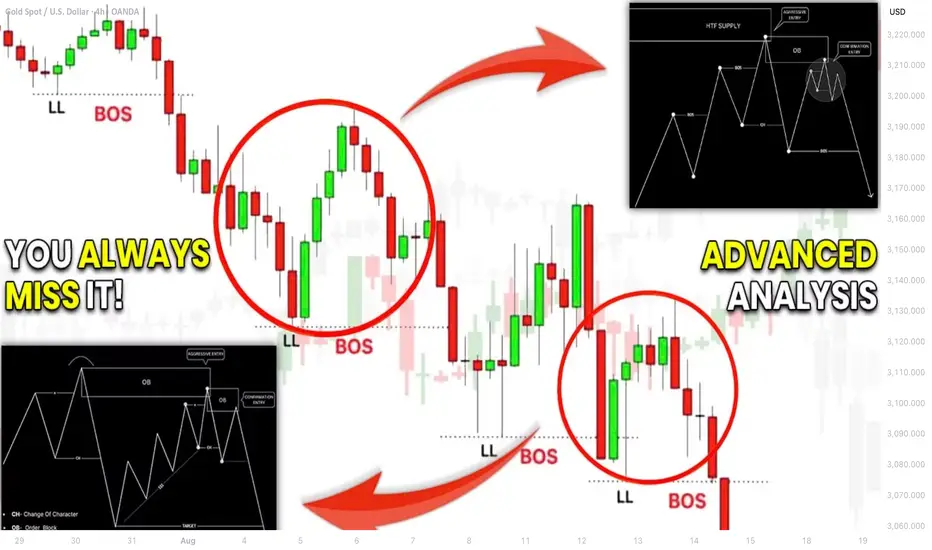
How to Do Structure Mapping with Multiple Time Frames Analysis
If you think that structure mapping is not efficient for profitable trading, you get it wrong .
What newbies traders always miss is that structure mapping works effectively only with multiple time frame analysis.
In this article, I will show you how you can build profitable trading plans and accurate predictions on forex market with structure mapping alone.
Learn top-down analysis secrets and how to map structure properly in Smart Money Concepts SMC ICT.
In order to effectively use structure mapping for scalping, day trading and swing trading , always start it from higher time frames.
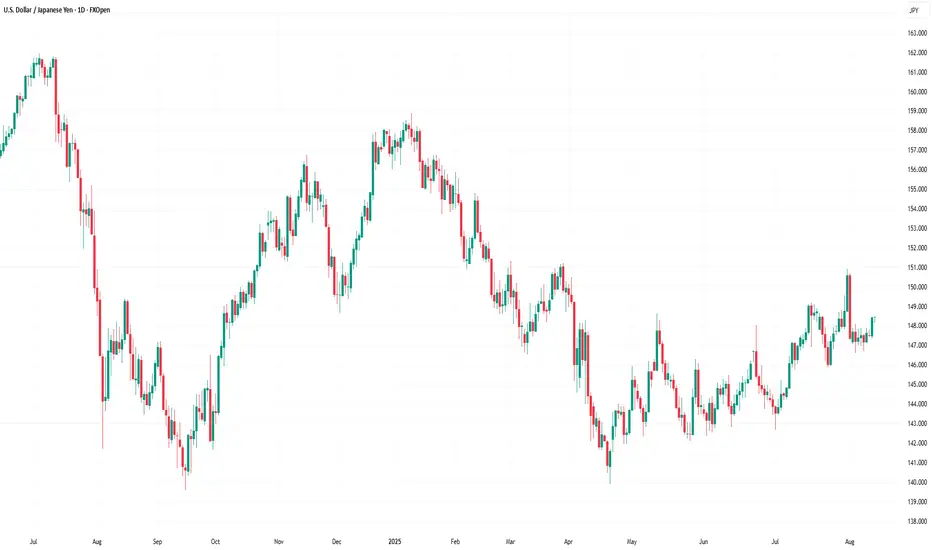
Examine my complete structure mapping on USDJPY forex pair on a daily time frame.
You can see that first, the pair was trading in a strong bearish trend.
Then, we had a confirmed bullish reversal with Change of Character.
After that, the market started an extended consolidating movement, not being able to update the highs.
And finally, the last bullish wave managed to update a high , confirming a completion of a consolidation and a resumption of a bullish trend.
Structure mapping reveals that USDJPY is now bullish on a daily and the last bearish movement is a correction in uptrend.
We can expect a start of a new bullish wave soon.
To understand when exactly it is going to happen, you will need to dive your analysis deeper .
You should start structure mapping on lower time frames.
And you should execute a price action analysis there in relation to your structure mapping on a higher time frame.
4H time frame structure mapping will reveal a price action within the last bearish move that we spotted on a daily.
We see that the market is trading in a bearish trend and the price started a local correctional movement after a formation of the last low.
4h time frame structure mapping provided a detailed intra week perspective.
Hourly time frame analysis, we reveal hidden intraday trends that will unveil more insights.
And why are we doing all that?
Remember that big waves always start from minor reversals.
The earlier you are able to find strong confirmations, the earlier you will open a trading position and the more profits you will make.
On an hourly time frame, our structure mapping shows that the market is already bullish. A bearish trend that USDJPY followed is already violated, and the price is updating the highs.
Following our analysis, the only thing that we need to confirm a start of a bullish trend is a confirmed trend reversal and a change of character on a 4H time frame.
It will validate an intra week bullish trend.
We will need the price to break the underlined blue resistance based on the last lower high in a bearish trend.
That will provide an accurate signal for us to buy.
And we can anticipate a rise a least to a current daily higher high then.
When you do structure mapping on forex market, never forget to do that on multiple time frames. Multiple perspectives and short-term/mid-term/long-term projections will help you to build a more efficient trading plan.
Remember that you can expand your structure mapping even for minute time frames. It will provide a unique perspective for scalping forex.
❤️Please, support my work with like, thank you!❤️
EURJPY: Important Breakout 🇪🇺🇯🇵
EURJPY successfully violated a significant daily resistance cluster.
With a high probability, it turned into a strong support now.
We can expect a bullish continuation from that.
Next resistance - 173.5
❤️Please, support my work with like, thank you!❤️
I am part of Trade Nation's Influencer program and receive a monthly fee for using their TradingView charts in my analysis.

GBPNZD: We could see a rejection at resistance once moreGBPNZD is range bound currently, and this latest moves continues the narrative of it. Right now, it's approaching a major resistance, where each touch here has showed good rejection.
My target would be toward 2.25230, an achievable target.
Though a scenario for more upside is possible and can happen just as much. But, I would take the side for more downside in this particular case.
Let me know in the comments what you think:
Disclosure: I am part of Trade Nation's Influencer program and receive a monthly fee for using their TradingView charts in my analysis.

GBPAUD: Bearish After News 🇬🇧🇦🇺
GBPAUD looks bearish after the release of the US news today.
I see a strong intraday bearish pattern on an hourly time frame:
head and shoulders with a breakout of its neckline.
I will expect a bearish continuation to 2.0668 support.
❤️Please, support my work with like, thank you!❤️
I am part of Trade Nation's Influencer program and receive a monthly fee for using their TradingView charts in my analysis.

XAU/USD Bullish Bounce from Demand Zone !Gold (XAU/USD) on the 4H chart is showing a potential bullish reversal setup. Price has pulled back into a Fair Value Gap (FVG) and high supply/demand zone near 3,329–3,315, aligning with the 0.382–0.5 Fibonacci retracement.
Key Points:
Support Zone: 3,329–3,315 (demand + FVG).
Bullish Rejection Expected: Price may bounce from this zone, targeting upper resistance levels.
Upside Targets:
TP1: 3,356
TP2: 3,375
TP3: 3,440–3,459 (major resistance)
Invalidation: A daily close below 3,315 could open room for deeper downside toward 3,278–3,245.
Indicators: EMA(9) and Ichimoku showing potential for trend resumption if price closes above 3,362.
Overall, the chart suggests a buy setup on bullish confirmation, aiming for the 3,375–3,459 zone.

Economic Factors That May Affect the Forex MarketEconomic Factors That Affect the Forex Market
The foreign exchange market is influenced by a wide range of economic factors which have a significant impact on currency exchange rates. Knowing about these factors is crucial for anyone looking to trade in the forex market, as they can help analyse price movements.
This article explores some key factors that may affect the forex market and lead to changes in the rates of currency pairs. You’ll learn about the influence of macroeconomic statistics, capital markets, economic data, and more. These factors collectively contribute to the volatility and dynamics of the forex market.
Economic Factors
These economic factors interact with each other in complex ways, and forex traders use a combination of analysis and research to make informed trading decisions. Understanding how these factors impact currency movements is essential for participants in the forex market.
Economic Health
Macroeconomic statistics fall into a category of factors affecting the currency market. The term refers to a set of main indicators that provide insights into the overall performance and health of an economy. These are GDP data, unemployment rates, trade and current account balances, interest rates, and inflation data. Countries with strong economic indicators are typically more attractive to foreign investors. This leads to an appreciation of their currencies. On the contrary, poor economic performance can lead to a decline in a country’s currency value.
Central Bank Policies
Central bank monetary policy decisions, including quantitative easing, forward guidance, and open market operations, can have a direct impact on a country's currency. Announcements and statements by central bank officials are closely monitored by forex traders.
Interest rates are among the most popular central bank tools. Central banks around the world set and regularly change them, and these rates have a direct impact on the value of a country’s currency. In most cases, higher interest rates attract foreign investment. The increased demand for the currency can cause its value to appreciate. In contrast, lower interest rates can lead to a decrease in the value of a currency as investors seek higher returns elsewhere.
The Influence of the Capital Markets
One of the factors affecting the foreign exchange market that we should remember is the influence of the capital markets. Commodity, stock, bond, and other markets also have a strong influence on exchange rates. To illustrate, when a country experiences a rise or sell-off in securities, this may indicate a change in its economic outlook. This typically affects investor sentiment and capital flows.
Traders try to stay updated to apply the most efficient strategy and avoid large losses. They can learn about these events through various sources, including news outlets, financial websites, and even trading platform blogs and news sections.
Imports and Exports
Other significant factors that affect forex trading are imports and exports. When a country’s exports exceed imports, a trade surplus occurs, which strengthens the economy and causes the value of the currency to rise. This happens because foreign consumers buy foreign currency to purchase exported goods. Conversely, when imports exceed exports, a trade deficit occurs, and the country is forced to sell its currency to buy imported goods. This may lead to a decline in the value of the domestic currency.
Government Debt
Government debt is not necessarily a bad thing; however, a government with high debt may find it more difficult to obtain foreign capital if it isn’t seen as reliable by investors. Conversely, a government with low debt and a history of not defaulting is likely to be considered more stable, which can positively impact its currency value. Traders can find information on government debt in financial news outlets, on economic research websites, and in other national sources.
Trade-Weighted Index
A Trade-Weighted Index (TWI) is a measure used in international economics and finance to assess the relative strength or value of a country's currency against a basket of other currencies. Unlike a simple exchange rate, which reflects the value of one currency in terms of another, a Trade-Weighted Index takes into account a country's trade relationships with multiple trading partners.
A Trade-Weighted Index provides a more comprehensive view of a country's currency value because it considers the impact of its trade relationships with multiple partners. It is particularly useful for countries heavily involved in international trade and can be used by policymakers, investors, and economists to gauge currency competitiveness and evaluate the potential impact of currency movements on a country's trade balance.
Final Thoughts
Experienced traders carefully consider factors influencing the forex market and explore their potential impact on exchange rates. It is critical to note that these economic factors do not operate in isolation, and their impact on the forex market can be complex. For example, while high interest rates may attract foreign investment in a certain country and cause its currency to appreciate, they can also lead to decreased consumer spending and economic slowdown, which may ultimately lead to a depreciation of the currency.
Often, traders rely on both economic indicators and technical analysis tools, considering previous price movements in the market. They can compare historical quotes of currency pairs and track what news or indicators were associated with the changes.
This article represents the opinion of the Companies operating under the FXOpen brand only. It is not to be construed as an offer, solicitation, or recommendation with respect to products and services provided by the Companies operating under the FXOpen brand, nor is it to be considered financial advice.
GBPUSD – Hourly Head & Shoulders in PlaySpotting a potential head and shoulders pattern on the GBPUSD hourly chart.
I’m still waiting for confirmation before entering the trade.
Trade Setup:
Risk/Reward: 3.4
Entry: 1.34433
Stop Loss: 1.34645
Take Profit 1 (50%): 1.33822
Take Profit 2 (50%): 1.33603
On the higher time frame, price is also testing diagonal resistance — adding extra confluence to the short bias.
For now, it’s a waiting game to see if the pattern confirms.
💡 Trading Tip: Nobody knows for certain where the market will go — always predefine your risk before entering a trade.
Please note: This is not financial advice. This content is to track my trading journey and for educational purposes only.

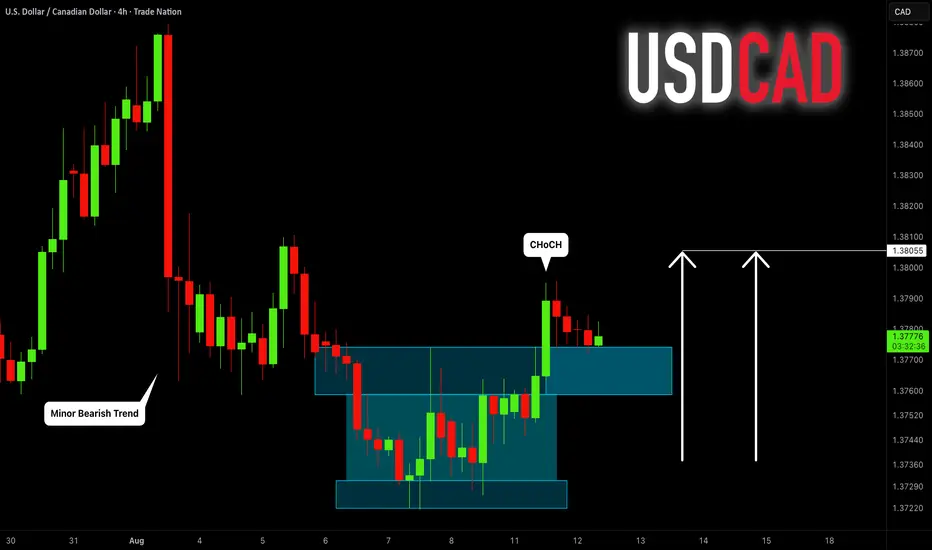
USDCAD: Intraday Bullish Reversal 🇺🇸🇨🇦
USDCAD will likely go up, following a confirmed
bullish Change of Character CHoCH.
Next resistance is 1.3805
❤️Please, support my work with like, thank you!❤️
I am part of Trade Nation's Influencer program and receive a monthly fee for using their TradingView charts in my analysis.
XAUUSDGold Price Update: As of July 31, 2025, the gold price has risen to test the resistance level at $3,408, or an increase of +139 USD as expected.
And the price could not break through the 3408 level, there was short-term selling pressure coming back in, so the price dropped.
However, if the price can hold above 3249, I still expect gold to remain in an uptrend, considering buying in the red zone.
🔥Trading futures, forex, CFDs and stocks carries a risk of loss.
Please consider carefully whether such trading is suitable for you.
>>GooD Luck 😊
❤️ Like and subscribe to never miss a new idea!

AUDCAD: Pullback From Resistance 🇦🇺🇨🇦
AUDCAD may retrace from the underlined blue resistance.
A breakout of a support line of a rising wedge pattern
after its test leaves a strong bearish clue.
We can expect a pullback to 0.8962 level.
❤️Please, support my work with like, thank you!❤️
I am part of Trade Nation's Influencer program and receive a monthly fee for using their TradingView charts in my analysis.

Market Analysis: NZD/USD Much Higher—Uptrend Shows StrengthMarket Analysis: NZD/USD Much Higher—Uptrend Shows Strength
NZD/USD is also rising and might aim for more gains above 0.5970.
Important Takeaways for NZD/USD Analysis Today
- NZD/USD is consolidating gains above the 0.5940 zone.
- There is a short-term declining channel forming with resistance at 0.5960 on the hourly chart of NZD/USD.
NZD/USD Technical Analysis
On the hourly chart of NZD/USD on FXOpen, the pair started a steady increase from the 0.5880 zone. The New Zealand Dollar broke the 0.5925 resistance to start the recent increase against the US Dollar.
The pair settled above 0.5940 and the 50-hour simple moving average. It tested the 0.5970 zone and is currently consolidating gains. There was a move below the 23.6% Fib retracement level of the upward move from the 0.5881 swing low to the 0.5971 high.
The NZD/USD chart suggests that the RSI is stable above 50. On the upside, the pair might struggle near 0.5960. There is also a short-term declining channel forming with resistance at 0.5960.
The next major resistance is near the 0.5970 level. A clear move above the 0.5970 level might even push the pair toward the 0.6000 level. Any more gains might clear the path for a move toward the 0.6020 resistance zone in the coming days.
On the downside, immediate support is near the 0.5940 level. The first key support is near the 0.5925 level. It is close to the 50% Fib retracement level of the upward move from the 0.5881 swing low to the 0.5971 high.
The next major support is near the 0.5900 level. If there is a downside break below it, the pair might slide toward 0.5880. Any more losses could lead NZD/USD to 0.5820.
This article represents the opinion of the Companies operating under the FXOpen brand only. It is not to be construed as an offer, solicitation, or recommendation with respect to products and services provided by the Companies operating under the FXOpen brand, nor is it to be considered financial advice.

Market Analysis: AUD/USD Much Higher—Uptrend Shows StrengthMarket Analysis: AUD/USD Much Higher—Uptrend Shows Strength
AUD/USD started a decent increase above the 0.6480 and 0.6500 levels.
Important Takeaways for AUD/USD Analysis Today
- The Aussie Dollar started a decent increase above the 0.6450 level against the US Dollar.
- There is a connecting bearish trend line forming with resistance at 0.6530 on the hourly chart of AUD/USD.
AUD/USD Technical Analysis
On the hourly chart of AUD/USD, the pair started a fresh increase from the 0.6450 support. The Aussie Dollar was able to clear the 0.6470 resistance to move into a positive zone against the US Dollar.
There was a close above the 0.6500 resistance and the 50-hour simple moving average. Finally, the pair tested the 0.6540 zone. A high was formed near 0.6541 and the pair recently started a consolidation phase.
There was a move below the 23.6% Fib retracement level of the upward move from the 0.6449 swing low to the 0.6541 high. On the downside, initial support is near the 0.6510 level.
The next major support is near the 0.6495 zone or the 50% Fib retracement level. If there is a downside break below 0.6495, the pair could extend its decline toward the 0.6470 level. Any more losses might signal a move toward 0.6450.
On the upside, the AUD/USD chart indicates that the pair is now facing resistance near 0.6530. There is also a connecting bearish trend line forming with resistance at 0.6530.
The first major resistance might be 0.6540. An upside break above it might send the pair further higher. The next major resistance is near the 0.6580 level. Any more gains could clear the path for a move toward the 0.6600 resistance zone.
This article represents the opinion of the Companies operating under the FXOpen brand only. It is not to be construed as an offer, solicitation, or recommendation with respect to products and services provided by the Companies operating under the FXOpen brand, nor is it to be considered financial advice.

Gold Technical & Fundamental Update | August 11–15, 2025XAUUSD closed last week near $3,400 after breaking above the resistance of the descending channel. Price action has been choppy, hinting at cautious buying ahead of major U.S. events this week, CPI, PPI, Retail Sales, and Fed commentary.
Key levels:
✅$3,380: Above = bullish bias continues; Below = look for selling setups
✅Support: Former channel resistance now acting as a retest zone
✅Trend guide: Ascending trendlines from the early August recovery
Watch how gold reacts to $3,380 early in the week. This will set the tone for either continuation toward recent highs or a deeper pullback.
#gold #xauusd #forex #technicalanalysis #marketupdate #tradingvie
I’ll update my thoughts in the comments as price action unfolds.
Disclaimer:
Based on experience and what I see on the charts, this is my take. It’s not financial advice—always do your research and consult a licensed advisor before trading.


EURUSDHello Traders! 👋
What are your thoughts on EURUSD?
EUR/USD is trading below a key resistance area and has recently completed a pullback to the broken trendline.
As long as the pair remains under this resistance, we expect some short-term consolidation, followed by a renewed bearish move toward lower levels.
The bearish outlook remains valid while price stays below the resistance zone.
A clean break above this level would invalidate the bearish scenario.
Will EUR/USD resume its decline, or break through resistance? Share your view below! 👇
Don’t forget to like and share your thoughts in the comments! ❤️

Fed cuts interest rates or political tensions riseExperts from financial institutions such as Tierra, Goldman Sachs, and UBS predict that the world gold price in August will fluctuate around the threshold of 3,420 - 3,520 USD/ounce, and may exceed 3,600 USD/ounce if the FED cuts interest rates or political tensions increase.
Ms. Soni Kumari - commodity strategist at ANZ, commented: "Uncertainty is back in the spotlight, especially after new developments related to tariffs, which is reviving safe-haven demand. In addition, macro market sentiment also supports gold, especially when the USD weakens and expectations of the FED cutting interest rates increase."

MarketBreakdown | USDJPY, NZDUSD, EURJPY, US100
Here are the updates & outlook for multiple instruments in my watch list.
1️⃣ #USDJPY daily time frame 🇺🇸🇯🇵
The market is trading in uptrend.
After the price updated a high, it retraced.
I see a consolidation now and a formation of a narrow
horizontal trading range.
A bullish breakout of a resistance of the range and a daily
candle close above that will provide a strong trend-following bullish signal.
An uptrend will most likely resume then.
2️⃣ #NZDUSD daily time frame 🇳🇿🇺🇸
A test of a historically significant major demand cluster triggered a strong
bullish reaction. The price violated a strong resistance and closed above that.
I think that the market will most likely continue growing.
3️⃣ #EURJPY daily time frame 🇪🇺🇯🇵
The pair is trading within a horizontal parallel channel.
With the absence of high impact fundamental news today,
I think that the market will most likely continue consolidating
and the price may retrace from the resistance.
4️⃣ #NASDAQ Index #US100 daily time frame 🇺🇸🇨🇭
Looks like the market is preparing to update the ATH.
A confirmed violation of a minor daily resistance and a valid
Change of Character on intraday time frames indicate clear
strength of the buyers.
I guess that 23700 level will be tested soon with its highly probable breakout.
Do you agree with my market breakdown?
❤️Please, support my work with like, thank you!❤️
I am part of Trade Nation's Influencer program and receive a monthly fee for using their TradingView charts in my analysis.

EURUSD; Heikin Ashi Trade Idea📈 Hey Traders!
Here’s a fresh outlook from my trading desk. If you’ve been following me for a while, you already know my approach:
🧩 I trade Supply & Demand zones using Heikin Ashi chart on the 4H timeframe.
🧠 I keep it mechanical and clean — no messy charts, no guessing games.
❌ No trendlines, no fixed sessions, no patterns, no indicator overload.
❌ No overanalyzing market structure or imbalances.
❌ No scalping, and no need to be glued to the screen.
✅ I trade exclusively with limit orders, so it’s more of a set-and-forget style.
✅ This means more freedom, less screen time, and a focus on quality setups.
✅ Just a simplified, structured plan and a calm mindset.
💬 Let’s Talk:
💡Do you trade supply & demand too ?
💡What’s your go-to timeframe ?
💡Ever tried Heikin Ashi ?
📩 Got questions about my strategy or setup? Drop them below — ask me anything, I’m here to share.
Let’s grow together and keep it simple. 👊

Forex Market Structure and Factors Affecting ItForex Market Structure and Factors Affecting It
The forex market, a vast and dynamic financial arena, operates uniquely as a decentralised over-the-counter network. This article delves into its intricate structure, exploring the roles of various participants and the influence of technology. Understanding these elements is essential for anyone looking to navigate and succeed in the world of forex trading.
Understanding Market Structure in Forex
The structure of the foreign exchange market, commonly known as the forex market, is uniquely decentralised and operates over-the-counter (OTC). Unlike traditional markets with a central exchange, forex is a vast network of dealers, brokers, and financial institutions globally. This setup allows for 24-hour trading five days a week, accommodating various time zones and providing constant access to market participants.
Each participant plays a pivotal role in shaping the basic market structure of forex, with banks and financial institutions primarily acting as market makers, providing liquidity and setting prices for retail traders and brokers. This complex web of interactions and the decentralised nature of the market ensure constant movement in currency values, offering numerous opportunities for trading and speculation.
Participants in the Forex Market
In the diverse landscape of forex trading, the structure is made up of a range of participants. Each group influences the market's dynamics in unique ways:
- Central Banks and Governments: They regulate monetary policies and currency supply, impacting prices. For example, the US Federal Reserve significantly influences the value of the US dollar.
- Commercial Banks: As intermediaries, they facilitate transactions and engage in speculative trading, contributing to liquidity.
- Multinational Corporations: Involved in cross-border transactions, these entities engage in trading to manage currency risks.
- Retail Traders: Individual traders speculate on currency movements using online platforms, forming a significant market portion.
- Institutional Traders: Entities like hedge funds and asset management firms, which trade with sophisticated strategies and considerable resources.
Market Tiers and Interactions
The forex market's structure is defined by distinct tiers and interactions among its participants. Each tier plays a unique role:
- Tier 1: Major Players - This top tier includes large banks, financial institutions, and central banks. They have the most significant impact on market dynamics, often setting trends and liquidity standards.
- Tier 2: Intermediaries - Comprising smaller banks and financial firms, they serve as intermediaries, facilitating transactions and linking Tier 1 entities with smaller participants.
- Tier 3: Retail Market - At this level are individual investors, small businesses, and retail traders. They interact with the market primarily through brokers and online platforms, influenced heavily by the actions of the upper tiers.
These tiers illustrate the varied types of market structure in forex, reflecting the complexity and diversity of trading interactions.
Central Bank's Role in Market Structure
Central banks play a pivotal role in shaping the advanced market structure in forex. They influence the market through several key mechanisms:
- Monetary Policy: Central banks determine monetary policy, which directly influences interest rates. This, in turn, affects the attractiveness of a country's currency, thereby impacting forex rates and market dynamics.
- Market Stabilisation: In times of volatility, central banks can intervene in currency markets to stabilise currencies. Interventions involve buying or selling their own currency to influence exchange rates, directly affecting market structure.
- Regulatory Oversight: Central banks often have a regulatory role, overseeing banking and financial systems. Their regulations can influence accessibility, liquidity, and transparency, which are critical for a well-functioning forex market.
- Economic Signalling: Central banks release economic data and policy decisions that serve as key indicators for traders. This information can lead to anticipatory moves in the markets, shaping prices based on perceived economic strength or weakness.
- Foreign Exchange Reserves Management: Central banks manage significant foreign exchange reserves. Their strategies in managing these reserves, including decisions on when and how much to buy or sell, have a substantial impact on forex liquidity.
Technology’s Impact on Market Structure
Technological advancements have significantly reshaped the market structure in forex, introducing new dynamics and efficiencies. Electronic trading platforms, like electronic communication networks (ECNs), have revolutionised access to the forex market. Before these platforms, trades were often executed via traditional methods like phone calls.
Algorithmic trading uses computer programs for automatic trade execution, enabling fast, consistent transactions. High-frequency trading (HFT), a subset of algorithmic trading, executes thousands of trades per second, enhancing liquidity and reducing transaction costs but also raising concerns about market stability.
Furthermore, big data and analytics allow traders to analyse large datasets for price trends, refining their strategies. Mobile trading has democratised access, enabling trading from virtually anywhere, which has increased competition among brokers and accessibility for retail traders. These technological developments have increased efficiency and accessibility, contributing to a more interconnected and dynamic market.
The Bottom Line
Understanding the forex market structure is crucial for successful trading. This decentralised OTC network thrives on the interactions among various participants, influenced by central banks' policies and technological advancements. As traders navigate this dynamic environment, the right tools and knowledge are key.
This article represents the opinion of the Companies operating under the FXOpen brand only. It is not to be construed as an offer, solicitation, or recommendation with respect to products and services provided by the Companies operating under the FXOpen brand, nor is it to be considered financial advice.
