EURUSDEURUSD price has a chance to test the 1.14550 and 1.15419 levels. If the price cannot break through the 1.15419 resistance zone, it is expected that the price has a chance to go down. Consider selling the red zone.
🔥Trading futures, forex, CFDs and stocks carries a risk of loss.
Please consider carefully whether such trading is suitable for you.
>>GooD Luck 😊
❤️ Like and subscribe to never miss a new idea!
Forextrading

LONG USDZARThere seems to be huge demand for USD especially on the USDZAR pair.
The pair has printed the lowest prices it will reach during the month of May 2025, and probably June 2025 as well.
As such, we will be trading upwards from hereon.

EUR/CAD (Trade Recap), USD/JPY (Trade Recap) and GBP/USD Long GBP/USD Long
Minimum entry requirements:
• 1H impulse up above area of value.
• If tight non-structured 5 min continuation follows, reduced risk entry on the break of it.
• If tight structured 5 min continuation follows, reduced risk entry on the break of it or 5 min risk entry within it.
• If tight non-structured 15 min continuation follows, 5 min risk entry within it if the continuation is structured on the 5 min chart or reduced risk entry on the break of it.
• If tight structured 15 min continuation follows, reduced risk entry on the break of it or 15 min risk entry within it.

Market Analysis: NZD/USD Ready to Climb AgainMarket Analysis: NZD/USD Ready to Climb Again
NZD/USD is also rising and could aim for a move above the 0.5945 resistance.
Important Takeaways for NZD/USD Analysis Today
- NZD/USD is consolidating above the 0.5915 support.
- There was a break above a connecting bearish trend line with resistance at 0.5910 on the hourly chart of NZD/USD at FXOpen.
NZD/USD Technical Analysis
On the hourly chart of NZD/USD on FXOpen, the pair also followed AUD/USD. The New Zealand Dollar formed a base above the 0.5900 level and started a decent increase against the US Dollar.
The pair climbed above the 0.5980 resistance. It tested the 0.6020 resistance before there was a pullback. The recent low was formed at 0.58704 and the pair is again rising above the 50-hour simple moving average.
There was a break above a connecting bearish trend line with resistance at 0.5910. The pair cleared the 0.5915 resistance and the 23.6% Fib retracement level of the downward move from the 0.6022 swing high to the 0.5870 low.
The NZD/USD chart suggests that the RSI is back above 50 signaling a positive bias. On the upside, the pair is facing resistance near the 50% Fib retracement level of the downward move from the 0.6022 swing high to the 0.5870 low at 0.5945.
The next major resistance is near the 0.5985 level. A clear move above the 0.5985 level might even push the pair toward the 0.6020 level. Any more gains might clear the path for a move toward the 0.6050 resistance zone in the coming days.
On the downside, there is a support forming near the 0.5915 zone. If there is a downside break below the 0.5915 support, the pair might slide toward 0.5870. Any more losses could lead NZD/USD in a bearish zone to 0.5810.
This article represents the opinion of the Companies operating under the FXOpen brand only. It is not to be construed as an offer, solicitation, or recommendation with respect to products and services provided by the Companies operating under the FXOpen brand, nor is it to be considered financial advice.

Market Analysis: AUD/USD Ready to Climb AgainMarket Analysis: AUD/USD Ready to Climb Again
AUD/USD is attempting a fresh increase from the 0.6370 support.
Important Takeaways for AUD/USD Analysis Today
- The Aussie Dollar found support at 0.6370 and recovered higher against the US Dollar.
- There was a break above a key bearish trend line with resistance at 0.6410 on the hourly chart of AUD/USD at FXOpen.
AUD/USD Technical Analysis
On the hourly chart of AUD/USD at FXOpen, the pair formed a base above 0.6420. The Aussie Dollar started a decent increase above the 0.6450 resistance against the US Dollar, as mentioned in the previous analysis.
The pair even cleared 0.6500 before there was a minor pullback. The recent low was formed at 0.6370 and the pair is again rising. The bulls pushed the pair above the 23.6% Fib retracement level of the downward move from the 0.6514 swing high to the 0.6370 low.
Besides, there was a break above a key bearish trend line with resistance at 0.6410. The pair is now consolidating above the 50-hour simple moving average. On the upside, the AUD/USD chart indicates that the pair is now facing resistance near the 0.6440 zone.
The first major resistance might be 0.6460 and the 61.8% Fib retracement level of the downward move from the 0.6514 swing high to the 0.6370 low. An upside break above the 0.6460 resistance might send the pair further higher. The next major resistance is near the 0.6515 level. Any more gains could clear the path for a move toward the 0.6550 resistance zone.
If not, the pair might correct lower. Immediate support sits near the 0.6410 level. The next support could be 0.6370. If there is a downside break below the 0.6370 support, the pair could extend its decline toward the 0.6320 zone. Any more losses might signal a move toward 0.6300.
This article represents the opinion of the Companies operating under the FXOpen brand only. It is not to be construed as an offer, solicitation, or recommendation with respect to products and services provided by the Companies operating under the FXOpen brand, nor is it to be considered financial advice.

Mon 12th May 2025 GBP/AUD Daily Forex Chart Buy SetupGood morning fellow traders. On my Daily Forex charts using the High Probability & Divergence trading methods from my books, I have identified a new trade setup this morning. This trade being a GBP/AUD Buy. As usual, you can see the details of the trade/s on the chart. Keep in mind that I am generally looking to buy when the MACD is below the zero level & sell when it is above the zero level. The red/blue QMP Filter dots on the price chart produce the actual trade signal. I am also considering things like divergence, support/resistance, round numbers etc, and these will be marked up on the chart. Enjoy the day all. Cheers. Jim

Mon 12th May 2025 GBP/CAD Daily Forex Chart Buy SetupGood morning fellow traders. On my Daily Forex charts using the High Probability & Divergence trading methods from my books, I have identified a new trade setup this morning. As usual, you can read my notes on the chart for my thoughts on this setup. The trade being a GBP/CAD Buy. Enjoy the day all. Cheers. Jim

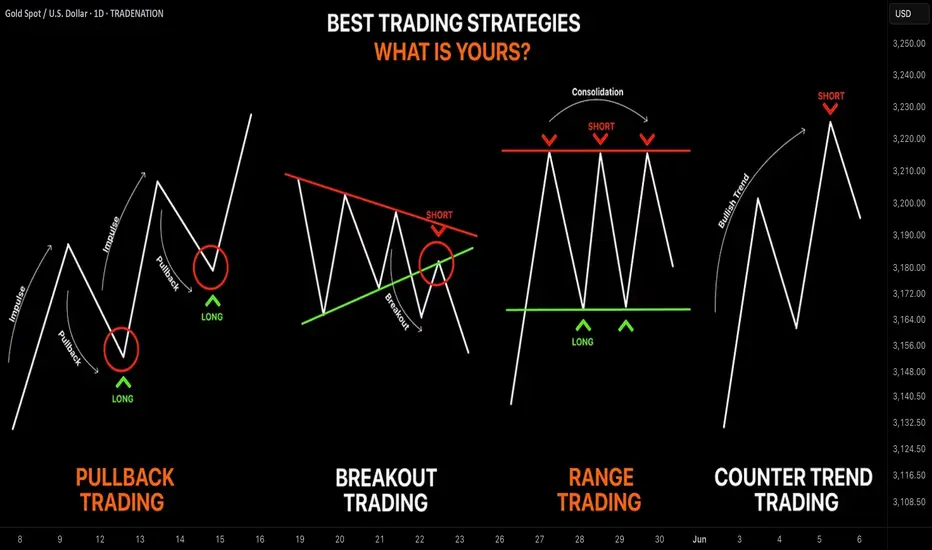
Learn the 4 Best Strategies to Maximize Your Profits in Trading
In the today's article, we will discuss 4 classic yet profitable forex and gold trading strategies.
1️⃣Pullback Trading
Pullback trading is a trend-following strategy where you open the positions after pullbacks.
If the market is trading in a bullish trend, your goal as a pullback trader is to wait for a completion of a bullish impulse and then let the market correct itself. Your entry should be the assumed completion point of a correctional movement. You expect a trend-following movement from there.
In a bearish trend, you wait for a completion of the bearish impulse, let the market retrace, and you look for short-entry after a completion of the retracement leg.
Here is the example of pullback trading.
On the left chart, we see the market that is trading in a bearish trend.
A pullback trader would short the market upon completion of the correctional moves.
On the right chart, I underlined the buy entry points of a pullback trader.
That strategy is considered to be one of the simplest and profitable and appropriate for newbie traders.
2️⃣Breakout Trading
Breakout trading implies buying or selling the breakout of a horizontal structure or a trend line.
If the price breaks a key support, it signifies a strong bearish pressure.
Such a violation will trigger a bearish continuation with a high probability.
Alternatively, a bullish breakout of a key resistance is a sign of strength of the buyers and indicates a highly probable bullish continuation.
Take a look, how the price broke a key daily resistance on a daily time frame. After a breakout, the market retested the broken structure that turned into a support. A strong bullish rally initiated from that.
With the breakout trading, the best entries are always on a retest of a broken structure.
3️⃣Range Trading
Range trading signifies trading the market that is consolidating .
Most of the time, the market consolidates within the horizontal ranges.
The boundaries of the range may provide safe points to buy and sell the market from.
The upper boundary of the range is usually a strong resistance and one may look for shorting opportunities from there,
while the lower boundary of the range is a safe place to buy the market from.
EURCAD pair is trading within a horizontal range on a daily.
The support of the range is a safe zone to buy the market from.
A bullish movement is anticipated to the resistance of the range from there.
Taking into considerations, that the financial instruments may consolidate for days, weeks and even months, range trading may provide substantial gains.
4️⃣Counter Trend Trading
Counter trend trading signifies trading against the trend.
No matter how strong is the trend, the markets always trade in zig-zags. After impulses follow the corrections , and after the corrections follow the impulses.
Counter trend traders looks for a completion of the bullish impulses in a bullish trend to short the market, and for a completion of bearish impulses in a downtrend to buy it.
Here is the example of a counter trend trade.
EURJPY is trading in a bullish trend. However, the last 3 bearish moves initiated from a rising trend line. For a trader, shorting the trend line was a perfect entry to catch a bearish move.
Such trading strategy is considered to be one of the most complicated , because one goes against the crowd and overall sentiment.
With the experience, traders may combine these strategies.
❤️Please, support my work with like, thank you!❤️
I am part of Trade Nation's Influencer program and receive a monthly fee for using their TradingView charts in my analysis.
AUDUSD: Channel Down aiming higher.AUDUSD is neutral on its 1D technical outlook (RSI = 53.946, MACD = 0.004, ADX = 53.336) trading between the 1D MA200 and 1D MA50. It is now on the middle (0.5 Fibonacci level) of the long term Channel Down and every bullish wave touched at least the 0.236 Fib. The trade is long, TP = 0.66200.
## If you like our free content follow our profile to get more daily ideas. ##
## Comments and likes are greatly appreciated. ##

GBPAUD: 2 Strong Bearish Confirmations 🇬🇧🇦🇺
GBPAUD is in a very bearish price action after a test
of the underlined horizontal resistance.
The price formed an inverted cup and handle pattern
and violated its neckline and a support line of a rising
parallel channel on an hourly time frame.
Probabilities will be high to see a decline at least to 2.064 support.
❤️Please, support my work with like, thank you!❤️

Market Analysis: USD/CHF Regains StrengthMarket Analysis: USD/CHF Regains Strength
USD/CHF is rising and might aim for a move toward the 0.8400 resistance.
Important Takeaways for USD/CHF Analysis Today
- USD/CHF is showing positive signs above the 0.8265 resistance zone.
- There is a connecting bullish trend line forming with support at 0.8300 on the hourly chart at FXOpen.
USD/CHF Technical Analysis
On the hourly chart of USD/CHF at FXOpen, the pair started a decent increase from the 0.8200 support. The US Dollar climbed above the 0.8245 resistance zone against the Swiss Franc.
The bulls were able to pump the pair above the 50-hour simple moving average and 0.8300. A high was formed at 0.8340 and the pair is now consolidating gains above the 23.6% Fib retracement level of the upward move from the 0.8185 swing low to the 0.8340 high.
There is also a connecting bullish trend line forming with support at 0.8300. On the upside, the pair is now facing resistance near 0.8340. The main resistance is now near 0.8350.
If there is a clear break above the 0.8350 resistance zone and the RSI remains above 50, the pair could start another increase. In the stated case, it could test 0.8400. If there is a downside correction, the pair might test the 0.8300 level.
The first major support on the USD/CHF chart is near the 0.8265 level and the 50% Fib retracement level of the upward move from the 0.8185 swing low to the 0.8340 high.
The next key support is near the 0.8245 level. A downside break below 0.8245 might spark bearish moves. Any more losses may possibly open the doors for a move toward the 0.8200 level in the near term.
This article represents the opinion of the Companies operating under the FXOpen brand only. It is not to be construed as an offer, solicitation, or recommendation with respect to products and services provided by the Companies operating under the FXOpen brand, nor is it to be considered financial advice.

USDCAD: Important Breakout 🇺🇸🇨🇦
USDCAD broke and closed above a significant daily resistance cluster.
The broken structure turns into a solid demand zone now.
The next strong resistance is 1.3957.
It will most likely be the next goal for the buyers.
❤️Please, support my work with like, thank you!❤️
I am part of Trade Nation's Influencer program and receive a monthly fee for using their TradingView charts in my analysis.

GBP/AUD Short, EUR/CAD Short, USD/JPY Short and EUR/USD NeutralGBP/AUD Short
Minimum entry requirements:
• If tight non-structured 15 min continuation forms, 5 min risk entry within it if the continuation is structured on the 5 min chart or reduced risk entry on the break of it.
• If tight structured 15 min continuation forms, reduced risk entry on the break of it or 15 min risk entry within it.
• If tight non-structured 1H continuation forms, 15 min risk entry within it if the continuation is structured on the 15 min chart or reduced risk entry on the break of it.
• If tight structured 1H continuation forms, 1H risk entry within it or reduced risk entry on the break of it.
EUR/CAD Short
Minimum entry requirements:
• If structured 1H continuation forms, 1H risk entry within it.
USD/JPY Short
Minimum entry requirements:
• 1H impulse down below area of value.
• If tight non-structured 15 min continuation follows, 5 min risk entry within it if the continuation is structured on the 5 min chart or reduced risk entry on the break of it.
• If tight structured 15 min continuation follows, reduced risk entry on the break of it or 15 min risk entry within it.
EUR/USD Neutral
Minimum entry requirements:
• 1H impulse up above area of interest.
• If tight non-structured 5 min continuation follows, reduced risk entry on the break of it.
• If tight structured 5 min continuation follows, reduced risk entry on the break of it or 5 min risk entry within it.
• If tight non-structured 15 min continuation follows, 5 min risk entry within it if the continuation is structured on the 5 min chart or reduced risk entry on the break of it.
• If tight structured 15 min continuation follows, reduced risk entry on the break of it or 15 min risk entry within it.
Minimum entry requirements:
• If structured 1H continuation forms, 1H risk entry within it.

Fri 9th May 2025 AUD/USD Daily Forex Chart Sell SetupGood morning fellow traders. On my Daily Forex charts using the High Probability & Divergence trading methods from my books, I have identified a new trade setup this morning. As usual, you can read my notes on the chart for my thoughts on this setup. The trade being a AUD/USD Sell. Enjoy the day all. Cheers. Jim

GBPJPY: Entering the most optimal medium-term Sell Zone.The GBPJPY pair is bullish on its 1D technical outlook (RSI = 59.237, MACD = 0.300, ADX = 16.909) as it is expanding the bullish wave of the 6 month Channel Down. The two prior peaked on the 0.786 and 0.9 Fibonacci retracement level respectively. This bullish wave has already reached the 0.786 Fib, so it has entered the most optimal Sell Zone for the medium term. Even if it peaks on the 0.9 Fib, a -5.90% bearish wave (similar with the 3 prior) would test 183.500.
See how our prior idea has worked out:
## If you like our free content follow our profile to get more daily ideas. ##
## Comments and likes are greatly appreciated. ##

Gold Price Analysis May 8D1 candlesticks started to show some selling pressure but were still pushed back by buyers at the beginning of today's Asian session
Gold is falling at the end of the Asian session towards 3373. BUY zones are noted at the support zones that buyers are waiting for first 3373-3353-3338
On the opposite side, the sell borders 3405 and 3424 are considered for scalping when the price pushes up. These are data analyzing price zones with strong buying and selling pressure in the past, paying more attention to the current price reaction to have the best trading strategy.

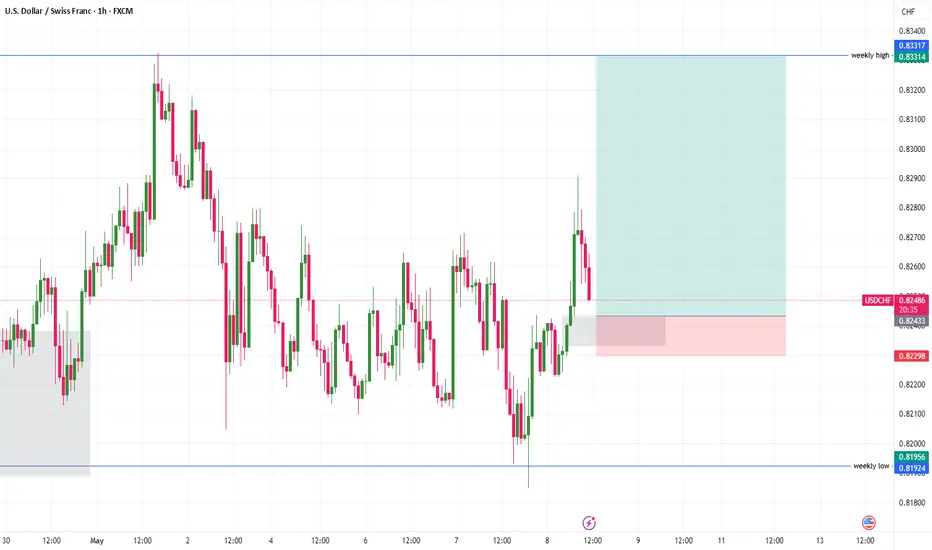
USDCHF Trade Idea, AMD PATTERN: last trade of the week for meClean setup unfolding on USDCHF! After grabbing liquidity near the weekly low (0.81924), price showed strength and reversed with conviction (AMD Pattern). Entered long from the refined demand zone and now eyeing the weekly high at 0.83317 as target.
📌 Trade Breakdown:
🔹 Entry Zone: Bullish reaction from demand
🔹 Confluence: Liquidity sweep + internal structure shift
🔹 Target: Weekly high zone at 0.83317
🔹 Risk/Reward: Solid R:R with protected downside below recent low
Let’s see if bulls can maintain momentum and drive us to TP! 📈🔥
#USDCHF #SmartMoneyConcepts #ForexTrading #LiquiditySweep #TradingView #TradeSetu
Thu 8th May 2025 USD/CAD Daily Forex Chart Buy SetupGood morning fellow traders. On my Daily Forex charts using the High Probability & Divergence trading methods from my books, I have identified a new trade setup this morning. As usual, you can read my notes on the chart for my thoughts on this setup. The trade being a USD/CAD Buy. Enjoy the day all. Cheers. Jim

EURUSD: Bullish trend intact unless this pattern breaks.EURUSD remains marginally bullish on its 1D technical outlook (RSI = 56.708, MACD = 0.008, ADX = 33.048) as in spite of correction of the last 2 weeks, the Bullish Megaphone remains intact with the price almost on its bottom. This maintains the bullish trend for at least another +7.80% bullish wave (TP = 1.21450). If the Megaphone breaks, the pattern and thus the trade are negated, and the trend turns bearish aiming at the 1D MA50, so the risk of going long now is very low.
## If you like our free content follow our profile to get more daily ideas. ##
## Comments and likes are greatly appreciated. ##

XAUUSD Update – +450 Pips Running SmoothPrice followed our mapped path beautifully, exploding past resistance zones and continuing the bullish trend.
Key breakout levels held strong and momentum stayed aligned with structure.
📈 Current Progress:
✅ +450 pips from entry
📍 Target zone in reach: 3420–3440
📊 Structure remains bullish above 3360–3375
🔔 Follow for precise entries, structure-based ideas, and clean momentum trading.
#XAUUSD #GoldTrading #450Pips #SmartMoneyMoves #FXGoldVision #PriceAction #IntradayTrader

XAU/USD (GOLD) TRADE PLAN 6/5/2025XAU/USD (Gold) Trading Outlook
The current price of XAU/USD around 3380 to 3375. We are anticipating a pullback towards the 3300 level, at which point we will look for long (buy) entry opportunities.
Key Resistance/Target Level:
TARGET 1: 3400
TARGET 2: 3450
TARGET 3: 3480
Key Support Levels:
SUPPORT 1: 3200
SUPPORT 2: 3150
This Strategy is based on the expectation of a price retracement, providing a more favorable risk-reward setup for long positions.

EUR/CAD Short, AUD/CAD Short, USD/CHF Long and USD/JPY ShortEUR/CAD Short
Minimum entry requirements:
• If structured 1H continuation forms, 1H risk entry within it.
AUD/CAD Short
Minimum entry requirements:
• 1H impulse down below area of value.
• If tight non-structured 15 min continuation follows, 5 min risk entry within it if the continuation is structured on the 5 min chart or reduced risk entry on the break of it.
• If tight structured 15 min continuation follows, reduced risk entry on the break of it or 15 min risk entry within it.
USD/CHF Long
Minimum entry requirements:
• Tap into area of value.
• 1H impulse up above area of value.
• If tight non-structured 5 min continuation follows, reduced risk entry on the break of it.
• If tight structured 5 min continuation follows, reduced risk entry on the break of it or 5 min risk entry within it.
• If tight non-structured 15 min continuation follows, 5 min risk entry within it if the continuation is structured on the 5 min chart or reduced risk entry on the break of it.
• If tight structured 15 min continuation follows, reduced risk entry on the break of it or 15 min risk entry within it.
USD/JPY Short
Minimum entry requirements:
• If structured 1H continuation forms, 1H risk entry within it.

USDJPY: Pullback From Support 🇺🇸🇯🇵
There is a high chance that USDJPY will pull back from the underlined blue support.
AS a confirmation, I see a violation of a resistance line of a falling
wedge pattern on an hourly time frame.
Target - 144.35
❤️Please, support my work with like, thank you!❤️
