Market next move
1. Red Zone Retest Failure
Disruption: If the price breaks back below the red highlighted zone (around 3,265–3,270), it may indicate a false breakout.
Impact: This would invalidate the bullish continuation and could lead to a sharp decline toward 3,240 or even lower.
---
2. Low Volume on the Breakout
Disruption: The breakout rally appears strong, but if upcoming candles show declining volume, it may suggest weak momentum.
Impact: A drop in volume could precede a reversal or sideways consolidation instead of the projected move to 3,306.
---
3. Double Top or Bearish Rejection at 3,306
Disruption: The price could reach the 3,306 target and form a double top, leading to bearish rejection.
Impact: This could be the start of a downtrend or extended consolidation.
---
4. Overbought Conditions
Disruption: If momentum indicators like RSI or Stochastic (not shown on chart) are in overbought territory, this could suggest a pullback is likely before continuation.
Impact: May lead to a deeper retracement than expected.
---
5. Macroeconomic or News Catalyst
Disruption: Unforeseen macro events (e.g., interest rate announcements, geopolitical tension) could cause sudden shifts against the technical outlook.
Impact: Could override technical structure entirely.
Forextradingzones

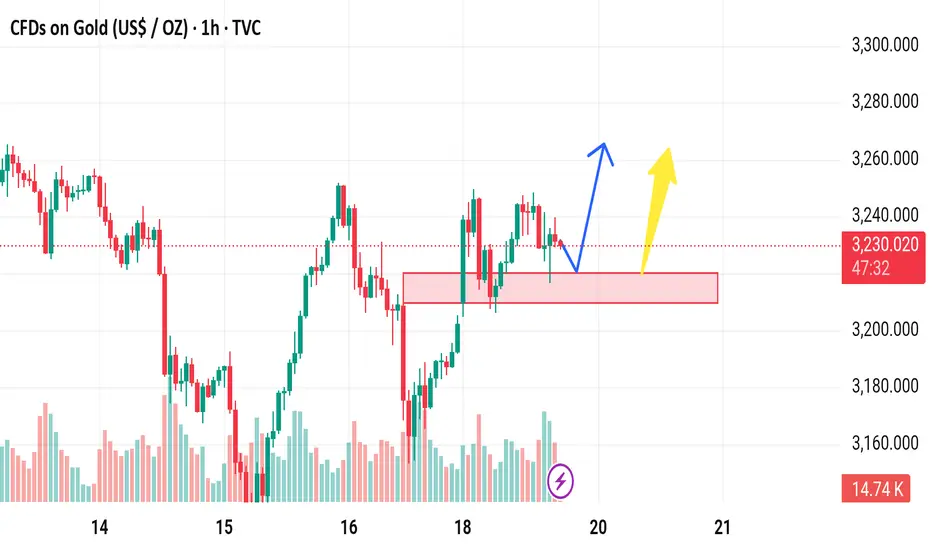
Gold next move The price is currently at a prior resistance level (~3,229) which may act as a supply zone. The market has already failed to break above this level multiple times in the past, indicating strong selling pressure.
2. Volume Divergence
If we analyze the volume at the most recent peaks, there's a possibility of lower buying volume despite higher prices—this could signal weakening bullish momentum.
3. False Breakout Risk
The chart suggests a possible pullback to the red demand zone before continuation. However, if the price fakes out into the zone and fails to hold above ~3,210, this could trigger a deeper selloff.
4. Double Top Formation Risk
There appears to be a potential double top pattern around 3,250–3,260, which may signal a bearish reversal if neckline support (~3,210) is broken.
5. Macroeconomic Influence
Unless supported by strong fundamentals (e.g., dovish Fed signals, rising inflation), any bullish breakout might lack fuel to sustain a rally beyond resistance.
Disruptive Bearish Scenario:
Price breaks below the red demand zone (~3,210).
Retests it as resistance.
Targets the next major support zone near 3,175–3,180.
EURUSD: 5th Wave pendingThe pair is rising impulsively and currently about to conclude it's 4th wave (Circle) and break the previous high under wave-5 circle. The confirmation for the same will come above 1.36.

CAD JPY Entry Setup 1 hour timeframe CAD JPY Entry Setup
Bearish break and retest
Candlestick confirmation: Doji and clow below
Risk to Reward: 1:3

Is There the Best Time to Trade Forex in the UK?Is There the Best Time to Trade Forex in the UK?
Grasping the nuances of forex market hours is essential for traders aiming to optimise their strategies. Operating continuously from Sunday evening to Friday night, the currency market accommodates participants across various time zones without being anchored to a singular physical location.
For those in the UK, recognising when to engage can dramatically influence outcomes. This FXOpen article discusses the pivotal currency trading sessions that may be optimal for UK-based traders.
Understanding Forex Market Hours
Understanding currency exchange market hours is crucial for anyone involved in the global foreign exchange market. Although you may already know this, let us remind you.
The forex market operates on a 24/5 basis, opening during weekdays and closing at weekends. This round-the-clock trading is possible because it’s not tied to a physical location; instead, it relies on a decentralised network of banks, businesses, and individuals exchanging currencies across different time zones.
For traders in the UK, knowing the best forex trading hours can be key to effective trading. The currency market is broadly divided into four main 9-hour-long windows, each starting at different times to cater to traders across the globe. The forex session times UK traders need to be aware of are:
- Sydney Session: 9:00 PM GMT - 6:00 AM GMT
- Tokyo Session: 11:00 PM GMT - 8:00 AM GMT
- London Session: 8:00 AM GMT - 5:00 PM GMT
- New York Session: 1:00 PM GMT - 10:00 PM GMT
Note that during British Summer Time (BST), some of these times are shifted forward by one hour.
These forex market trading times are essential to know, as they indicate when liquidity and volatility are likely to increase, potentially offering favourable market conditions.
The Optimal Times to Trade Forex in the UK
In navigating currency trading, UK-based traders should be aware of two key sessions: London and New York. These periods are optimal forex market hours in the UK, offering greater volumes, volatility, and liquidity. They’re also the periods that see the most releases for three of the major economies: the UK, Eurozone, and the US.
The core forex trading times in the UK are anchored around the London session, which is central to global forex market operations due to London's key position in the financial world. The London trading session time in the UK commences at 8:00 AM GMT (winter time).
This period, ending at 5:00 PM GMT (winter time), is pivotal as it accounts for roughly half of the forex transactions globally, making it a prime trading time due to the high liquidity and the potential for more pronounced price movements.
Likewise, the London-New York trading session time in the UK can be especially advantageous. It’s a crucial overlapping window occurring from 1:00 PM to 5:00 PM GMT (winter time), offering an avenue for traders seeking to maximise their potential returns due to the surge in activity and high-profile economic releases from the US.
During this window, the US stock market opens at 2:30 PM GMT. This secondary opening can also have a notable effect on US dollar-based pairs.
Economic Releases and the Impact on Trading Times for UK Traders
Economic releases and central bank announcements significantly influence UK forex trading times, often driving prices higher or lower. Many UK economic releases—affecting GBP currency pairs—are scheduled around 7:00 AM GMT. This timing offers traders opportunities to engage in trends post-release during the early hours of the London open.
However, some UK data and plenty of Eurozone data are released between 8:00 AM GMT and 10:00 AM GMT, periods typically characterised by increased liquidity and volatility, providing fertile ground for traders.
Likewise, many high-profile US economic announcements—non-farm payrolls, inflation statistics and employment data— are made between 1:00 PM GMT and 3:00 PM GMT. Given the US dollar's dominance on the world stage, these releases can present significant trading opportunities.
Although activity tends to quiet down after London closes, the late hours of the New York session still offer potential entries, albeit with generally lower volatility and volume.
Notably, Federal Reserve interest rate decisions are announced at 7:00 PM GMT with a press conference held after that can cause outsized price movements. The same can be said for the Bank of England and European Central Bank’s interest rate decisions at 12:00 PM GMT and 1:15 PM GMT, respectively, and their subsequent press conferences.
The Worst Time to Trade Forex in the UK
The worst times to trade forex in the UK often occur after 8:00 PM GMT, during the tail end of New York’s hours, when liquidity and volume significantly decrease. This reduction in activity can lead to less favourable trading conditions, including wider spreads and slower execution times.
Additionally, while the Asian session forex time in the UK, partially overlapping with the Sydney session, runs from 11:00 PM to 8:00 AM GMT, it presents challenges for UK traders.
Despite offering trading opportunities, especially in Japanese yen, Australian dollar, and New Zealand dollar-based pairs, the volumes during this period are substantially lower compared to the London and New York sessions. The Tokyo session forex time in the UK accounts for particularly unsociable hours anyway, so many UK traders are unlikely to engage in currency trading during this period.
Trading the London Session: A Strategy
The Asian-London Breakout Strategy leverages the unique dynamics between the calmer Asian session and the volatile London session. It involves setting buy/sell stop orders at the high and low points of the Asian period’s range, aiming to capture movements as London opens at 8:00 AM GMT.
With stop-loss orders placed above or below the range and a strategic approach to take profit – either at the end of the London session or by trailing a stop loss during the day – traders can potentially capitalise on the surge in activity. To delve deeper into this strategy and other session-based setups, consider exploring FXOpen’s 3-session trading system article.
The Bottom Line
Understanding forex trading hours and leveraging optimal times are pivotal for achieving favourable outcomes in currency trading. Luckily, UK-based traders are well placed to take advantage of the many opportunities the currency market presents, given their ability to trade both the London and New York sessions.
For UK traders seeking to navigate the complexities of markets with a trusted broker, opening an FXOpen account can provide all of the tools and insights necessary for effective trading.
FAQs
When Do the Forex Markets Open in the UK?
Forex opening times in the UK start at 8:00 AM GMT (winter time) and at 7:00 AM GMT (summer time) when the London session begins, marking the start of significant trading activity due to London's central role in the global currency arena.
What Time Does the Forex Market Open on Sunday in the UK?
The forex market opens on Sunday at 9:00 PM GMT (winter time) and at 10:00 PM GMT (summer time) in the UK, coinciding with Sydney’s opening and marking the beginning of the trading week.
What Time Does the Forex Market Close on Friday in the UK?
The forex market closes at 10:00 PM GMT (winter time) and at 9:00 PM GMT (summer time) on Friday in the UK, concluding with the end of the New York session and wrapping up the trading week.
Can You Trade Forex on Weekends?
Currency trading on weekends is not possible as the market is closed. Trading resumes with the opening of the Sydney session on Sunday at 9:00 PM GMT (winter time) and at 10:00 PM GMT (summer time).
This article represents the opinion of the Companies operating under the FXOpen brand only. It is not to be construed as an offer, solicitation, or recommendation with respect to products and services provided by the Companies operating under the FXOpen brand, nor is it to be considered financial advice.

CAD JPY BUY Trade Setup 2 hour timeframe On the 2 hour timeframe CAD JPY has broken a key structure level forming a Higher high and higher low uptrend pattern, we need to wait for a retest of the higher low level for the completion of a Bullish Break and Retest pattern, also this level align with the Fib Retracement zone 0.618-0.50
Entry will be based off candlestick confirmation on the retest level.
Patience Patience ⏰👌🏻

Xauusd surely fly XAU/USD trades near a fresh weekly high of $2,929.65, with higher highs in sight. The bright metal benefited from the broad US Dollar’s (USD) weakness, the latter affected by tepid United States (US) data and President Donald Trump’s massive tariffs on trade partners.
President Trump addressed Congress late on Tuesday and played down the potential negative effects of his latest round of tariffs. “. There'll be a little disturbance, but we're okay with that. It won't be much,” Trump said, adding that reciprocal tariffs on trading partners will come into effect

Xauusd confirm buy tradeXAU/USD, in the meantime, retains the $2,900 mark but retreated from an intraday peak of $2,927.91. The daily chart shows the pair is up for a second consecutive day, with another leg north still in doubt. XAU/USD is currently battling to overcome a mildly bullish 20 Simple Moving Average (SMA) while the 100 and 200 SMAs recovered their upward slopes far below the current level. Technical indicators, in the meantime, advance with moderated strength and within neutral levels, not enough to confirm a higher

Gold surely fly confirm trade read the caption Markets remain risk-averse as a global tariff war seems inevitable, with US President Donald Trump affirming 25% tariffs on Canada and Mexico effective on Tuesday while he already signed the order to raise China tariffs to 20%.
In response, China’s Commerce Ministry and the Canadian prime minister’s office confirmed retaliatory tariffs on the US, triggering a tit-for-tat situation, which could translate into a full-fledged trade war

Gold weekly expected move read the caption The metal resumes higher in wave ((iii)). Up from wave ((ii)), wave i ended at 2766.3 and wave ii ended at 2744.78. Wave iii higher ended at 2798.55 and wave iv pullback ended at 2788.43. Expect wave v higher to end soon which completes wave (i) in higher degree. Then the metal should pullback in wave (ii) in 3, 7, or 11 swing to correct cycle from 1.28.2025 low before it resumes higher again. Near term, as far as pivot at 2730.23 low stays intact, expect dips to find support in 3, 7, 11 swing for more upside

Gold dipping now keep hold short read the caption Gold price stands tall near fresh record highs after closing Thursday well beyond the symmetrical triangle target of $2,785 or the previous all-time high of $2,790.
The 14-day Relative Strength Index (RSI) is currently near 68, suggesting that there is more room to the upside before Gold price enters the overbought territory at 70

Gold will buy that's confirm read the caption The dismal mood somehow eased ahead of Wall Street’s opening, with the three major indexes now trading in positive territory. Gains however, are modest as investors gear up for the Federal Reserve (Fed) monetary policy announcement. The Fed is undergoing a two-day meeting, which will conclude on Wednesday. Officials will announce their decision afterwards, with officials widely anticipated to keep interest rates on hold. Whereas the accompanying statement and Chairman Jerome Powell’s speech are dovish or hawkish and will decide the market’s direction

Confirm analysis of gold read the caption Inflation in the US, as measured by the change in the CPI rose 2.9% on a yearly basis in December from 2.7% in November, the US Bureau of Labor Statistics (BLS) reported, matching expectations. When compared to the previous month, the CPI was up 0.4%, after adding 0.3% in the previous month. The annual core CPI, which excludes volatile food and energy prices, rose 3.2%, below the expected 3.3%. The news sent stocks skyrocketing and bond yields lower as investors lifted bets on the Federal Reserve's (Fed) upcoming

XAUUSD IS READY TO FLYING MUST READ THE CAPTION This chart displays an hourly analysis of Gold (XAU/USD) with a potential bullish setup. Here's a breakdown:
1. Trend and Price Channel:
A rising parallel channel is drawn, suggesting a short-term uptrend.
The price has respected the channel boundaries, bouncing off the lower and upper limits.
2. Key Levels:
Support: Around 2,635 (stop-loss level).
Resistance: Around 2,680-2,685 (target area).
3. Trade Idea:
The chart indicates a buy setup:
Entry: Around the current price (2,653).
Stop Loss: Below the channel at 2,635, providing a buffer against downside risk.
Target: 2,680-2,685, just above the channel's upper resistance.
4. Projection:
The white arrows suggest a predicted price movement:
A potential retracement before moving higher to the target zone (2,680-2,685).
5. Risk-Reward:
The setup offers a favorable risk-reward ratio if the price continues to follow the channel's trajectory.
Analysis: The chart anticipates a continuation of the uptrend as long as the price remains within the channel. If the price breaks below 2,635, it may invalidate the bullish outlook.

EUR/USD Faces Key Rejection – Bearish Pressure IntensifiesThe daily candle is facing rejection from the descending trendline, confirming strong bearish pressure.
The daily trend remains negative, aligning with the broader bearish sentiment on the weekly chart. For bulls to regain control, EUR/USD must break above the trendline and the 100 EMA at 1.0670.
Failure to do so could lead to further downside, especially if the 1.0300 support zone is breached.
DYOR, NFA

Gold confirm analysis read the caption Spot Gold remains lifeless below the $2,650 level on a quiet Thursday as investors gear up for an extended weekend. The batch of United States (US) macroeconomic data released on Wednesday anticipated the ongoing quietness, as all American markets are closed amid the Thanksgiving Holiday.
On a positive note, the bright metal finds support in mounting expectations that the Federal Reserve (Fed) will deliver another 25 basis points (bps) interest rate cut when it meets in mid-December. At the time, according to the CME FedWatch Toll, the odds are roughly 70%

Gold buy now it will above 2700 read the caption On the hourly chart of Gold at FXOpen, the price formed a base near the $2,535 zone. The price started a steady increase above the $2,600 and $2,605 resistance levels.
There was a decent move above the 50-hour simple moving average and $2,675. The bulls pushed the price above the $2,700 resistance zone. Finally, the bears appeared near $2,720. A high was formed near $2,720 and the price is now consolidating gains

Gold confirm buy target here is opportunity read the caption Gold (XAU/USD) came under heavy selling pressure and slumped below $2,700 on Wednesday as US Treasury bond yields rallied on Donald Trump’s victory in the US presidential election. Inflation data from the US and Fedspeak next week could offer fresh insights into whether Gold will be able to shake off the bearish pressured

CADINR Forex Cross Pair strong rally expected in November 2024CADINR Forex Cross Pair strong rally expected in November 2024 with the strong weekly demand imbalance in control. Expecting a decent rally. Price action and supply and demand can tell us a lot about any Forex cross pair.

DXY (US Dollar Index) Analysis Daily TimeframeDXY is currently sitting at a daily resistance level after a bullish run since last week.
we anticipate a potential move to the downside as the index shows signs of weakening, by creating a Doji candlestick, which indicates market indecision.
Remember: If the US Dollar Index turns bearish, EUR/USD and GBP/USD are likely to show bullish momentum.
Let's take a closer look at these pairs for potential buy setups.

Gold crash the bear & continue the bull read the caption (XAU/USD) is already up half a percent to trade in the $2,730s on Monday during the European session after rising over 1.0% on Friday. The precious metal is gaining on a mixture of increased safe-haven demand due to the intensifying conflict in the Middle East and moves by the People’s Bank of China (PBoC) to further ease credit conditions by cutting interest rates.

Gold will knock 2700 confirm read the caption There hasn’t been any catalyst this week for the rally in gold although we had a key technical breakout which might have increased the bullish momentum.
The lack of bearish catalysts though is helping to keep the bid going as the market has finished to reprice the aggressive rate cuts expectations that weighed on gold in the past weeks as it contributed to lift real yields.
In fact, in the bigger picture, gold remains in a bullish trend as real yields will likely continue to fall amid the Fed’s easing cycle. The pullbacks will likely be triggered by a repricing in rate cuts but unless the Fed’s reaction function changes, the uptrend should remain intact

This XAUUSD rally still seems to have a lot of momentum.According to the World Gold Council (WGC), the weakening USD was the main factor driving the XAUUSD higher, as the Fed's big rate cut caused the USD to decline significantly.
Rising geopolitical risks with the worsening situation in the Middle East also boosted safe-haven buying.
The biggest drag on XAUUSD last month was the "momentum factor". A higher XAUUSD in the previous month tends to put downward pressure on the price in the following month and vice versa. Other gold pairs also recorded strong gains.
