HG - Copper Setting Up For A Long Opprtunity At Extreme📊 Fundamentals first:
- Short-term: The copper market is turbulent—marked by sharp price spikes, crashes, and global shifts in stock levels.
- Medium-term: Despite forecasted surpluses from ICSG, technology innovations and steady demand (especially from China and green sectors) may underpin prices.
- U.S. risk factor: The tariffs remain a major wildcard, likely restructuring trade flows, increasing domestic input costs, and distorting global price differentials.
📈 Now the Chart:
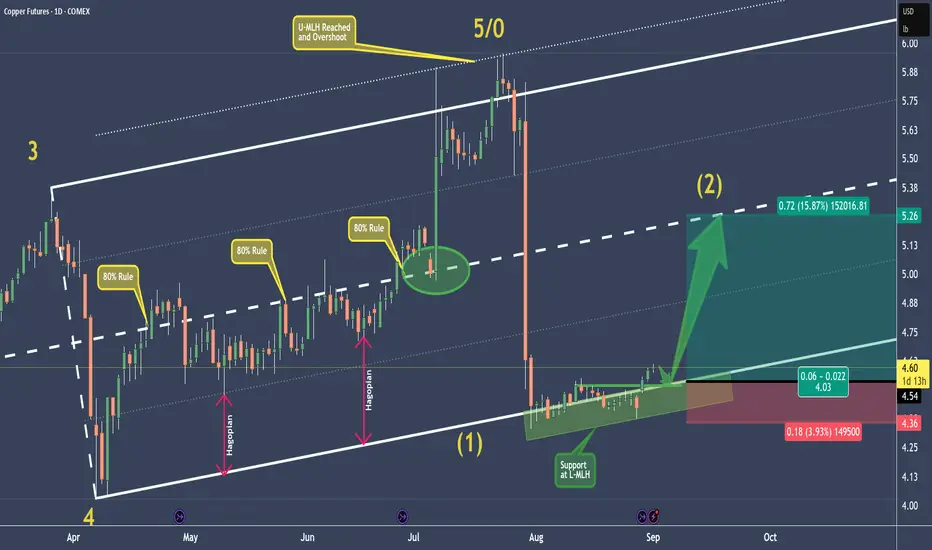
P5/0 at the U-MLH marked the end, and price dropped into the void.
Now, at the L-MLH we see support has built up.
The momentum we see now will probably lead in a pullback before the potential massive run-up to the Centerline.
💡 If the trading God gives me a pullback, I am willingly risk my 0.5% in this trade to make at least 4x more. 🦊
Happy new week to all §8-)
FORK
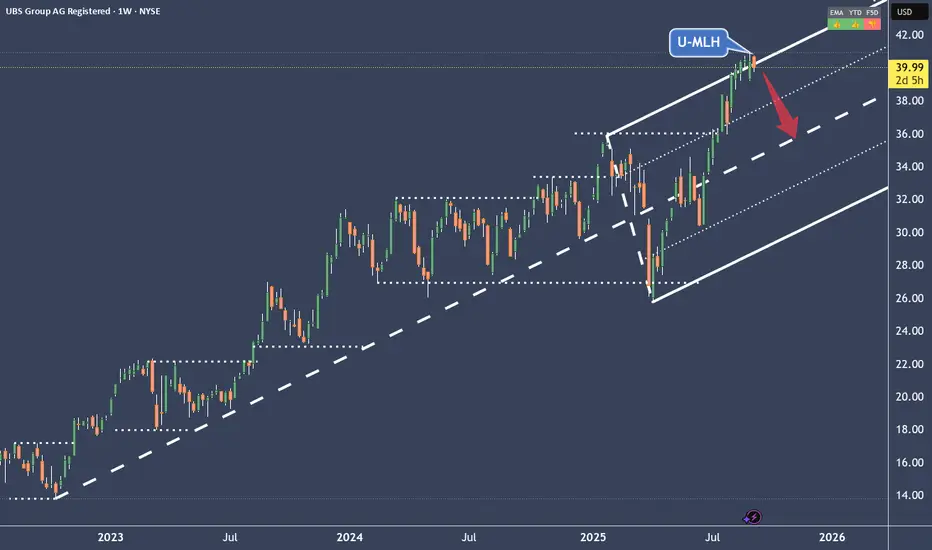
UBS Swiss Bank ran too hot for my likingBut I like it!
It's a fair short opportunity IMO.
Also, the setup is playing out very nice.
It opened & closed back into the Fork on the daily.
I approach it the same way like the Google short, with ITM Options (see link).
Target is the Centerline with an 80% chance of success.
CORN - Want some POP? Here it comes...maybe.Corn regained the orange Centerline.
Unfortunately I missed the retest.
But if we are lucky we get it again and then we can pull the trigger to get some nice crunchy Corn.
The Risk-Reward looks nice around the white Centerline.
BRB… off to the kitchen… 🌽🔥

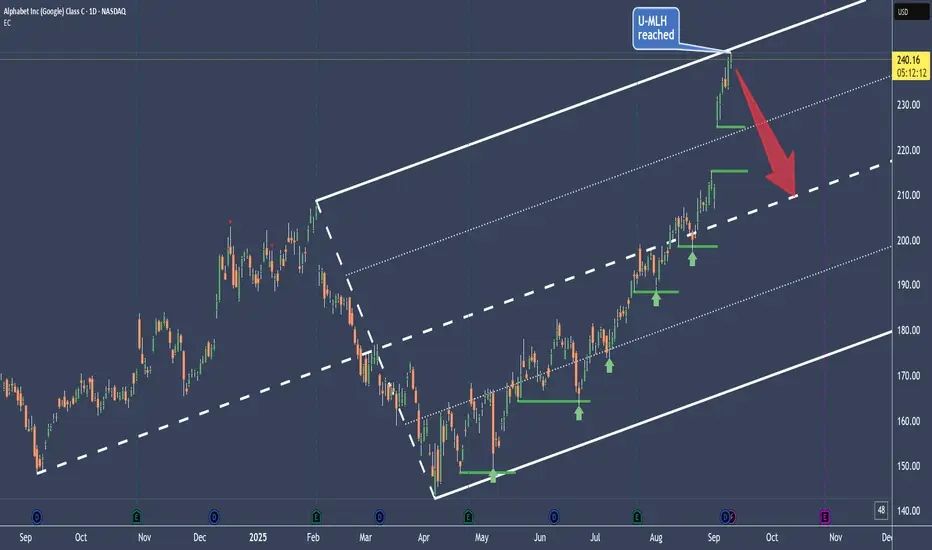
Google has reached it's stretch level👉 The rubber band is stretched 📉💥🐍
👉 Euphoria is at it's top 🚀💸🌕
👉 Greed eats brain 💰🤑👐
So, why not taking a casual short?
Let's say, with some ITM Put Options, just to define the risk?
Because if I short the UL, there's still a chance that greed and euphoria goes nuts and gaps way above the U-MLH.
So, let's give it time to mature, like a good old Whiskey §8-)
Cheers 🥃
XRPUSD is following our projectionThe red pressure line is broken.
After dabbling with the L-MLH, price decided to jump back into the fork, projecting a potential huge move ahead.
But not so fast!
The slope of the white fork is super steep.
In such situations I like to throw a Modified-Shiff-Fork, or a Shiff-Fork on the chart too. This gives me often more realistic profit targets.
The trade could be managed by using the light-grey fork's centerline as PTG1 and the rest of the position aims for the white mooning centerline §8-)
A second steak of the position could be loaded, after the yellow CIB-Line is broken. I like to wait for a test of it after the crack and jump-above. It's the same like a test/retest of a Medianline-Parallel if price broke out of it.
Let's have fun here §8-)

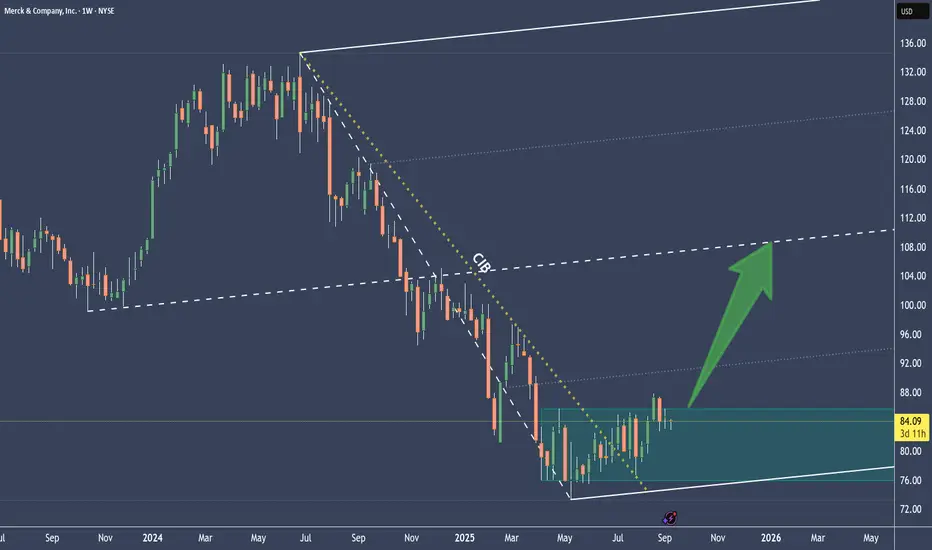
MRK is showing some breakout signsThe white fork is pointing slightly to the upside.
CIB is broken and signals a change in behavior. The pullback to it was very nice - a Eye twinkle? §8-)
Then price opened the door to the upside by peeking through the resistance of the consolidation, asking: "Anybody here to buy me?"...silence...so far.
OK, let's be patient and wait for another sign or hint.
Until the, stalking hat on, as my mentor Shane always said.
--> NO FOMO IN THIS CLASS! <--
Bitcoin is nearing supportFirst, we touched the white Centerline twice.
The third attempt was a miss and triggered a Hagopian, which got filled in mid-August.
Already below the yellow Centerline, Bitcoin wasn’t able to climb back above it.
Now, price is near the L-MLH of both Forks, indicating that potential support lies just ahead. Let’s see if we can hold at the white L-MLH and find a long entry, which would hopefully shoot us back up to the Centerline (remember: there’s an 80% chance of reaching the Centerline).
Patience is key, so let’s relax, grab some popcorn, and watch this movie §8-)

eBay - At this high, the air is thinThis overshoot of the U-MLH is a nice opportunity to stalk ebay for a Short-Trade.
1. wait for a close inside the fork
2. expect a test/retest at the U-MLH
3. on a break of a pivot, I enter short.
Profit Target 1 is the Centerline.
Further downside is possible, but has to be shown below the CL.
Happy new week folks §8-)

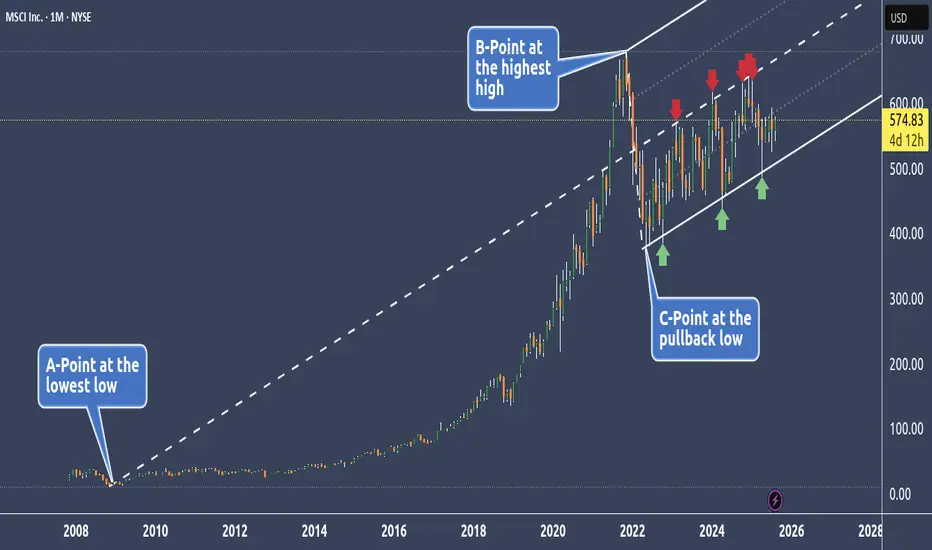
MSCI -Trading Within A Rolling ChopI love it how the Forks catch the most important angle for the underlyings.
Within the fork we can clearly see, that the L-MLH and the Centerline catch the High & Low of the rolling Chop, which is tilted to the upside.
Until the L-MLH is broken, there is no Short in sight, and we just can buy the Low and sell the High, with stops below structure or below the L-MLH.
Sometimes trading is simple - but it's seldom easy §8-)
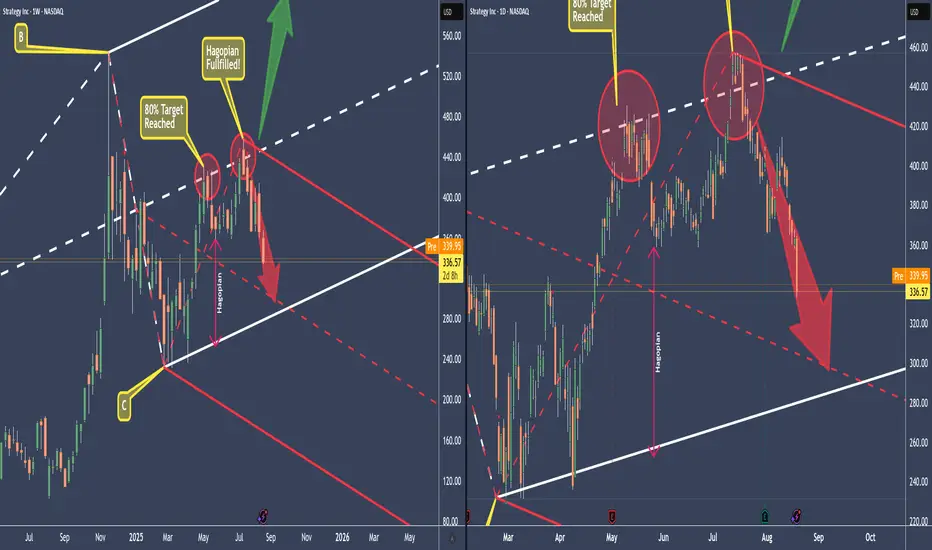
MSTR Ponzi is paying for my yearly steak & lobster subscriptionWe can see that from the white Centerline, MSTR has only been heading south. In contrast, Bitcoin has held up quite a bit better so far.
If you go back through my posts, you’ll see that I’ve been warning for a long time that MSTR is basically feeding itself. That simply can’t end well!
Either way – we gratefully take our profit and wait until we reach the lower centerline. Because we know there’s about an 80% chance that the price will fall back into temporary equilibrium, the Centerline
And if you’re not too greedy, well then you take 70%–80% of the profits now and let the rest run.
Anyone who was able to learn something from this trade or even make profits is welcome to boost and comment. §8-)
YT video will be available tomorrow.
...and on we go.
SPY – No hocus-pocus – Now the witch is hunting the bullsHappy Hump-Day y'all!
In the last post (see linked chart), I explained what the witch sees in the future.
A possible scenario that is long overdue: the markets are letting out air.
With the candles from yesterday and the day before, we have confirmation that the S&P 500 is heading south. That has consequences that not many want to see right now.
The bulls will be overrun, panic selling will kick in and drive the markets into the ground even faster. The current profit target is still the Centerline, as marked with the red arrow.
Whoever doesn’t cash in at least 50% of their gains now will end up in the witch’s cauldron §8-)
Let’s see how this develops.
The YT Video will be up tomorrow - gotta feed the witches cat §8-)
May the broom be with you!

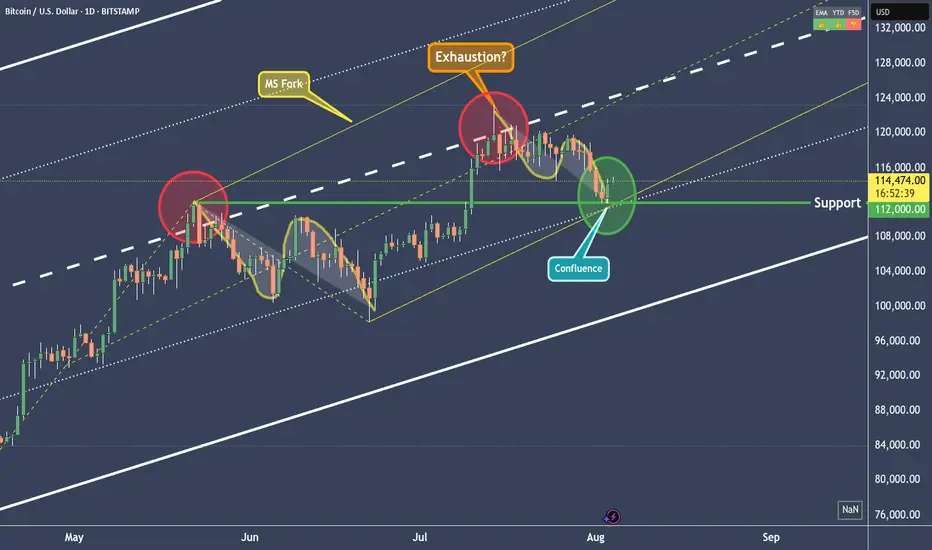
BTCUSD - Right to the point!In the last post (see the Linked Chart), I showed why BTCUSD would fall, and I also pointed out where the first price level for a possible pause might be.
On Friday, that level was reached, and the market seems to be turning *on the dot*. Will we now see higher prices again, or even a new all-time high? Let’s take a closer look:
The “confluence” point is marked by the white fork and the yellow modified Schiff fork. This point lies exactly on the 1/4 line. And this line often indicates temporary levels where at least a pause in the movement can be expected.
When we look at what Bitcoin did at this price level in mid-June, it seems likely that it will rise again. The overall pattern, from the centerline to the 1/4 line, looks extremely similar (see the A-B-C Wave Pattern)!
And yet, I’m not entirely convinced by the picture. Because this was the second time we reached the centerline.
For the brave, this wouldn’t be a bad entry point—or an opportunity to increase the position after this pullback. A possible stop for traders could be placed just below the current low, with targets at the centerline of course.
But why not just lean back, enjoy the profits, and switch into observation mode for now…
I will also make a video that explains the details and connections more clearly.
Happy Monday and stay patient to fight the FOMO! §8-)
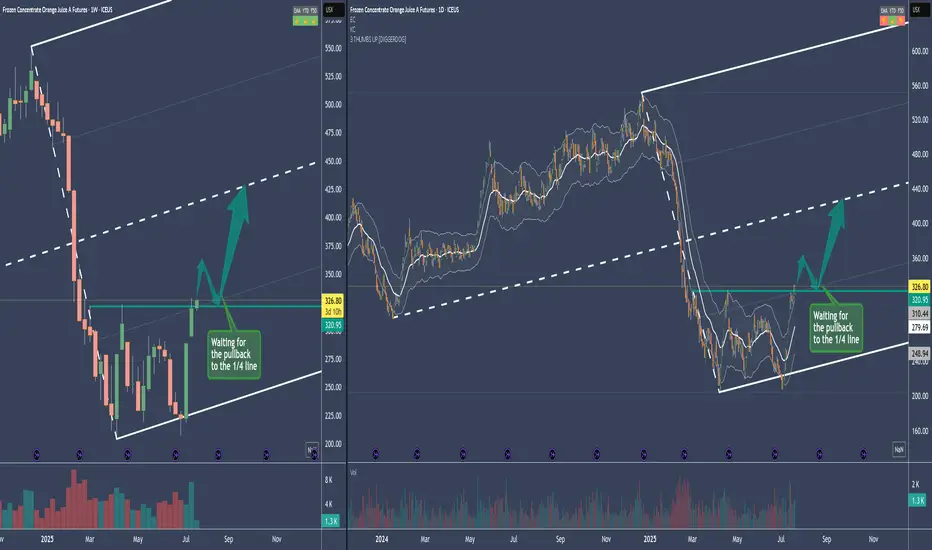
OJ - Frozen Orange Juice Long SetupThe Medianline se aka Fork, is a pullback Fork.
So what we want to see is a reversion to the mean after this drop.
The sideways action from Mar. to Jul. is a "loading" period, where Commercials load their boat.
If we break the resistance, it's usual that there will be a pullback to the prior resistance - now support. Or even into the loading zone.
Entries will be on a intraday basis.
Stalker mode on 88-)
Crude Oil - Two Scenarios and about Brain PowerPrice retests the L-MLH.
VI. - Price breaks upward, target is the centerline
VII. - Price reverses again, then the target is the 1/4 line, with a subsequent extended target at the red centerline, and possibly even lower at the white dashed warning line.
On a personal note:
I was once again told that the price didn’t do what I had projected.
...yeah, really, that’s how it is §8-)
After over 30 years in the markets and hundreds of coaching sessions, I’m still amazed that people think you can predict price movements as if with a magic crystal ball.
The fact that this belief still persists (even though they don’t understand even the absolute basics of trading) deeply concerns me at the core of my trading soul.
Because this growing irrationality clearly indicates that far too little is being done in terms of education – or humanity might simply go extinct in the next 100 years due to rapidly declining intelligence!
...maybe I should just create a chart and apply a few median lines/forks?
Happy trading to all of you and I pray for those with lesser brain power.

VISA - A Pump & Dump? Help me understand please.To places where no stock price has ever gone before..
What makes VISA so special?
The credit industry is currently staring into the abyss due to massively rising payment defaults.
Why is VISA skyrocketing in price, breaking through every barrier as if they were made of butter?
I don't know, and I'm very puzzled.
What will happen if economic conditions become even more difficult and the madness we're currently experiencing fully hits, and hardly anyone can service their consumer debt anymore?
I think at that point, VISA will look like a
Pump & Dump too like many others.
I'd appreciate any info on why VISA is rising so much.

DAX Take 1 Part 2 – Reloaded but not yet good to goThe first time, we saw the DAX poke the 1/4 line.
This was followed by several attempts (distribution by the big players), and from that point on, it headed south and the DAX rolled down the hill.
Currently, it looks very similar.
I’m watching and observing the break of the trend barrier very closely, even on smaller timeframes than the daily.
The profit targets are indicated by the red arrows.
After the break of the thick white centerline, a strong retest of the CL could be in store.
My main target would then be the red centerline.
Since the markets are behaving completely irrationally, I’ll need more “breathing room” in the trade and will handle this trade using long-dated LEAP options.
...poor little guy §8-)

S&P 500 – Projection to the SouthLooking at the market's behavior using the orange median line/fork, one can clearly see how the market reacts when it touches one of the lines.
Median lines/forks are not an oracle. They simply project the highest probable path of the price based on a mathematical calculation inherent to the tool.
If you follow the rule set, money management, and risk management, you have a wonderful framework that offers a significant advantage in trading the markets.
Let’s take a look at the current situation:
The orange fork:
– Price closes outside the fork (1)
– Multiple retests of the L-MLH (textbook behavior) (2)
– Break of the 1/4 line, heading toward the 1st warning line (3)
Next movement pattern according to the median line framework:
– Drop to the white centerline (4)
– Retest of the centerline (5)
– 1/4 line (6)
– Lower median line parallel (7) with a possible retest
– Orange centerline of the pendulum fork (8)
Wishing everyone a wonderful start to the week.

Nasdaq - Potential Huge Bounce AheadPrice nearly reached the L-MLH of the Red Fork.
This is a huge price stretch and chances are super high that we will see a big bounce to the upside.
As for PTG's I focus on the Red, and the Orange Centerline.

Incoming BNB chain forks with 0,75s block time!BNB chain upcoming forks significantly reducing block times, increase TPS and decrease fees!
The Pascal hard fork in March 2025 is a big milestone in BNB Chain’s evolution setting the stage for the two upcoming BNB Chain forks:
1. Lorentz (April 2025): Reduces block intervals to 1.5 seconds
2. Maxwell (June 2025): Further reduces block intervals to 0.75 seconds
Very bullish for all BNB chain projects and it´s main token BNB. Finally Ethereum compatible chain's direct hit to Solana's heart and it's performance. The Maxwell fork in June will be game changer for crypto industry.
My short-term prediction once Pascal fork is implemented to main net in the middle of March 2025.

Gold’s Next Move: Upward Momentum Building at Key SupportGold is reacting exceptionally well to the Fork.
It has not opened and closed below the L-MLH within a single bar, which eliminates any immediate downside expectations.
Instead, we observe a condensed, slanted trading range or coil, indicating that price is being gradually pressed to the upside.
In my previous post about Gold, I anticipated a rocket-like breakout. Since then, price has simply moved down to the L-MLH, finding support there. This price action, coupled with the ongoing upward pressure, confirms my analysis—albeit slightly delayed.
As NQ and S&P approach their respective targets, as outlined in my other analysis, I expect Gold to start moving upward, with targets at the CL and U-MLH.

NVDA - A 90% Short fall to the centerline ($100-$104) or lowerDouble top, failed breakout of the high—call it what you will.
Fact is, NVIDIA has taken a brutal hit and is now trading back inside the fork.
Hagopian—what on earth is a HAGOPIAN?
According to the Fork Framework rulebook, if the market fails to reach its next target (the next line, such as the centerline, lower median line parallel, etc.), it reverses and moves further back than where it started.
This is (not so exactly) what happened in December. Instead of reaching the centerline, the market turned, shot beyond the upper median line parallel (U-MLH), and was supposed to break above the November 21st high. It missed that target as well. And this, my friends, is....?
...again, a HAGOPIAN!
Now, it’s heading south again. But this time, we have an over 90% probability of reaching the centerline. Why? Because when the market breaks above the U-MLH and then falls back into the fork, it’s a very bearish signal.
Of course, nothing works 100%. The market could turn around today and push past the high. But statistically, we’re aiming for the centerline—and there’s an over 90% chance we’ll hit it.
When will it happen?
Sorry, my crystal ball is broken.
All I do is follow the Fork/Median Line rulebook and rely on my experience.
As for me, I’m opening a short position in NVIDIA today and may add to it on the way down to the centerline. And I play this game with Options, so no hard price level stop for me.

BCH - Still Strong ↗️Hello TradingView Family / Fellow Traders. This is Richard, also known as theSignalyst.
📈 BCH has exhibited an overall bullish trend , trading inside the rising channel in red.
At present, BCH is undergoing a correction phase and it is currently approaching the lower bound of the channel.
Moreover, it is retesting a demand zone in blue.
🏹 Thus, the highlighted red circle is a strong area to look for buy setups as it is the intersection of the blue demand and lower red trendline acting as a non-horizontal support.
📚 As per my trading style:
As #BCH approaches the lower red circle zone, I will be looking for bullish reversal setups (like a double bottom pattern, trendline break , and so on...)
📚 Always follow your trading plan regarding entry, risk management, and trade management.
Good luck!
All Strategies Are Good; If Managed Properly!
~Rich

Mr. S&P500, it's decision time again.So, here we are, below the red Center-Line.
What now?
If the Bears are successful, then we go south.
Target is the at least the white Warning-Line, or the red Lower-Medianline-Parallel. What ever is hit first.
On the other hand, P3 could be in and we get a bounce up for a re-test to P4.
This is a tricky situation.
Even more because the Nasdaq looks ready for a rebound.
What shall we do?
To me it's clear:
- if I short it, then my stop is above the CL. I don't know where yet, but it will not be super close. I rather play it with Options to give my idea more time, even if we get a bounce for a re-test of the L-MLH (gren) or the white WL.
- If I wait for more information, I accept the potential for not being on the Submarine if it tanks. What would I loose? Nothing - there's always another trade.
- And finally, on a re-test of the green L-MLH/WL, I can stalk a short from there.
Isn't that relaxing, to have so much opportunities? §8-)
Play it save Tr8dingN3rds.
