when to change your session bias and Take profit, YM! Long1. This video demonstrate when you should change you bias for the session, sometimes before session price action quite confusing but when you add SMT and strength switch concept to you bias you will see true price intention where it will go.
2. Always take entry or profit one level to another level, price always go from one level to another level.
3. This video I try to demonstrate how to take profit when you have to level to target, always look for the correlated instruments to build bias
Fractal
Market Re-Cap and Outlook for NEXT WEEKHere I am giving you a little insight as to what trades I am currently in, taken & looking to take for the week just gone and the week coming.
1 Winning trade on EU
1 Current open position on EU
EURGPB - Breakdown
AUDUSD - Breakdown
NZDUSD - Breakdown
Gold - Breakdown
If there are any pairs you would like me to share my feedback on give me a message and I will be happy to try and do so.
Thanks
Happy Hunting
EURUSD - BreakdownApologies video is a bit rushed.
Wanted to get it done before the weekend arrived.
There's so much more to this video and entry reason that I have left out unintentionally like the fact we swept the Asia lows before creating a BoS. There are also a few other things like I have left out but without looking at the chart right now I cannot remember off the top of my head.
I will post the idea of this trade below so you can see that I was taking it before it played out.
Hope you all have a great weekend and a better trading week than you had this week.
Enjoy
P.S if you have any questions please do message
EURUSD, GBPUSD - Outlook for next weekEURUSD - So we have 2x 4 hour POI's (Points Of Interest). Will be looking at potential reversals at both POI's however, within the first POI we have an area of potential liquidity that could look to be taken before we make out move back to the upside.
Therefor, the second POI could look to be our more solid option for our buying options at some point next week.
GBPUSD - This pair looks to be building its liquidity now for potential trades to the upside as today on the lower TF's it was setting quite a few traps for the potential longs and the traders that would have been shorting the breaks below structure to the left.
If you have any questions for me please do let me know
EURUSD, GBPUSD & EURGBP analysisHere's my outlook on the 3 pairs mentioned in the title. Looking for more upside momentum after we have some sort of pullback into the premium discount prices.
Once we get some15min bearish internal orderflow on the lower Time Frames I will look to enter short term sell positions before looking to take longer term buys on the way back up.
Again, if I can be of any assistance please do let me know and I will be happy to help where I can.
Can JTO pull a BNB All-Time-High Move??BNB made a similar pattern that led to it's previous ATH.
Since we are still waiting on the new ETH a time highs, followed by altseason, we can expect to see altcoins beginning to increase when ETH trades sideways. More on that here :
We can also expect to see rallies across other altcoins:
and
But before we see a glorious altseason, ETH needs to start moving to the upside as a starting point.
_______________
BINANCE:JTOUSDT
BINANCE:BNBUSDT
ETH + ALTSEASON | NEW All Time Highs Soon ??This would have been the first time that BTC made a new ATH during a bullish cycle, but ETH didn't - are we too hasty?
Very interesting to compare the two side by side and see that ETH has much more to gain than BTC:
The BTC new ATH update can be found here:
______________________
BINANCE:BTCUSDT BINANCE:ETHUSDT
BTC | New ATH Incoming | + 135% ??A very interesting fractal from 2021 lead to a 135% increase - and a new all time high.
Bitcoin has been following similar patterns to the bullish twin-peaks in 2021. After a multi-month correction, the price proceeded to increase another 135% over the next few months. Some weeks fast, and some weeks sideways.
Is it possible that BTC follows a similar pattern - and increase another 135%, all the way to 170k?
Hec, I'd even be happy with just a 100% ! That would lead us up to around 149k, which can also be considered a phycological resistance zone.
While you're here! Check out this post on PEPE:
_________________
BINANCE:BTCUSDT
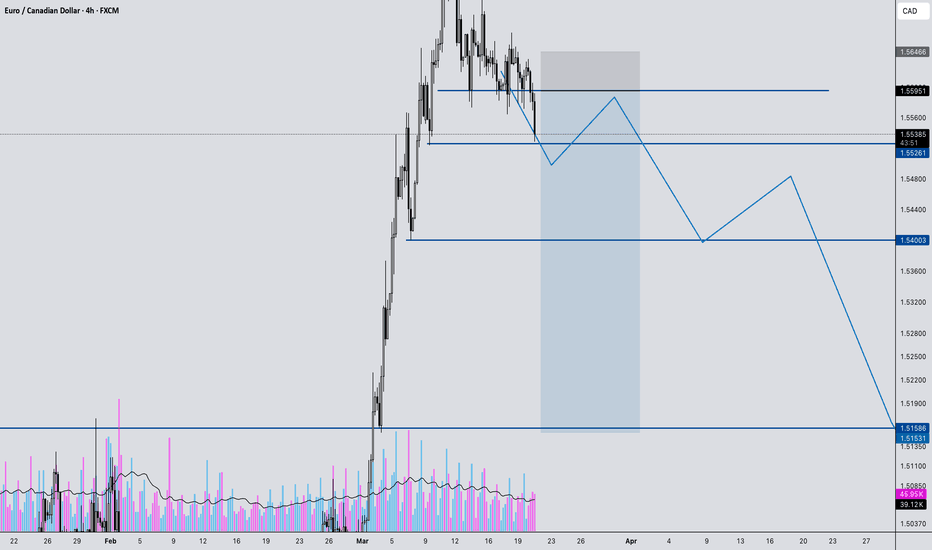
EURCAD Breakdown: Major Reversal Incoming? Watch This Setup!In this video, we analyze a high-probability trade setup on EURCAD, breaking down key market structure shifts and potential reversal zones. 📊
🔹 Massive impulse move into key resistance – Is a pullback coming?
🔹 Breakdown of bullish structure – Signs of a trend shift?
🔹 Key entry & exit points mapped out – Waiting for confirmation at 1.5595
🔹 Targeting major liquidity zones – Potential downside to 1.5523, 1.5400, and 1.5155
If price rejects our marked resistance zone, we could see a strong move downward, stopping out euphoric buyers and creating new trading opportunities. But what if it breaks above? We discuss both scenarios and how to react accordingly.
📍 Watch until the end for a full breakdown and trade execution strategy!
💬 Drop your thoughts in the comments! Do you see something different in this setup? Let’s discuss.
🚀 Like, share, and follow for more market insights!
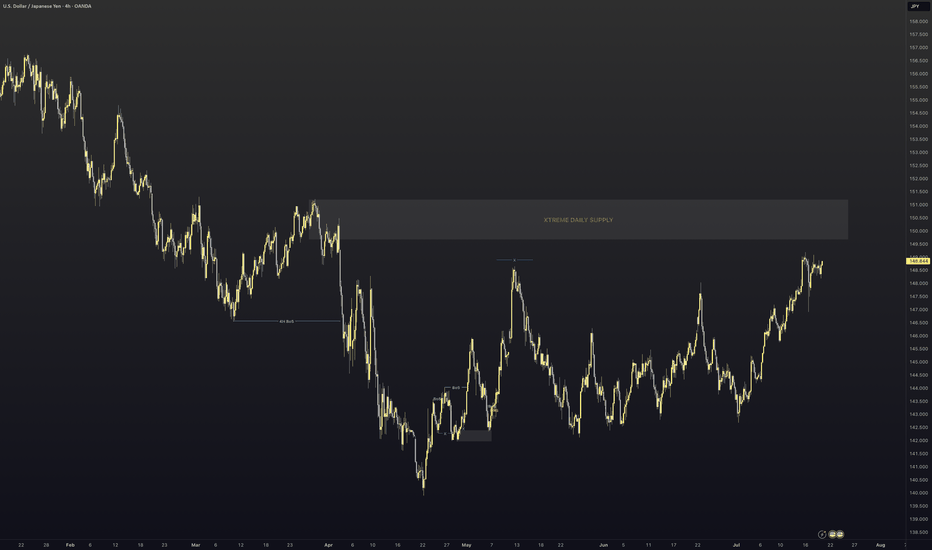
GBPJPY - MASSIVE Swing Potential Buy - Happening Now (March)This is a longer term swing idea.
Top down analysis from HTF indicates that:
- Push lower on JPYX Yen index
- Retrace higher on XXXJPY pairs
- Divergence in the Yen pairs, confirming a low
- Price Action has created a lot of liquidity on the downside, which has been taken, signifying upside.
Comment below if you have questions. Happy to help.
Peaceful Trading to you all.
The Daily Edge - 11th Mar 2025 Price breaks consolidation lows, but shorts remain on hold.
Market Context:
- Monday closed below the last three days of consolidation, signaling potential downside.
- No short entries taken yet as price hasn’t reached our POI at 2935-2940.
- Price retraced to 50 percent levels on both 4H and Daily, sitting in discount, not an ideal short zone.
- Major news events this week:
- CPI on Wednesday
- PPI on Thursday
- Expect deceptive price action leading into the releases.
Current Plan:
- Tracking a Market Maker Sell Model on 15M.
- Watching for a 3.5 - 4 range expansion from initial consolidation, aligning with our short POI at 2935-2940 (see attached TradingView chart).
- If price breaches 2930, we look for weakness at 2935-2940 for shorts.
- Short target is the previous daily low at 2830.
What’s Next:
- No trades until price reaches our POI. Avoiding trades in the middle of the range.
- Staying cautious of pre-news manipulation. CPI and PPI could trigger fake moves before a real breakout.
- Waiting for a clean setup. If structure shifts, we adapt.
Key Reflection:
How does waiting for price to trade into a high-probability zone improve execution and reduce unnecessary risk?
Trade with clarity and control. Hand-drawn charts keep you calm and focused. Join the PipsnPaper community today.
EURUSD - FOMC Prep - These 2 scenarios to anticipateMarket is overall uptrend after previous low showed the reversal point to head higher.
Bias is for the Buy
However, FOMC can produce volatility so we can have spikes in both direction.
There's a Sell scenario off an H4 gap.
But the preferred idea is to head lower, getting a better price on the HTF, then continue to the Equal Highs / Double top, taking out the liquidity target eventually.
Be aware, if it's not clear this week, we may have a clearer picture on next week's news and the move could also happen then if there's a delay/ranging market.
The D1 timeframe usually provides the smoother outlook. I mostly base my ideas on that.
Leave your comments below if you have any questions. Thanks
XRP Ripple - Going Higher Now? Swing Divergence with BTCThis is a top down idea from the HTF
M > W > D1 > H4 charts
All the clues of the price action are indicating higher prices on crypto - explanation in video.
One thing I didn't mention is that we also have a weak DXY (Dollar) so that adds to the idea of strength in XXXUSD pairs.
Reasons for choosing XRP over BTC is that XRP created a higher low, indicating more strength than BTC.
Entry on LTF is dependent on a pullback to get a cheaper price.
Entry on HTF is more flexible.
Comment below if you have any questions. I read everything.
Thanks
GBPJPY - Swing to Buy - Capturing the low on JPY WeakThis swing takes into account Liquidity points on all timeframes.
We are bullish on Monthly, Weekly.
JPY is weak - showing a reversal to the downside.
Weak JPY = Buy scenarios on XXXJPY pairs.
We have a bullish reversal in the form of a gap down and engulfing Daily candle which closes higher.
Looking to take more entries and scale in as we head to the expected highs - to maximise the setup.


