EURUSD I Monthly CLS - Model 2 Continuation Hi friends, new range created. As always we are looking for the manipulation in to the key level around the range. Don't forget confirmation switch from manipulation phase to the distribution phase to make the setup valid. Stay patient and enter only after change in order flow. If price reaches 50% of the range take partial or full close.
🧩 Complete proces and Strategy explained 👇 Click Below
👊 Your ultimate goal as a trader is not to be a generalist who knows 10 000 patterns. But rather create one system with narrowed criteria of each element of the trade to remove subjective and emotional decisions as much as possible and stick to this system no matter what. Practice it 10 000 times become a MASTER.
✨ Trading Mastery is reflection of your life
Have a longterm plan, No Alcohol & Drugs, Ignore others, Focus on your journey , Backtest regularly, Review your weeks, Journal mistakes, Exercise, Sleep well, Read books, Walks in nature (no phone) , Meditate, Reduce social media time, Spend time with family, Live Life.
Trading is hard, but not impossible. I believe in you 💪
David Perk aka Dave Fx Hunter
Fractal

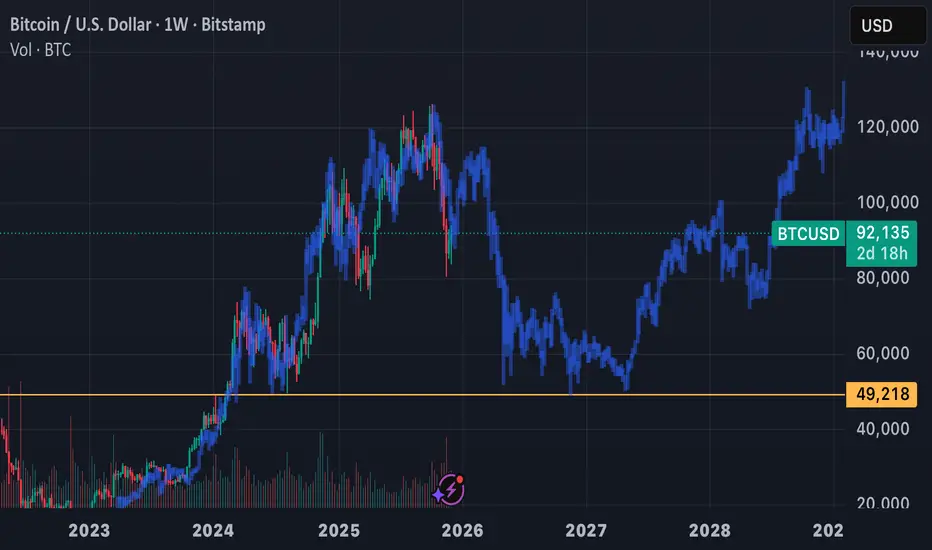
2021 BTC bull fractal indicates 2025 topthe current bull run tracks the structure of the 2021 bull run if fit correctly. I’d like to see how this plays out in the coming months!
WTI Crude – Macro Cycle OutlookWTI continues to track a dominant long-term cycle rhythm that has consistently produced major swing highs and lows across the past decade. The current positioning suggests we’re nearing the late stage of a down-cycle, which historically leads to accumulation, volatility compression, and eventual expansion.
The shorter oscillation (blue cycle) has been driving tradable swings roughly every 72 weeks, while the broader composite cycle (purple) points to a larger structural trough forming into the 2025–2026 window. If that timing holds, the coming quarters may represent a transitional regime.
CCI remains depressed but not capitulated, consistent with the “late descending phase” where momentum exhaustion precedes reversal but price can still grind lower.
CYCLE TAKEAWAY:
1. Late in down-cycle
2. Transitional phase likely
3. Potential for major cycle low into 2025–2026
4. Upside expansion historically follows these troughs
As always, cycles provide timing context, not trade signals – confirmation comes from price and momentum turning, not dates on a chart.
Not financial advice – sharing my cycle work for research and discussion.

XAU/USD 04 December 2025 Intraday AnalysisH4 Analysis:
-> Swing: Bullish.
-> Internal: Bullish.
Analysis and bias remains the same as analysis dated 20 October 2025.
Price has printed as per previous intraday expectation by printing a bearish CHoCH which indicates, but not confirms, bullish pullback phase initiation.
Price is currently trading within an established internal range, however, I will continue to monitor price with regards to depth of pullback.
Intraday expectation:
Price to continue bearish, react at either discount of 50% internal EQ, or H4 supply zone before targeting weak internal high priced at 4,380.990.
Note:
The Federal Reserve’s sustained dovish stance, coupled with ongoing geopolitical uncertainties, is likely to prolong heightened volatility in the gold market. Given this elevated risk environment, traders should exercise caution and recalibrate risk management strategies to navigate potential price fluctuations effectively.
Additionally, gold pricing remains sensitive to broader macroeconomic developments, including policy decisions under President Trump. Shifts in geopolitical strategy and economic directives could further amplify uncertainty, contributing to market repricing dynamics.
H4 Chart:
M15 Analysis:
-> Swing: Bullish.
-> Internal: Bullish.
Analysis and bias remains the same as yesterday's analysis dated 02 December 2025.
Price has printed as per analysis dated 14 November 2025 where I mentioned price to trade down to either discount of 50% internal EQ, or M15 demand zone before targeting weak internal high, priced at 4,245.195.
Price subsequently printed a bearish CHoCH, however, as mentioned yesterday, I would closely monitor price with respect to depth of pullback.
Price did not pull back with any significance, therefore, I will apply discretion and not classify an iBOS. I have marked this with red dotted and dashed lines.
Price has since printed another bearish CHoCH.
We are currently trading within an established internal range, however, as per yesterday, I will continue to monitor price with respect to depth of pullback.
Intraday expectation:
Price to trade down to either discount of 50% internal EQ, or M15 demand zone before targeting weak internal high, priced at 4,264.700.
Note:
Gold remains highly volatile amid the Federal Reserve's continued dovish stance, persistent and escalating geopolitical uncertainties. Traders should implement robust risk management strategies and remain vigilant, as price swings may become more pronounced in this elevated volatility environment.
Additionally, President Trump’s tariff announcements, particularly against China, are expected to further amplify market turbulence, potentially triggering sharp price fluctuations and whipsaws.
M15 Chart:

USDCAD – Bearish BiasUsing my Daily Bias Model, USDCAD is showing a clear Bearish Bias going into Thursday.
Here’s why:
Wednesday’s daily candle closed below Tuesday’s Low
Whether Wednesday swept Tuesday’s High or not does not matter for this condition
➡️ This confirms a Bearish Bias for Thursday.
Now during active trading session, we wanna see and old internal Highs being taken, or a trade into a lower timeframe FVG before trading to the main DOL (Previous D1 Low)
📌So in summary
Bias for Thursday: 🔻 Bearish
Expecting downward movement unless the daily structure shifts again.

XAU/USD 03 December 2025 Intraday AnalysisH4 Analysis:
-> Swing: Bullish.
-> Internal: Bullish.
Analysis and bias remains the same as analysis dated 20 October 2025.
Price has printed as per previous intraday expectation by printing a bearish CHoCH which indicates, but not confirms, bullish pullback phase initiation.
Price is currently trading within an established internal range, however, I will continue to monitor price with regards to depth of pullback.
Intraday expectation:
Price to continue bearish, react at either discount of 50% internal EQ, or H4 supply zone before targeting weak internal high priced at 4,380.990.
Note:
The Federal Reserve’s sustained dovish stance, coupled with ongoing geopolitical uncertainties, is likely to prolong heightened volatility in the gold market. Given this elevated risk environment, traders should exercise caution and recalibrate risk management strategies to navigate potential price fluctuations effectively.
Additionally, gold pricing remains sensitive to broader macroeconomic developments, including policy decisions under President Trump. Shifts in geopolitical strategy and economic directives could further amplify uncertainty, contributing to market repricing dynamics.
H4 Chart:
M15 Analysis:
-> Swing: Bullish.
-> Internal: Bullish.
Analysis and bias remains the same as yesterday's analysis dated 02 December 2025.
Price has printed as per analysis dated 14 November 2025 where I mentioned price to trade down to either discount of 50% internal EQ, or M15 demand zone before targeting weak internal high, priced at 4,245.195.
Price subsequently printed a bearish CHoCH, however, as mentioned yesterday, I would closely monitor price with respect to depth of pullback.
Price did not pull back with any significance, therefore, I will apply discretion and not classify an iBOS. I have marked this with red dotted and dashed lines.
Price has since printed another bearish CHoCH.
We are currently trading within an established internal range, however, as per yesterday, I will continue to monitor price with respect to depth of pullback.
Intraday expectation:
Price to trade down to either discount of 50% internal EQ, or M15 demand zone before targeting weak internal high, priced at 4,264.700.
Note:
Gold remains highly volatile amid the Federal Reserve's continued dovish stance, persistent and escalating geopolitical uncertainties. Traders should implement robust risk management strategies and remain vigilant, as price swings may become more pronounced in this elevated volatility environment.
Additionally, President Trump’s tariff announcements, particularly against China, are expected to further amplify market turbulence, potentially triggering sharp price fluctuations and whipsaws.
M15 Chart:

Possible Long Trade in USDJPY 1 HR TimframeReading raw price action has given us an impression that Buyers have taken control of the market. Advance Technical Analysis tools used.
1. Price Action Reading
2. Pitchforks
3. Market Manipulation techniques
4. Relative Strength Index
5. Frequency Shifting

EUR/USD Double Top Formed: Pullback to 1.61 in FocusEUR/USD appears to have formed a double‑top reversal pattern after reaching last week’s targets. From here I see a potential pullback toward the 1.61 zone as support before any further upside — price action suggests consolidation and market indecision.
📈 Technical Context
The double top suggests potential weakness, but a dip to 1.61 could set up a base for the next bull move.
If 1.61 holds, we may see another push upward — invalidating the bear signal.
A clear break below recent lows would confirm the reversal and open downside toward support zones near 1.58–1.57.
🌐 Fundamental Drivers
Recent data from the eurozone showed inflation ticking slightly higher, possibly removing pressure on further policy easing by the European Central Bank (ECB).
With the euro more supported and the Federal Reserve (Fed)’s rate‑cut path under scrutiny, USD weakness could help EUR/USD recover.
The divergence in monetary‑policy expectations — stable eurozone rates vs. uncertain U.S. rates — continues to attract euro demand.
✅ Summary: Watch 1.61 as the Key Pivot
A bounce at 1.61 could resume upward momentum.
A break down opens risk toward 1.57–1.58.
Fundamental backdrop tilts favorably toward EUR — but price action must confirm.

XAUUSD M30: Looking for LONGFrom my previous analysis, I anticipated Gold to react from the far-left demand zone, which it successfully did—allowing me to catch the move. However, there’s still an additional opportunity for a potential buy setup from the M30 LPS (Last Point of Support) as price continues to structure itself

Upcoming Deep Crash in XAUUSD Sellers Taking control of the market at a point where a decent manipulation was done earlier.
Techniques used:
1. Price action reading
2. Market Manipulation
3. Advance Line work

USDCAD - Bearish BiasAnalyzing the previous candle on the D1 timeframe (Tuesday's candle), we can see we had a clear sweep of other previous D1 candle's high (Monday's candle).
Now after the sweep of Monday's high, we closed back inside Monday's candle range. So with that in mind, I'm anticipating, and confident enough that the next liquidity price is gonna draw to is Tuesday candle Low, and possibly if there's high volume, we wanna see previous Fridays Low also being takes.
And that alarms the bias for today (Wednesday).
That does not mean going on to your chart 📉 and putting your SELL order, but with careful analysis, we first anticipate price to pull back into a PDA, 1h Internal Range Liquidity (a FVG, a sweep into an old highs or testing and OB), only then we can be confident hunting for sells in alignment with the overall BIAS for today.
I'm Zak, and I'm starting a new journey in giving back the knowledge I've acquired in my 4 years trading experience.
So if you found this useful, please show me your support and I'll continue to do this everyday.
Much love trader 😊

Side way Breaks to new all time high Hello Traders,
i can see big volume compared to the monthly trading at the ending of side way markets which will lead for a continuation for the bullish trend targets is already mentioned and it depends what you are investing for short intermediate long if we break the discount area we well go for big correction advice to sell with the retest however if we breaks the discount area huge profits coming. if you like the idea kindly show your support for more ideas to come good day.

ETHUSDT /// 2DECEthereum lately has been showing signs of weakening after losing the support area around $3400–$3600. With this break, the market structure has shifted toward a more bearish tone, meaning the asset may continue forming lower highs and lower lows as long as downward momentum remains dominant.
At the moment, price reactions around the $3000 zone suggest that supply is still relatively strong. If this structure continues, several potential bearish paths remain valid.
⸻
Possible scenarios toward the $2000 region
Scenario 1
If the $3000 area acts as a local high, Ethereum could continue its downward trajectory toward the $2000 zone.
In such a case, the price might develop smaller corrective upward movements within the broader bearish leg.
⸻
Scenario 2
Another possibility is that the $2800 area generates a short-term bullish reaction.
Such a move could push the price toward the $3600–$3800 range before facing renewed selling interest.
If that happens, a continuation toward the $2000 zone could remain on the table.
⸻
General outlook
In both scenarios described above, a revisit of the $2000 area is one possible development based on the current technical structure.
This outlook is purely scenario-based and may change if the market structure shifts.
⸻
About the possibility of $1000 ETH
Reaching the $2000 zone does not automatically imply deeper downside.
However, the manner in which price approaches that area could provide clues:
• A sharp, capitulation-type decline toward $2000 might suggest that a local bottom has formed.
• A slow, corrective decline could indicate weakening momentum, in which case observing price behavior after reaching $2000 becomes important.
If bearish continuation patterns appear at that stage, lower levels — including the $1000 region — cannot be ruled out as long as the downtrend structure persists.
Once price interacts with the $2000 zone, I will share an updated analysis based on the new market structure.

XAU/USD 02 December 2025 Intraday AnalysisH4 Chart:
-> Swing: Bullish.
-> Internal: Bullish.
Analysis and bias remains the same as analysis dated 20 October 2025.
Price has printed as per previous intraday expectation by printing a bearish CHoCH which indicates, but not confirms, bullish pullback phase initiation.
Price is currently trading within an established internal range, however, I will continue to monitor price with regards to depth of pullback.
Intraday expectation:
Price to continue bearish, react at either discount of 50% internal EQ, or H4 supply zone before targeting weak internal high priced at 4,380.990.
Note:
The Federal Reserve’s sustained dovish stance, coupled with ongoing geopolitical uncertainties, is likely to prolong heightened volatility in the gold market. Given this elevated risk environment, traders should exercise caution and recalibrate risk management strategies to navigate potential price fluctuations effectively.
Additionally, gold pricing remains sensitive to broader macroeconomic developments, including policy decisions under President Trump. Shifts in geopolitical strategy and economic directives could further amplify uncertainty, contributing to market repricing dynamics.
H4 Chart:
M15 Analysis:
-> Swing: Bullish.
-> Internal: Bullish.
Price has printed as per analysis dated 14 November 2025 where I mentioned price to trade down to either discount of 50% internal EQ, or M15 demand zone before targeting weak internal high, priced at 4,245.195.
Price subsequently printed a bearish CHoCH, however, as mentioned yesterday, I would closely monitor price with respect to depth of pullback.
Price did not pull back with any significance, therefore, I will apply discretion and not classify an iBOS. I have marked this with red dotted and dashed lines.
Price has since printed another bearish CHoCH.
We are currently trading within an established internal range, however, as per yesterday, I will continue to monitor price with respect to depth of pullback.
Intraday expectation:
Price to trade down to either discount of 50% internal EQ, or M15 demand zone before targeting weak internal high, priced at 4,264.700.
Note:
Gold remains highly volatile amid the Federal Reserve's continued dovish stance, persistent and escalating geopolitical uncertainties. Traders should implement robust risk management strategies and remain vigilant, as price swings may become more pronounced in this elevated volatility environment.
Additionally, President Trump’s tariff announcements, particularly against China, are expected to further amplify market turbulence, potentially triggering sharp price fluctuations and whipsaws.
M15 Chart:

USD/JPY - Dolar can't let Japan win much more than already did.With the current PA, we just entered the discouunted prices and the bullish orderflow.
It is a nice reaction from the 0.7 mark of the fibbonaci retracement.
I am seeing that UJ could potential fly to a new HH.

XAU/USD 01 December 2025 Intraday AnalysisH4 Analysis:
-> Swing: Bullish.
-> Internal: Bullish.
Analysis and bias remains the same as analysis dated 20 October 2025.
Price has printed as per previous intraday expectation by printing a bearish CHoCH which indicates, but not confirms, bullish pullback phase initiation.
Price is currently trading within an established internal range, however, I will continue to monitor price with regards to depth of pullback.
Intraday expectation:
Price to continue bearish, react at either discount of 50% internal EQ, or H4 supply zone before targeting weak internal high priced at 4,380.990.
Note:
The Federal Reserve’s sustained dovish stance, coupled with ongoing geopolitical uncertainties, is likely to prolong heightened volatility in the gold market. Given this elevated risk environment, traders should exercise caution and recalibrate risk management strategies to navigate potential price fluctuations effectively.
Additionally, gold pricing remains sensitive to broader macroeconomic developments, including policy decisions under President Trump. Shifts in geopolitical strategy and economic directives could further amplify uncertainty, contributing to market repricing dynamics.
H4 Chart:
M15 Analysis:
-> Swing: Bullish.
-> Internal: Bullish.
Price has printed as per analysis dated 14 November 2025 where I mentioned price to trade down to either discount of 50% internal EQ, or M15 demand zone before targeting weak internal high, priced at 4,245.195.
Price has subsequently printed a bearish CHoCH.
We are currently trading within an established internal range, however, I will continue to monitor price with respect to depth of pullback.
Intraday expectation:
Price to trade down to either discount of 50% internal EQ, or M15 demand zone before targeting weak internal high, priced at 4,256.250.
Note:
Gold remains highly volatile amid the Federal Reserve's continued dovish stance, persistent and escalating geopolitical uncertainties. Traders should implement robust risk management strategies and remain vigilant, as price swings may become more pronounced in this elevated volatility environment.
Additionally, President Trump’s tariff announcements, particularly against China, are expected to further amplify market turbulence, potentially triggering sharp price fluctuations and whipsaws.
M15 Chart:

USD/CAD - USD on it's way to recover against CADFrom a fundamental perspective, the Canadian Dollar remains under pressure from its stronger counterpart, the USD. With ongoing geopolitical tensions between the two neighbouring countries, I expect the USD to continue gaining ground against the CAD.
From a technical perspective, the higher-timeframe (daily) chart shows a consistent respect of demand zones — each time liquidity was taken, price reacted cleanly inside demand. We’re seeing the same scenario now: price is retracing toward a 4H demand zone, sweeping the liquidity resting above it. At this stage, we want to see buyers stepping in to defend their positions.
On the lower timeframes, price is being squeezed after the drop from the last lower high, which failed to break previous structure. In my view, this offers a solid opportunity for long positions, especially since the current higher low remains protected. However, if this zone gets invalidated, the entire idea becomes invalid.
There is no clear bearish order flow, even on the LTFs — only a simple price drop followed by early signs of consolidation. Once the fractal structure turns bullish on the 4H chart, I’ll have even more confidence to extend risk and scale into the position.
From a fundamental standpoint, we’re all aware of the expected December rate cuts. A 0.25% cut from the Fed would not be a surprise — the real surprise would be if they didn’t cut, and how future policy would shift. In my opinion, the market is already pricing this in.
Make sure to follow for more analysis in the future.

EURUSD"The EUR/USD has the potential to fall (decline) from the price of 1.16132. The critical price level is 1.16219."

NZD/USD - A market that is too bearish to consider buysFor me personally, i will just skip the fact that the most recent price action was bullish just because if i zoom out the chart, the price was everytime reacting from the most highest supply.
Right now, price just entered inside the supply zone from the bearish orderflow (daily chart), took liquidity and just waiting for any kind of reaction to sell this market to a new LL.

Weekly Bitcoin Analysis — Correction Risk & Possible Buy ZonesHello dear traders and friends 👋 Glad to share my analysis and view with you.- On the weekly timeframe, CRYPTOCAP:BTC appears to have entered a period of time-based correction. - Considering a possible fractal structure and key “golden zones” of support, I expect another downward move in the near-term — potentially toward ≈ 94–96 K USD before any rebound. - If price continues lower, the ≈ 72–62 K USD zone could become an attractive buying opportunity. - If the market breaks below ≈ 80 K USD (recent low), then this analysis should be re-assessed. - Based on these levels: * Personally, I plan to consider a short position around 94–96 K USD, * And possibly enter a long position in the 72–62 K USD zone — aiming for higher targets. > ⚠️ This is just my personal view/analysis — not financial advice. Always do your own research and use proper risk management.

EUR/JPY - A countertrend a day keeps the losing streak awayEUR/JPY currentlly is resting inside the internal move that started from the most recent HH formed.
As a swing view, EUR/JPY is in a clear uptrend, making LH and HH with a beautifull bullish orderflow conection.
At least for now, we accumulated a lot of liquidity inside this move to the upside, leaving behind us a trendline liquidity ready to get caught as a trap. From the most apropiate supply zone, I am expecting that the price will react to downside.

EUR/NZD - Ready to catch a fallinng knife?Hello traders,
Righht now, we see on EUR/NZD a really nice drop of the price, but if we zoom out the picture, we just entered the demand zone on HTF and we are squizing inside a wedge.
For me, it would be interesting to see a HL forming inside this demand zone and wait for some confirmation that we can boost the price higher, and profit ourselfs going long in this market.
Also, considering the fact that on LTF the drop itself is overextended, even if it would want to continue more to the downside, than it will have to retrace to the most current supply zone.
For more analyses, follow me.

SOLUSDT /// 30NOVSolana has consistently shown resilience across multiple market cycles, repeatedly demonstrating its ability to establish new price structures and reach fresh targets. Despite this long-term strength, the asset is currently under notable selling pressure. With Bitcoin experiencing a 30% decline, interest from investors and smart money toward Solana has also cooled off.
From a structural perspective, the $149 level remains a significant resistance zone, while the $127 support area appears increasingly vulnerable and may be tested or even broken in the near term.
This brings up a key question for many market participants:
Where could Solana become attractive from an investment standpoint?
In my view, the $100 region is where I would personally begin reassessing Solana for potential long-term positioning—depending, of course, on how price approaches that level and the quality of market momentum at that time.
As always, broader market conditions will play a major role in determining whether Solana can regain strength or continues to consolidate under seller dominance.
